The Weather Visualizer: A Java Tool For Interactive Learning Steven E. Hall, Mohan K. Ramamurthy, Robert B. Wilhelmson, Joel Plutchak, David Wojtowicz, and Mythili Sridhar Department of Atmospheric Sciences University of Illinois at Urbana-Champaign 105 S. Gregory Avenue Urbana, IL 61801
[email protected]
INTRODUCTION The growing accessibility of the Internet has opened a vast new world of possibilities for K-12 and higher education. From the first version of NCSA Mosaic to current Java-capable web-browsers, these technologies are slowly enhancing the power of the Internet more than ever before. However, this is an ongoing process, and one that is far from being completed. For example, a vast majority of the Web servers on the Internet can be categorized as information servers that simply provide access to a collection of documents / products / data / tools to a general audience. Another notable weakness of the so-called first generation Web servers is that they are by and large providers of static information, lacking the ability to let users interact with the information they browse. Nor is the information customized for the end user. This lack of interactivity, dynamic generation and customization critically hinders the effective use of the Web in a classroom setting (Ramamurthy et al. 1995). In an effort to address this need, the CoVis-Horizon group in the Department of Atmospheric Sciences (DAS) at the University of Illinois Urbana-Champaign (UIUC) has developed a web-based visualization tool known as The Weather Visualizer (http://covis.atmos.uiuc.edu/covis/visualizer/) that allows users to generate customized weather images from realtime and archived weather data. This resource is available on our environmental sciences web-server The Daily Planet TM (http://www.atmos.uiuc.edu/). By pointing and clicking, the user has complete control over which features appear on the final product. Hypermedia helper sections have also been incorporated to introduce and explain the importance of meteorological features found on the weather images. JavaTM development of the Weather Visualizer has significantly increased the user’s power to manipulate the data without placing extra strain on the server or having to repeatedly send requests across the network. It is our hope that the Weather Visualizer, coupled with other valuable Internet resources and curriculum, will support the creation of a learning environment, where the user, or student,
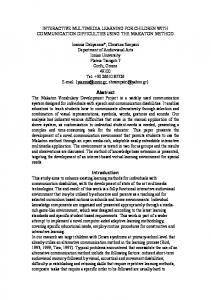
becomes more actively involved in the learning process through increased interactivity with the data sets. THE WEATHER VISUALIZER Several faculty and staff members from UIUC are participating in a NASA-funded project called HORIZON, which seeks to enable greater public access to earth and space science data through enhancements of and innovations in World Wide Web technology (Wojtowicz et al. 1995). An important UIUC contribution to HORIZON was development of the Weather Visualizer; an Internet visualization tool that allows public access to real-time and archived weather data. Users generate customized weather images from a point-and-click interface, increasing the interactivity with the computer by giving the user complete control over which features appear on the final product. We kept several design criteria in mind while developing the Weather Visualizer; 1) to provide reasonably fast access to customized requests, 2) to offer a managable number of data options to choose from, and 3) to implement this tool in a user-friendly environment accessible to a wide variety of hardware platforms. The introductory document of the Weather Visualizer (Fig. 1) consists of a graphical panel of six main categories of weather topics (e.g., Surface Observations, Upper Air Observations, Upper Air Soundings, Radar Summary, Satellite Imagery, and Forecast Data).
The Weather Visualizer
effectively use multimedia technology to introduce and discuss essential concepts in atmospheric sciences.
THE WEATHER VISUALIZER IN THE CLASSROOM
Surface UpperAir
Forecast Sounding
Satellite
Radar
Figure 1. The Weather Visualizer main menu. Each main section contains one or more subsidiary HTML (HyperText Markup Language) forms or documents that present choices and solicit input as to which meteorological parameters to display. When selection of the parameters is completed, the form is processed, resulting in the return of the image, plot, or textual data requested. Processing of the HTML forms is done using the Common Gateway Interface (version 1.1) in the form of Perl scripts. These scripts interpret the user input from the form, translate that input into the appropriate actions, and format and return custom HTML documents that present the results of the request. Typical end products would be a map of US surface observations, radar echo summary, and frontal analysis superimposed on an infrared satellite image background; a table of forecast model output statistics; or a Stuve thermodynamic diagram. Much of the underlying processing is performed by programs from the WXP package, which was developed at Purdue University and is distributed by the Unidata Project. The server itself runs an up-to-date version of the HTTP daemon developed at the National Center for Supercomputing Applications at the University of Illinois. An additional feature of the subsidiary pages and forms is generous use of Helper sections, which are accessible by simply clicking on the word in question. For example, if the user clicked on “Frontal Analysis”, instructional materials comprised of descriptive text and images would be accessed that introduce the various types of fronts, clarify how to identify fronts on weather maps, and explain their importance in interpreting the weather. The purpose of these helper sections is to equip the user with the knowledge and skills required for valuable and correct interpretation of the images (Hall et al., 1995). These resources are a part of a larger collection of instructional modules known as An Online Guide to Meteorology (http://covis.atmos.uiuc.edu/guide/). These modules
Several faculty from UIUC, along with project partners at Northwestern University and the Exploratorium museum in San Francisco, are participating in an NSF-funded project known as "Collaborative Visualization" or CoVis (http://www.covis.nwu.edu/). CoVis provides students with the opportunity to work and learn in an environment consistent with that of the scientific community (Hall et al. 1995). In this process, we have worked with teachers in the development of activities to transform their classrooms from traditional teacher-centered classes to project-enhanced classes in which students learn about science through personal and group inquiries (Ramamurthy & Wilhelmson, 1994). With the CoVis community encompassing nearly fifty high schools and elementary schools across the US, UIUC’s involvement in CoVis provides a practical testbed for the Weather Visualizer in an everyday classroom environment. In addition to the access of current weather images for classroom discussion, the Weather Visualizer was an integral part of a CoVis Interschool Activity (CIA) that focused on winter storms. In a step-by-step manner, students used instructional materials and weather data to investigate the role of lowlevel moisture, air masses, and other features in the development of snowstorms. To successfully complete the CIA, students were asked to construct weather scenarios from archived weather data accessed through the Weather Visualizer. Feedback from participants revealed that the Weather Visualizer, which gave the students complete control of the weather images they accessed, was a highlight of the curriculum. These and other CIA’s are found on the CoVis Geosciences Web Server (http://www.covis.nwu.edu/Geosciences/index.html), which contains a collection of project based activities that provide teachers with practical applications for data, student mentoring, and other Internet resources (Ramamurthy et al. 1995). From these activities, we realized there are certain limitations to using the Web to present customized data. Current HTTP daemons seem to be optimized to handle relatively short-lived requests that are not CPU-intensive. However, certain underlying operations of the Weather Visualizer entail fairly intense computations so that initially, a couple dozen simultaneous requests for such data slowed the server down to unacceptable levels. These limitations prompted modifications in the design and implementation of the Weather Visualizer. To this
end a few tasks, such as the remapping of satellite imagery as the data was received, substantially raised the number of requests that could be processed simultaneously, while still preserving the interactivity and customizable nature of the Visualizer. The classroom testing raises an important aspect of the Web, the issue of scalability. In current Web architecture, the bulk of the compute power on a client is left untapped when accessing a server. If the number of clients keeps increasing disproportionate to increases in server capacity, then the clients at some point will have to share in the workload for the load to be sustained. A JAVATM TOOL FOR INTERACTIVE LEARNING The recent introduction of the Java environment by Sun Microsystems shows considerable promise in alleviating such scalability-related bottlenecks. In a Java environment, programs, or “Applets”, which are written in a C++-like Java language, can be executed on any client that is running a Java-based Web browser. The current Java version (Fig. 2) of the Weather Visualizer (http://covis.atmos.uiuc.edu/java/) provides access to a selected set of meteorological data for the United States (e.g., surface observations, satellite imagery, radar echo summary, frontal boundaries, isotherms and isobars). Display Data: Satellite Infrared Visible Water Vapor Surface Obs Isobars Isotherms Radar States
Image Coord Lat/Long (267,10) (53.5N, 92.4W)
Reload Help Temp -21C
Figure 2. Top half of Weather Visualizer Java page. Java applets that support highly interactive images are distributed and run locally on the user’s machine. Users are able to instantly add and remove various weather fields with a simple click of a button. Since this is accomplished without repeatedly sending requests across the network, the Java environment also relieves some of the strain placed upon Web Server computers. Several atmospheric variables are computed and displayed on the client side by simply moving the cursor over the image. These include latitude/longitude coordinates, calibrated temperature values from infrared
satellite imagery, and reflectivity values from visible satellite imagery. In addition, by pointing and clicking in the weather image, the user is able to access the latest model forecasts from the National Centers for Environmental Prediction (NCEP) for that particular location. This information is also displayed in graphical format for easier interpretation. Finally, hypermedia helper sections are accessible for the available features by simply clicking the help button next to the item in question. During the coming months, innovative developments of the Weather Visualizer will lead to increased interactivity between user and computer. Since Java distributes a significant portion of the workload to the client, this tool could also be used in schools with slower network connections. As Java becomes more accessible in the classroom, students will have faster and more flexible interaction with meteorological data than previously available using the World Wide Web.
CONCLUDING REMARKS The challenge of providing interactive educational resources via the Internet is growing. A great number of Web servers provide access to static products (images and text), providing very little interactivity for students. In an effort to address this need, the CoVis-Horizon group at UIUC has developed the Weather Visualizer, a web-based visualization tool that allows users to generate customized images real-time and archived weather data. Hypermedia instructional pages provide valuable content materials, introducing the meteorological features available in the Weather Visualizer while equipping the student with the knowledge necessary for correct interpretation the images themselves. We hope that the Weather Visualizer will become a valuable tool in the creation of an interactive learning environment, both inside and out of the classroom. Java-development of the Weather Visualizer will allow students to actively work with the weather data, instantly adding or removing data fields with a click of a button, promoting an effective and efficient use of the Web in a classroom setting. Much of this can be accomplished without having to repeatedly go over the network and thus reduces the load on the server itself, allowing it to provide weather data to a much larger audience.
REFERENCES Hall et al., 1995: The Design and Implementation of Multimedia Web-Based Instructional Modules in K12 Education. Proceedings of the Fifth Symposium
on Education. Atlanta, Meteorological Society.
Georgia,
American
Ramamurthy et al., 1995: CoVis Geosciences Web Server: An Internet-Based Resource for the K-12 Community. Proceedings of the Fifth Symposium on Education. Atlanta, Georgia, American Meteorological Society. Ramamurthy, M.K. and R.B. Wilhelmson, 1994: CoVis: A National Science Education Collaboratory. Proceedings of the Fourth Symposium on Education. Dallas, Texas, American Meteorological Society. Wojtowicz et al., 1995: IICE: Bringing Interactivity to Image-Based WWW Products. Proceedings of the Fifth Symposium on Education. Atlanta, Georgia, American Meteorological Society.