Working Papers No. 38/2015 (186)
TOMASZ KOPCZEWSKI
THINK NOT CALCULATE! IMPLEMENTATION OF FELIX KLEIN POSTULATES IN ECONOMIC EDUCATION WITH CAS SOFTWARE
Warsaw 2015
Think not calculate! Implementation of Felix Klein postulates in economic education with CAS software
TOMASZ KOPCZEWSKI Faculty of Economic Sciences University of Warsaw e-mail:
[email protected]
Abstract For the last two decades, there have been many attempts to broadly introduce the Computer Algebra System (CAS) programs to teach economics. So far, none of these trials have reported significant success. The purpose of this article is to investigate the reasons why this software is still not commonly used tool in teaching economics. Paper is based on interdisciplinary approach. Experience of introducing CAS to teach advanced microeconomics is being confronted with philosophy of science, anthropology, history of mathematics, history of economic thought, education, etc. This leads to coherent new approach to the application of CAS to teach economics using tools of blended learning and m-learning, where the postulates of mathematics teaching reform presented in 1905 by Felix Klein are the core point. One of these postulates is to shift from laborious calculations to presentations of results in the functional form, what allows for the demonstration of complex relationships in simple graphical form. By using this approach, students can devote more time to evaluation of the reality of operation of theoretical models. Introduction of Felix Klein postulates improves significantly the tradeoff between quality and accessibility of this software for students and teachers. To improve the efficiency of using CAS in teaching, this paper presents tools created by the Author. One of those is to use language corpus analysis to isolate the most often appearing MAXIMA commands, what may simplify and accelerate the process of learning the programming language and syntax. Paper presents the Leontief (1935) Input-Output model as an example of using CAS in teaching microeconomics. This model is one of the most striking examples of the inadequacy of the teaching results obtained in relation to the effort of penand-paper calculations. Using CAS for this model is a qualitative change both in didactics as well can extend scientific research and theory applications. Keywords: Computer Algebra Systems, economic education, digital revolution, Maxima, Felix Klein JEL: A23, C02, C60, D57
Working Papers contain preliminary research results. Please consider this when citing the paper. Please contact the authors to give comments or to obtain revised version. Any mistakes and the views expressed herein are solely those of the authors.
Introduction
John von Neumann predicted that the economy, along with the arrival of computers, would become the cyber science - a science based on calculation methods, simulation, and algorithmics (Mirowski, 2002). Today, computers are an integral part of the economists’ workshop, but how they are used is far from the vision of von Neumann. While it is difficult to imagine modern statistics, econometrics, or operations research without the use of computer applications, so micro- and macroeconomics is still dominated by calculations using pen-and-paper. Especially in the teaching of these subjects it is difficult to see that for years tools have been developed that could significantly change the teaching process by making it more efficient. A chalk-and-talk approach still dominate in the classroom (Watts & Becker, 2008). Already two decades ago, Computer Algebra System (CAS) programs stared to perform basic procedures in symbolic computations such as arithmetic and matrix operations, differential and integral calculus, solving systems of linear and nonlinear equations, solving differential and difference equations. CAS also had procedures for linear and nonlinear optimization, statistical calculations, Monte Carlo simulation, and 2D and 3D visualization. Belsley (1999) and Li & Racine (2008) give an overview of the economic applications of CAS programs. Along with PC revolution and the development of CAS software such as Derive, Macsyma (later Maxima), Maple, and Mathematica, there was a chance to eliminate time-consuming calculations and to focus only on the analysis of mico- and macroeconomic problems. Despite the initial enthusiasm associated with the emergence of CAS software, it is still not used on a massive scale. Why the programs did not gain the right place in the teaching of economics? A similar question is often asked regarding the innovative IT projects, for which, though their high technological potential, they have not had a commercial success. Maney (2010) shows that in business solutions the relationship between quality of a consumer’s experience and availability is the main reason for the success or failure of the software. CAS software is a tool with great potential and to gain a wider audience, improvement is needed either in quality or availability. It is hard to imagine how you can improve the quality as these programs are state-of-the-art scientific programs. However, the success of IT solutions is not only derived from technical parameters. Quality is the consumer's experience – the subjective value added received by the users. For scientists, the quality of the use of these programs is the speed and reliability of the calculations. In teaching these features are not a sufficient condition of success. Students in the lab do not even approach the stage where the speed and 1
reliability of the calculations are of crucial significance. However, both teachers and students have to incur a relatively high cost of learning programming before the benefits of using these programs in the classroom are revealed. Using CAS software in teaching gives too little experience that students and teachers would be willing to suffer inconvenience due to having learnt a new program. Currently, CAS is treated in teaching as an auxiliary tool which adds value by shortening calculations and enabling visualizations. But this is no new quality of teaching, as this approach is just a duplication of calculations and visualizations, which are readily available both in books and on the websites. In the last few years a renewed interest in CAS software has appeared. This is a result of the emergence of CAS mobile and web solutions and the development of open-source software. These changes may induce a qualitative change in the use of these programs. However, the condition of use of this new opportunity in introducing CAS to teaching economics is the improvement in the quality-availability ratio. This paper is the collection of the educational, technical, and social solutions developed by the author, which may contribute to the rapid spread of CAS software in economic education. Main idea of this innovations was inspired by the history of mathematics. The problems of the relationship between theoretical mathematics, applied mathematics, and teaching mathematics were considered more than 100 years ago. The postulates of Felix Klein in 1905 in Merano, which referred to teaching mathematics, were: i) to dispose of units, ii) to present the results as functional form, and iii) to visualize the problem (Klein, 1939a, 1939b; Tobies, 2000). Nowadays, it may be applied to define the role of CAS in teaching economics. In the first part of this paper the CAS software is presented and the problems of the software implementation in mathematical and economic education are analyzed. Based on Klein postulates, it also presents the ideas for incorporating CAS in the teaching process. The second part presents the technical and social tools to increase the availability of this software. The third part is an example of using CAS software following the recommendations from the first and second part. It is a case study of the simple Input-Output Model (Leontief, 1935), for which traditional work with the students using manual calculations is the most glaring example of transforming an interesting economic problem into arduous and mechanic algebraic calculations without deeper understanding of the economic phenomena behind this. The paper was based on Maxima open source program and code examples used in teaching applied microeconomics.
2
1. The use of CAS software to teach economics
The idea of a wider introduction of CAS programs to teach mathematics emerged with the spread of personal computers in the early 90s (Kaput, 1992; Steen, 1988). The first publications discussing the possible application of MatCad, Mathematica, Derive, and Maple software in teaching economics appeared slightly later (Walbert & Ostroksy, 1997; Boyd, 1998; Hodgin, 1999). In addition, the first books which were entirely focused on the use of CAS programs in teaching microeconomics appeared (Varian, 1996; Huang & Crooke, 1997; Stinespring, 2002). Those publications were very optimistic about using CAS in teaching economics and stressed the chance of eliminating the time-consuming calculations and the growing capabilities of visualization. However despite the very promising prospects for the development in the early twenty-first century, the interest in these programs has slowed considerably, not only in the teaching of economics, but also for mathematics (Cuban, Kilpatrick & Peck, 2001; Ruthven & Hennessy, 2002). Even in the engineering sciences, where CAS seemed to be most successful, its spread in the teaching process has been regarded as slow (Jankowski, 2006; Schramm, 1998). The difficulty of introducing CAS software to economic education is an outcome of several factors. Some of them are common problems of introducing CAS to teach mathematics, while others are specific to economics.
Barriers to the introduction of CAS to teach mathematics
The first publications on the use of CAS in the teaching of mathematics focused on showing the software capabilities using case studies of innovative implementations of CAS in the teaching process. Then papers focusing on the impact of CAS on improving the curriculum of students (Lavicza, 2007) emerged. It highlighted the positive aspects of the introduction of CAS, both at the level of individual issues and also in general mathematical competences of students (Guin, Ruthven & Trouche, 2006). The slowness of the implementation of CAS to mathematic education was an unpleasant surprise for innovators of IT solutions in teaching. Research was undertaken in order to determine the causes of this state and indicated the CAS dissemination barriers, which mainly include the cultural and social factors which cause the resistance to change (Hennessy, Ruthven & Brindley, 2005). The phenomenon of resistance to change is the consistent mechanism of social life, including both teachers and students (Sierpinska et al., 2008). Even when enthusiasts attempted to introduce CAS software as a very interesting tool, this did not result in its wide dissemination because it faced opposition 3
from other teachers and the students themselves. Other lecturers do not want to innovate when using teaching methods that are already proven. This phenomenon is common when introducing any kind of teaching innovation. There have been many times where revolutionary new teaching tools did not defeat the resistance of potential adaptors, causing frustration for the innovators (Sierpinska et al., 2008). A prerequisite for the introduction of new developments in education and business is that innovations are seen as a significant improvement over existing procedures and techniques (Ely, 1999). In the case of CAS there is no clear message on the benefits of its introduction to the teaching of mathematics. The use of IT tools has become a subject of dispute in the "math wars" between supporters of the traditional approach to teaching mathematics and the constructivist-reformatory approach (Schoenfeld, 2004). In the traditional teaching approach, using a pen and paper is treated as better for developing intellectually than use of the software. However, even in the constructivist approach there is no uniform opinion on the use of CAS in the teaching process. Only in a few schools are students allowed to use the programs to solve tasks, both for homework as well as during exams (Lavicza, 2007). Introducing the CAS software to teach mathematics is regarded with suspicion, because common opinion is that it does not knead the skills of mathematical thinking enough. An effective teaching sequence is that the tasks are solved first with manual calculations, and the software is introduced in the future as an auxiliary tool, provided the mathematical intuition has developed enough (Marshall, Buteau, Jarvis & Lavicza, 2012). This is a pattern commonly found in the teaching of mathematics. The transition from solving textbook tasks to using those methods in practice is similarly treated. A prerequisite for the application of the learned knowledge is to go the next advancement level. Unfortunately, usually the next step begins with the adoption of identical assumptions. This pattern can be repeated several times. Using literary parallels and the vision of ad absurdum, this problem was clearly presented by Lockhart (2009). Currently, there is a stronger resistance to the introduction of CAS at an early stage of teaching mathematics (Lavicza, 2007). The rapid development of mobile and web applications of CAS in the last few years might be the cause of a new "war mathematical", whose main area of conflict will be the growing importance of CAS in mathematics education (Raju, 2004). The beginning of these changes was published in 2002, in a very controversial book “A New Kind of Science” by Stephen Wolfram, creator of Mathematica software. In this book he collects applications of very simple computer algorithms to explain the complex processes of physical, biological, and social sciences. This book has become the subject of much controversy and criticism 4
(Levy, 2002). The departure from the traditional approach to mathematics in favor of computer calculations based on cellular automats, proposed by Stephen Wolfram, was too radical and revolutionary to be widely accepted. It seems that technological changes can force a radical change in the attitude towards the teaching of mathematics and can introduce the widespread introduction of a new form of mathematics education, the computer based math. A project created by Conrad Wolfram, the computerbasedmath.org, is to be a social force that will support these changes at early stage of education. The growing importance of CAS programs can also instigate forced institutional changes in higher education in the European Union. The introduction of the Bologna system and the lack of entrance exams to study for the second degree (MA) has meant that a large number of students do not have sufficient mathematical competencies. Those students are often not able to participate actively in courses at the graduate level, without having a sufficient knowledge in economics from their first degree studies (Lavicza, 2007). CAS as software for symbolic computation, along with a codes catalog, may play the role of a pocket calculator for solutions to common economic problems for these students.
Barriers to the introduction of CAS - qualitative change in the use of CAS in teaching economics
Changes in the treatment of CAS software have also been recognized by the economists and recently there have been new publications (Hammock & Mixon, 2013; Leydold & Petry, 2011). However, these literature is still disproportionately narrow relative to the potential of this software. The main barriers facing the introduction of CAS to teaching is the lack of the use of CAS in the earlier stages of mathematical education, and above all the duplication of earlier methods of use of this software. Based on the analysis of publications and cases of CAS application in economics, two trends can be observed: i) there is fear about introducing CAS to basic courses ii) CAS is treated as a supplement to the books and teaching resources. A precautionary motive dominates, in which CAS is treated as a supplement to, and not a value in itself. CAS is also presented as a trade-off: faster calculations and visualization problems are exchanged for the cost of learning new software. However, if the use of this software is to replicate graphs and calculations that are available in books and on the web, then an even shorter computation and visualization of very attractive forms does not provide significant added value to compensate for the difficulty of learning this software.
5
What is needed is a new idea, how to improve the quality of using CAS in teaching economics. According to the Douglas (1986) hypothesis, progress in science is a process of continuous discovery of the same ideas that in the period of their creation had no chance of implementation. The idea of this can be found in history. The difficulties in implementing CAS to teach economics are similar to the problems in the teaching of mathematics more than 100 years ago. At the end of the nineteenth century, one could observe the separation of the theory, applications, and teaching of mathematics. It may seem quite bizarre, but a mismatch of academic mathematics with the needs of the developing industry and construction resulted in a boycott of academic lectures by engineers (Tobies, 2000). On the other hand, the teaching of mathematics at a primary level was based on the mechanical repetition of calculations. This type of teaching basic math was not congruent with the needs, neither of academic mathematics nor the applied one. The aim of mathematics education reformers was to create a coherent learning pathway from primary school to university. Postulates reported by Klein in 1905, at a conference of mathematicians in Merano, were to: i) to dispose of units, ii) to present the results as a functional form iii) to visualize the problem, and this became the basis of the reform of mathematics education. Klein presented the new rules for teaching mathematics in an inspiring and still published series of books on Elementary Mathematics from an Advanced Standpoint (1939a,1939b). Although not all postulates reported by Klein were introduced, it brought the desired effect and gave the foundations of mathematics in the development of engineering sciences (Tobies, 2000). These postulates were ahead of their time, and the appearance of the CAS program finally makes it possible to implement them fully. Economics missed the reform of teaching mathematics proposed in Murano in 1905. In contrast to the contemporary approach to economics as opposed to strongly mathematicised social science, the strong relationships of economics and mathematics are relatively new. Although the first attempts to use formal mathematical models in economics can be dated to the end of the nineteenth century, it is the second half of the twentieth century when mathematics became broadly introduced to economics. As pointed out by Weintraub (2002), a merge of economics and mathematics coincided with a period of significant changes in mathematics and was associated with the activity of mathematical formalists. This combination of changes, both in economics and mathematics, meant that economists, following mathematicians, concentrated on the axiomatic approach and aimed firstly to ensure that the model was correct in formal terms.
6
The price of a formal approach is a loss of realism in the economic modeling. After the economic crisis of 2008, a large part of the criticism of economics focused on the role of mathematics in economics. An extreme approach uses the stream of post-autistic economics tends to significantly reduce the role of mathematics and willingly uses the comparison of Feynman (1997), in which the use of mathematics serves as a ritual in the social sciences, making them similar to the CARGO worship (Komlos, 2014). Mainstream economics also recognizes the inadequacy of the use of formalism in economic theory in relation to the results obtained (Komlos, 2014). This situation is reminiscent of the one a century ago: the concentration of developing economics to create formal mathematical models with little interest in applications. This approach infiltrates the teaching of economics. At the first stage of learning, instead of linking economic problems and real economic life experience, the main focus is on the calculation of the equilibrium conditions, and then on analyzing the formal economic models. There is no tendency to learn how to understand economic processes, but only to count the mathematical models. As a consequence students are not interested in studying the theory of economics, they know little about the purposes of the economy as a whole, and their focus is primarily on obtaining grades and not gaining knowledge (Hamermesh, 2002; Becker & Watts, 1999; Watts & Becker, 2008). The implementation of Klein’s postulates changes the way of using mathematics in economics. This is a departure from mathematical formalism in favor of applied mathematics while eliminating timeconsuming calculations. The first of Klein’s postulates, to stop using units, is the basis for departure in math from counting in favor of mathematical modeling. This requirement has been introduced in both the natural sciences and in economics. It is hard to imagine the modern economy without creating micro and macro models. Even the Austrian school of economics, usually very critical of the use of mathematics, increasingly introduces an agent-based modeling and computational economics as a mathematical tool which is relevant to this theory (Vriend, 1999). The postulate of departure from units can be further developed in the economy as a wider use of dimensionless measures as elasticity in the analysis. Elasticity is a measure that is insensitive to the units and hence is easy to interpret. However, it rarely occurs either in teaching or in applications because of the laborious calculations. CAS programs enable the efficient handling of this measure. Klein's second postulate is to present the result in a functional form. In teaching economics the goal is not to repeat calculations of comparative statics but to see the result primarily as a function. The result is not just two or three points of equilibrium, but an infinite 7
number of points in the form of a function. When the solution as a function is visualized in CAS in 2D and 3D, this provides the unlimited possibilities for studying the "mechanics" and behavior of this model and results are easy to interpret. One can also analyze not only the functional form of a single solution, but the whole area and map of solutions as a family of functions. The sketch by Klein (Chislenko & Tschinkel, 2007) (see Plot 1) from the lecture notes on the values of the function depending on its parameters is made with great effort and time, and can now be obtained much easier and quicker by the use of CAS programs. Plot 1: Lecture sketch by Felix Klein
Source: The Felix Klein Protocols by Eugene Chislenko and Yuri Tschinkel, Notices of the AMS, September 2007, pp 961–970
This type of procedure, which examines the areas of solutions rather than single points is consistent with the approach by Leibenstein (1976). He postulated that due to the presence of inefficiency (X-Efficiency) the concept of equilibrium should not be limited to a point only, but treated as an area in which this equilibrium can be found. Another problem is the stability of the results. A common cognitive mistake of economists is striving to find a single and unambiguous result as a solution to the problem. It does not take into account the fact that the model must be corrected for errors which are not included in it and the fact that the minimum changes to the model parameters can give completely different results. It can be shown that even a very simple system of linear equations may contain an element of instability. In the below example of a simple system of linear equations, one of the parameters can be biased with measurement error ε.
8
{
0.3𝑥1 + 0.2𝑥2 = 0.2 (1 + 𝜀)𝑥1 + 0.8𝑥2 = 0.3
The solution of this system in graphical form as relations x1 = f (ε) and x2 = f (ε) is shown in Plot 2. On the basis of this chart it can be concluded that the solution to this system of equations can be unstable even for small values of error term ε. For the error ε = 0.19, x1 = 50, for ε = 0.21, x1 = - 50. The inference based on the basis of this economic model would be unbelievable. However, without performing this type of analysis, this result is not obvious. Plot 2. The solution of equations (1) depending on the measurement error (x1=f(ε) and x2=f(ε)) * 20 x1 x2
Solutions of system of equations; x1,x2
15
10
5
0
-5
-10 -2
-1.5
-1
-0.5
0
0.5
1
1.5
2
error
Source: Own plot in Maxima, own Maxima code in Anex 1*
The presentation of the result in the functional form and the third postulate by Klein visualization of the result - triggers the considerable potential of the CAS software. In many publications on education in mathematics, physics, economics etc., visualization is highlighted as a tool for teaching that has a positive influence on the understanding of the issues presented (Gilbert, 2005; Benedict & Hoag, 2012; Schwabish, 2014). In a somewhat broader sense it can be argued that without a graphical representation of the mathematical problem, its comprehension is difficult or impossible. This epistemological problem was pointed out by Klein (Torretti, 1978). Klein invited students to create 3D models of geometrical problems (Bussi, Taimina & Isoda, 2010). The idea of combining the mathematical intuition and visualization is graphically presented in form of Klein’s bottle. This is a three-dimensional representation of a surface with only one side and which is only 9
possible to describe in the four-dimensional space (see Annex 2). This visualization came to mass culture and inspired artists of "impossible art" (Abrams, 2013). Presented by Klein (1939a), the vision of a calculating machine as an aid in visualizing mathematical problems has been realized in the form of CAS software. All the technical conditions of this vision are met, but it is still far from full completion, especially in education. “Let us consider for a moment the general significance of the fact that there really are such calculating machines, which relieve the mathematician of the purely mechanical work of numerical calculation, and which do this work faster, and, to a higher degree free from error, than he himself could do it, since the errors of human carelessness do not creep into the machine. In the existence of such a machine we see an outright confirmation that the rules of operation alone, and not the meaning of the numbers themselves, are of importance in calculating; for it is only these that the machine can follow; it is constructed to do just that; it could not possibly have an intuitive appreciation of the meaning of the numbers. We shall not, then, wish to consider it as accidental that such a man as Leibniz, who as both an abstract thinker of first rank and a man of the highest practical gifts, was, at the same time, both. the father of purely formal mathematics and the inventor of a calculating machine. His machine is, to this day, one of the most prized possessions of the Kästner Museum in Hannover. Although it is not historically authenticated, still I like to assume that when Leibniz invented the calculating machine, he not only followed a useful purpose, but that he also wished to exhibit, clearly, the purely formal character of mathematical calculation. With the construction of the calculating machine Leibniz certainly did not wish to minimize the value of mathematical thinking, and yet it is just such conclusions which are now sometimes drawn from the existence of the calculating machine. If the activity of a science can be supplied by a machine, that science cannot amount to much, so it is said; and hence it deserves a subordinate place. The answer to such arguments, however, is that the mathematician, even when he is himself operating with numbers and formulas, is by no means an inferior counterpart of the errorless machine, ''thoughtless thinker" of Thomae; but rather, he sets for himself his problems with definite, interesting, and valuable ends in view, and carries them to solution in appropriate and original manner. He turns over to the machine only certain operations which recur frequently in the same way, and it is precisely the 10
mathematician - one must not forget this - who invented the machine for his own relief, and who, for his own intelligent ends, designates the tasks which it shall perform. Let me close this chapter with the wish that the calculating machine, in view of its great importance, may become known in wider circles than is now the case. Above all, every teacher of mathematics should become familiar with it, and it ought to be possible to have it demonstrated in secondary instruction.”
The relationship between the mathematical problem and its graphical representation has become an area of research in the philosophy of science (Shimojima, 2001). From the point of view of using CAS for the analysis of economic issues, visualization has two features which can be significant, both in teaching and scientific research: i) a free ride - it is a possibility at almost zero cost of the expansion of knowledge by the emergence of new facts that were not known before the creation of the visualization problem, ii) over-specificity – in contrast to the symbolic representation, the visualization of mathematical problem has more information than is needed in the inference process. Economics uses the visualization of models widely. However comparing the microeconomics textbooks from the basic level to the advanced, it is evident that together with more advanced topics, graphs become rare and are rather general, without assuming specific functional forms. Generally, inference based on symbolic representation dominates over graphical representation. Lack of full representation of the economic model which faithfully reflects the behavior of the economic models can be a way of avoiding questions about the realism of the results at every level of economic education. The example below presents the derivation of the demand function from the model of consumer choice as a problem of maximizing the CES utility function for a given budget constrain. −
𝑀𝑎𝑥 𝑈 = [𝛿𝑥 −𝜌 + (1 − 𝛿)𝑦 −𝜌 ]
1 𝜌
𝑠𝑢𝑏𝑗𝑒𝑐𝑡 𝑡𝑜 𝑝𝑥𝑥 + 𝑝𝑦𝑦 = 𝑀 where consequently: M is nominal income, px and py are prices of goods x and y, and ρ, δ are parameters of the utility function. The results obtained in the symbolic form are so complex that it is difficult to infer ad hoc on the behavior of the demand function for goods x and y.
11
𝑝𝑥 −𝜌 ) 𝛿 𝑥= 1−𝜌 1−𝜌 𝑀 𝛿 𝛿 𝑝𝑥 + (1 − 𝛿)𝜌 𝑝𝑦 (
𝑝𝑦 −𝜌 ) 1−𝛿 𝑦= 1−𝜌 1−𝜌 𝑀 𝛿 𝛿 𝑝𝑥 + (1 − 𝛿)𝜌 𝑝𝑦 (
In the case of the symbolic presentation, it is easy to forget about the question of the realism of the results, even for a simple maximization problem, especially where the reality of the behavior of this type of output function is not of interest to teachers. Primary and intermediate students usually have to calculate the equilibrium point. Most of the time is spent on laborious calculations. The advanced microeconomics now resembles a formal mathematics. Students determine the properties of the result function symbolically: homogeneity, concavity, etc. without regard for the reality of the results. Presentation of the result as a 3D visualization of the output function (see Plot 3) is a cause for concern over the emergence of new facts, not taken into account in symbolic analysis, which is the free ride problem mentioned above. Plot 3 shows the demand function x = f(px,py), assuming the following values of the parameters ρ = 0.1, δ = 0.1 and M = 100. This raises doubts and questions: Can the demand grow to infinity? Can it reach zero point? What will be the demand for good x at price p(x)=1000? How much will we spend then on this good? Why does the demand for good y seem to be insensitive to price changes? What happens when we change the parameters of this function? And so on. Plot 3: Demand functions of good x = f(px,py) and y = f(px,py) for ρ = 0.1, δ = 0.1, M = 100
100 50 10 5 1 y = g(px,py)
x = f(px,py)
100 80 60 40 20
20 18 16 14 12 10 8 6 py - price of y 4 2
2
4
6
8
18 20 14 16 10 12 px - price of x
800 700 600 500 400 300 200 100
20 18 16 14 12 10 8 6 py - price of y 4 2
200 100 50 10 5
18 20 14 16 10 12 8 6 px - price of x 2 4
Source: Own plot in Maxima, own Maxima code in Anex 3*
12
The above plot reveals the second feature of visualization, which is over-specificity. The 3D visualization of the function requires the reduction of information. CAS software supports the creation of many visual aids including animations, which help in better understanding of the behavior of the generated output functions. With the capabilities of CAS programs, students should experiment with the theoretical models as in a laboratory. They should understand by visualizing its behavior and strive to find its mechanics and instabilities, and on the basis of these findings assess the level of realism of these models. This is the realization of the slogan by Mäki (2005) “Models are experiments, experiments are models”. In contrast to econometric modeling or experimental research, in the theoretical modeling there is no criterion of realism, but at least we can try to ensure that models are a surrogate of reality, not a substitute (Mäki, 2005). Experimenting with theoretical models using visualization implies the acceptance of the rather naive but interesting cognitive attitude: let us take the very literal models presented in textbooks, as an engineer considers the mathematical model of the designed construction. By experimenting with these models let us learn on their mechanics and define the realism of their behavior. In the absence of objective criteria of realism, the minimalist purely subjective criterion can be accepted. And this is to answer a question, whether I like or not the model as a metaphor (McCloskey, 1998) for the economic reality.
2. Availability of CAS software in teaching economics
In the late twentieth and early twenty-first century, one of the main barriers in introducing CAS in education, next to institutional resistance against the change, was the cost of purchasing the software (Marshall, Buteau, Jarvis & Lavicza, 2012). The price of commercial software even for the educational version could be a significant burden on the budgets of both universities and also of individual users. The books and teaching materials using CAS were systematically accompanied only with the demo version of the software with significantly reduced functionality. The use of open source software as an alternative was very difficult due to the hostile work environment and lack of support for new inexperienced users. In the last few years there has been renewed interest in computer algebra software. This is a result of the emergence of mobile solutions and the development of open-source programs. Mobile versions of CAS can turn smartphones and tablets into powerful computational units. The theoretical performance of the supercomputer in the 1980s , the Cray-1, was 80 million
13
FLOPS (floating-point operations per second) 1 , which is several times less than the conventional computing power of ARM processors used in smartphones today2. Open Source programs are becoming more user-friendly and are becoming a viable alternative to commercial solutions. This development has forced producers of the dependent software to apply a more flexible pricing policy in relation to educational solutions, including free Mathematica software made available on the Raspberry Pi computer platform (Kastrenakes, 2013). Another solution is to place the limited functionality server version of this software on the web. Even when the availability of CAS is significantly higher due to the lower price of software, mobility, and network effects, still the specificity of using CAS entails a number of technical, psychological, and social problems, which limit the availability of these programs. The main barriers to the widespread use of CAS in teaching are: i) the fear of new users from having to write codes and scripts, ii) software incompatibility of mobile and Internet environment, iii) inefficient distribution channels and lack of social mechanisms for sharing resources. The later part of the study will present how to deal with the problems related to the Open Source Maxima software specifically, but these methods are universal for the whole class of CAS programs.
Fear of new users from having to encode in Maxima
In line with the development of CAS software, developers have focused on creating a user-friendly work environment. This was achieved with a graphical user interface, which is a link between the program and the user. Therefore, the development of the program itself is independent on the development of the graphical interface. Depending on the user’s preferences, a variety of graphic interfaces can be used. The program can also be run in Emacs or TeXmacs and experienced users can work in command line mode. The most developed graphical interface of the wxMaxima program allows for: i) using pre-defined codes accessed from the menu, ii) creating and editing the code, iii) creating and editing workbooks linking codes with their text description and their export to HTML and LaTeX. The easiest way to work with Maxima software is to use the graphical user interface menu wxMaxima. Clicking on a graphical or mathematical function results in the appearance
1 2
http://www.cisl.ucar.edu/computers/gallery/cray/cray1.jsp http://www.roylongbottom.org.uk/linpack%20results.htm#anchorAndroid
14
of a new window where the mathematical formulas or data are to be introduced. The batch code (% i ..) and the result (% of ..) appear in the command window in individual cells.
Plot 4: The use of the GUI menu of wxMaxima
Source: Screen from GUI wxMaxima
This mode of operation in which the buttons declare the mathematical operations and in subsequent steps the desired result is achieved is transferred from the work-style of scientific calculators. It is desirable as a facet of support in finding individual solutions to mathematical problems. Due to the nature of economic issues it is inefficient. Analysis of the economic model behavior consists of several steps. Errors made at the beginning will result in the whole procedure being repeated again. Therefore, despite the work with CAS being significantly facilitated with the graphical interface, users-economists should be aware that they need to write simple programs, what can be a significant psychological barrier for people who have never had to deal with encoding (Bosch, D'Mello & Mills, 2013). When the learning of programming is introduced to microeconomics, students who are already on the first lecture must be convinced about the significant added value of the new software. Otherwise there is a problem of hyperbolic discounting. From the students’ perspective, a prize, which is the CAS’ application for the analysis of the economic problems, 15
is not very significant, if the effect will be very time-delayed. This is a problem that is commonly present in teaching and especially in the case of language learning, where the prize is very delayed in time (Soman et al., 2005). Learning coding can be compared to learning a foreign language, and thus the use of existing linguistic tools (McEnery & Xiao, 2011) may help to reduce the problem. Maxima is a very extensive tool, but for the economic problems only a fraction of the potential of this program and only a fraction of the available commands are being used. Learning coding should be optimized by extracting statistically the commands used most often in economic applications. For this purpose text mining tools can be used. All lecturers creating their own codes have data in the text form, which can be converted into a source-code corpus. On this basis the frequency of commands can be explored. Meyer, Hornik & Feinerer (2008) give the R CRAN code to run the analysis of a corpus. For the purpose of optimizing learning Maxima for applied microeconomics, the frequency of commands in 327 files supporting the course was analyzed. One file is the analysis of one microeconomic model containing a set of about 10 examples of the analysis of the model. Plot 5 proves that only 40 commands are repeated more than once in the single file. Plot 5: Frequency of occurrence of command per file
Source: Own analysis
Table 1 summarizes the ten most common Maxima commands in economics. For example, the command kill(all) appears in all files with an average frequency of more than 10 16
times per file. This command clears the program memory, which guarantees that the result of the new fragment of code will be fully interpretable. Based on these results it can be noted what mathematical operations are replaced by CAS. These are: i) solving linear and nonlinear equations with solve(), ii) differentiating of functions with diff() and calculation of integrals with integrate(). Very frequent usage of graphics commands such as draw2d() or draw3d() confirms the extensive use of graphical analysis.
Table 1: The most frequent Maxima commands in solving microeconomic problems command
Frequency of
Description
commend per file kill(all)
10.14
erasing program memory
solve()
8.9
solving of systems of equations
rhs()
7.8
extracting the right-hand side of the equation from partial results
draw2d() or
6.9
draw3d(),
the creation of 2D and 3D charts with options explicit, color,…
load()
6.2
loading additional packages
diff()
6.8
differentiation
assume()
6.0
declaration of variable type
print()
4.1
printing the result on the screen
float()
5.0
showing the result in the alphanumeric form
integrate()
2.2
integration
The frequency of a particular Maxim commands in solving microeconomic problems can also be visualized with a map of words. Plot 6 shows the 40 most common words in advanced microeconomics codes. Such representation of programming language has a positive impact on the imagination of students starting coding and weakens their concerns about the complexity of the code.
17
Plot 6: Map of words of Maxima programing language for advanced microeconomics
Source: Own analysis w R with packages tm (Feinerer & Hornik, 2014) and wordcloud (Fellows, 2014)3
Learning coding for microeconomics requires certain simplifications in relation to the courses strictly aimed at learning the software. The first step is to reduce the amount of commands. The second is to simplify the syntax of the language so that the code is as close as possible to the analyzed structure of the economic problem. Maxima syntax allows users to easily map the structure of the economic problem in the structure of the code along with the usual computational steps. The paradox problem of sample codes included in textbooks for learning Maxima is their programming excellence. They are usually created by advanced programmers whose education imposes a certain way of thinking about the code – its optimization. Maxima is a language based on the lists and allows you to create functions. Advanced programmers use these properties to build programmatically optimized code, which is not readable and not understandable for outsiders. The code in educational applications should be correct, but should above all be understandable for users without programming experience. The use of the lists and defining functions should be only in cases when they save time and where it is not necessary to understand the economic problem. Table 2 compares code of the same problem: a) textbook-like codes, b) code mapping the economic structure of the problem of monopolist operating on two markets. Textbook Ingo Feinerer and Kurt Hornik (2014). tm: Text Mining Package. R package version 0.6. http://CRAN.Rproject.org/package=tm Ian Fellows (2014). wordcloud: Word Clouds. R package version 2.5. http://CRAN.R-project.org/package=wordcloud 3
18
code is optimized in terms of programming, but without an additional description to the GUI of Maxima it will be difficult to read for the user. Creating a function with the statement (:=) is too restrictive in relation to assigning a value to a variable or expression (:). It does not allow for functioning of the parameters or requires very extensive ways of declaring a function with inclusion as arguments not only variables but also all function parameters. This is a very undesirable characteristic for the way to achieve a result in the functional form, i.e. to fulfill the second postulate by Klein.
Table 2: Comparison of the optimized code and teaching code Programmatically optimal code
Didactically optimal code /* monopolist operating on two markets */
y: [y[1], y[2]];
kill(all)$ load(draw)$
p(y):= [1000-y[1], 1000-y[2]];
/* demand functions - you can change parameters*/
TC(y):=200+(y[1]- y[2])^2;
p_1: 1000 - q_1; p_2: 1000 - q_2;
R(y):=''(p(y).y-TC(y));
/* revenue function */
float(solve([diff(R(y)-
R: p_1*q_1 + p_2*q_2$
TC(y),y[1]),''diff(R(y)-
/* total cost function - you can change parameters */
TC(y),y[2])],[y[1], y[2]]));
TC: 20+ q_1^2 -2*q_1*q_2+q_2^2$ /* profit function */ profit: R - TC$ /* graph*/ draw3d(explicit(profit,q_1,1,600,q_2,1,600)); /* maximization */ eq1: diff(profit,q_1,1)=0$ eq2: diff(profit,q_2,1)=0$ /* results*/ solve([eq1,eq2],[q_1,q_2]);
Comments in the code should include guidance on both the ability to modify the code as well as the economic problem. The code should be as short as possible and therefore should give a maximum one algebraic result and one associated graphic score. Thanks to this, students, already during the first lecture, can learn both the behavior of economic models and familiarize themselves with the software by changing function parameters. If this code will consist of clearly separated parts performing the calculation steps of the economic problem, then students will be able to create their own codes as simple as stacking Lego blocks by simply copying them together and editing. 19
Mismatch of CAS software and the mobile environment and the Internet Fear of coding can be increased by the technical problems, which are particularly troublesome when using software on mobile devices. Because of the history of CAS development, its mobile versions were not adapted to the requirements of this new environment. First of all, there is no graphical interface that allows for the editing of codes and performing calculations using the menu. The user is forced to operate in a mode similar to the Command Line, which limits the efficient use of available codes. The result is obtained through sequentially entered commands. With the mobile version Maxima on Android, the smartphone gains a functionality similar to the advanced scientific calculators, but it does not have the full functionality of CAS software installed on a PC. Even if it seems a fringe issue, the ordering of codes and ease of use are key issues in the popularization of CAS. Commercial software developers have already noticed this problem and they seek to integrate the available solutions, so that there is no difference in the way we work in different environments. An example of this type of integration is Wolfram Alpha. This system is based on the Mathematica program and it operates as a web site. In the case of open source data, solutions of this type of integration are too costly, but it does not mean that programs like Maxima are losing the battle. It is enough to simply apply a hybrid way of working with the native program such as Maxima on Android and mobile web browser. Codes available on the website should be placed in an editable text area. Web Browser allows for editing the text area and is a substitute for the program editor. Thanks to this simple treatment of codes, the method is reduced to three steps: i) editing the code in the browser, ii) copying the code into the program editor, and iii) running the code in a program (Plot 7). The use of the browser as an editor of the code for the native program is part of a general trend of the growing importance of hybrid solutions in a mobile environment (Charland & Leroux, 2011).
20
Plot 7: Three easy steps to run Maxima on Android – when codes are ready to use
Source: Own screens
Available on the Internet, the HTML WYSIWYG editor tools allow users to easily place the code in an editable text area. If this option is not available, user can also paste Maxima code between HTML tags, and then paste the entire code on the web:
Maxima Code
Codes in an editable text area with a description of the economic model can be a substitute for a workbook. With this, the diffused sources like codes, examples of modeling, economic theory etc. can be integrated and provide a basis for learning using mobile devices in m-learning. Students using the codes posted on the website of the course can examine the properties of the analyzed economic models during the lecture. An equally important problem of the use of codes posted online is the mix of formats, and the resulting execution with presentation. Most of the examples available on-line are not ready to use, as they are the copy of the contents of the Command Window. They include tags and mixed inputs and outputs. Sometimes sample codes require the addition of missing elements or the loading of additional packages. Codes of this type are published mainly on Internet forums, but are also included in textbooks and scripts available on the web. This edition, both on PC and mobile devices, is very time consuming. Before executing a new code, it is desirable to add a command line kill(all) to clean the memory. Otherwise software may use values that have been calculated or declared earlier. In order to use the graphical 21
functions such as draw2d() or draw3d() a user must load an additional graphics package with load(draw). Even if ready-to-use codes are included as additional materials, it is usually in the form of a workbook that require users to run the reader or graphic interface which are not available in mobile devices. So, all necessary operations such as copying, pasting, editing, and running this code on the mobile device is virtually impossible due to editing problems. The problems presented above mean that ready to use codes available online are rare and this does not concern only open source software. There have been few years when producers of commercial software have integrated both development resources and sample codes online. Open source solutions can be the real alternative to commercial solutions if the availability of codes written by the community around a given software increases. This can be achieved by keeping the “good practice of web site code publication”. Following the above examples, this can be defined as: i) autonomous code - can be made independently of the previous history of operations in the program, ii) coherent code - should contain all the necessary components to get the result, iii) editable code - without the division into smaller pieces code should be in the text area, iv) minimalistic code - should carry a maximum of one algebraic and one graphic result.
Lack of social mechanisms in creating codes
Studies on the spread of software underline the social aspect of this phenomenon (Bonaccorsi & Rossi, 2003). Building the teachers’ environment centred around a project to share ready to use codes in the Internet does not guarantee success. If CAS is used on classes with a passive role of students only to enhance the attractiveness of courses, then the chances of the spread of this software are small. Students from passive recipients should become active creators of code and teaching content. This objective can be achieved by including the CAS as a component to pass the course – by the creation of a socially-useful work containing codes. How can a socially-useful work be defined? Most of all, the results of this work should be purposeful for those performing the work (Ariely, Kamenica & Prelec, 2008). In microeconomics courses, the implementation of CAS is not a backbreaking task. Microeconomics is the foundation of economics and is a very attractive or imperialist way of modeling human behavior in other social sciences (Lazear, 1999). In master theses in economics, the theoretical chapters usually refer to the theory of economics. Students preparing a written project based on CAS are expected to know and understand the behavior of theoretical models, which have the potential to become the core of theoretical chapters of 22
their thesis. But it is not only a part of any future dissertation – written assignments are to be didactic, so that it can help other course participants. In this way, mostly the students become “infected” with CAS, and convinced that CAS is a useful tool for learning other subjects. An example would be to use Maxima to quickly create the phase diagrams used in advanced macroeconomics courses. As shown in the example code below, only one command can create a phase diagram for the Ramsey-Cass-Koopmans growth model (Romer, 2011). It is a piece of code used by students as a test of the accuracy of the calculated results in the tasks on the theory of growth. The result interface shown in Plotdf() allows for changing the parameters of the model without coding and helps in learning the mechanics of this model without tedious calculations.
kill(all); plotdf(['(k^(alfa)-c-(delta+n)*k),'(c/teta*(alfa*k^(alfa-1)-delta-ro))], [k,c],[k,0,4], [c,0,2], [parameters,"alfa=0.5,delta=0.2,n=0.01,teta=0.2,ro=0.2"],[sliders,"alfa=0:1,delta=0:1,n=0 :0.1,teta=0:1,ro=0:1"], [tstep,1],[nsteps,300],[direction, forward]); Plot 8: GUI of Plotdf() function – phase diagram
Source: Own screens
To strengthen the involvement of students in the creation of socially useful work containing Maxima codes an additional incentive in the form of publishing their works has been introduced. These can be published in two ways: 1) closed - all works are posted on an e-learning platform and available for other participants, 2) open – the best codes and papers are published on-line with the option of publishing as a working paper. Publications in the 23
form of an open resource motivate students to work as it is judged by others, improves the understanding of issues presented in lectures, and finally is a part of the student’s curriculum (Cohen & Spencer, 1993; Lee, Courtney & Balassi, 2010). There is also a significant increase in publicly available codes so that it increases the availability of the program, and this is part of the idea of sharing resources in the context of open science.
3. Use of Maxima in the analysis of behavior of Leontief Input-Output model
The first period of learning economics is usually the consolidation of theory by the repetition of tedious calculations. The Leontief (1935) Input-Output (I-O) model is one of the most striking examples of the inadequacy of the teaching results obtained in relation to the effort of effort of pen-and-paper calculations. It is interesting that despite its history and application capabilities, the model is being eliminated from the micro and macroeconomics courses and is a prelude to the learning of matrix operations during the course of linear algebra and econometrics. In the simplest version of the I-O model, the external demand (d1, ..., dn) for goods (x1, ..., xn) is to be satisfied in a given region or country by the production in n sectors of the economy. Sectors in the production process also consume these goods. In order to produce a unit of output xi, the i-th sector of the economy consumes aij units of the production of the j-th good. An example of a typical task of the I-O model is given below:
Suppose that the economy consists of three sectors: manufacturing, energy, and coal mines. The diagram below shows the intermodal flows and external demand reported by consumers (d1, d2, d3) for the production of: steel (x1), electricity (x2), and coal (x3). On the basis of input-output graph, determine how much the production of x1, x2, x3 should be, to meet the demand (d1, d2, d3) at a given technology defined by the coefficients aij of production technology – c.f. the arrows shown on the graph.
24
Plot 9: Graph of flows in example Input-Output model
The solution of this task is reduced to the creation of the equation in the form of a matrix on the basis of the scheme:
AX D X a11 a12 a a22 21 a31 a32
a13 x1 d1 x1 a23 x2 d 2 x2 a32 x3 d 3 x3
where the elements aij of the matrix A are the technology coefficients obtained from the analysis of the input-output graph, x is the production, and di the demand for these products. After applying the transformation matrix we obtain a solution as follows:
AX D X D X AX D ( I A) X ( I A) 1 D X The solution to this task with the use of pen and paper is about 15 - 20 minutes of work for a solid student who has passed a course in linear algebra and is able to quickly solve the system of three linear equations. With use of Maxima one is able to write a simple code, where the main difficulty is the insertion of the A matrix. kill(all)$ A: matrix([0.05, 0.1, 0.3], [0.3, 0.05,0.2], [0.5,0.5,0.15]); d: matrix([150], [200], [250]); 25
I: ident (3); x: (invert (I-A)).d; The simple application of Maxima indeed reduces the computation time, but it is still not a significant improvement in the quality of teaching economics. CAS gives the result quicker which due to the typical occurrence for this sort of simplification is economically noninterpretable.
The obtained result adds only little value, because it does not show the mechanics and behavior of this model. It also does not give the information on the quality of reflecting the reality of economic processes by this model. It is not surprising that this model is not attractive in teaching. What should be the effective use of CAS in this task? First of all, the calculations are not to be objective, but only a tool of analysis. Secondly, the real and important economic problem should be added, which can be analyzed with this model. The example below shows the blackout problem that can affect many world economies:
Over a dozen of years, the economy of X will face an energy crisis. On the one hand, the supply of energy is limited by the lack of investment in the expansion and modernization of old power stations. On the other hand, the economic growth increases the demand for electricity. The solution is to change technology and reduce the energy consumption. Based on the Leontief I-O model, specify how the economy can do without the construction of new power plants, only by decreasing the energy intensity of the economy.
In the modified task there is an economic problem, in addition to a mathematic problem. The solution of this problem can be found by students in a few steps presented below. Students are furnished with an example of Maxima code for I-O model. Each step can be a partial task, and students then have the opportunity to create their model of the economy.
Step 1: Students know the I-O model and are able to change the parameters of the model in the Maxima code. Based on empirical observations, they determine the approximate value 26
of demand and intensity coefficients aij. The structure of the model and initial values may be the result of discussions with students and ad hoc assumptions that have been adopted. Students can analyze their individual models of the economy or modify them to-date4. Step 2: The lecturer and students enter data into codes and check the formal model. The obtained result still does not reflect the real economic processes, but i) is the result of inference by students on the real processes, and ii) provides a basis for modifying the model and its further analysis on the reality of its behavior. It is also an excuse to assess the very real questions about the economy, e.g. how big is the possible increase in the production of electricity with the use of the current state of energy? Step 3: Introduction of functional forms. The problem presented above is indeed the analysis of the relationship between the increase in external demand, changes in the energy intensity of the economy, and the supply of electricity. Following the second postulate by Klein, the energy intensity and the demand for electricity can be variables, not points. For example, it can be assumed that the energy intensity of all the products will vary by the same rate. Let k be the rate of decline in energy intensity for the production of all products. The technology coefficients aij will fall proportionally [a21(1-k), a22(1-k), a23(1-k)]. The external demand for production will grow proportionally. Let t be the rate of growth in demand for all products [d1 (1 + t), d2 (1 + t), d3 (1 + t)]. This is one possible method of analysis. One can treat any of the parameters as a variable which can be found in the A matrix and in the demand from the d vector. In the pen-and-paper solution, the variation of even one parameter is associated with a very large amount of work. Using the CAS software, switching from parameters to functions of parameters is to introduce the minimal code modifications involving an exchange of numerical values for the parameters. In this way, one obtains the binding function of the supply of electricity to the parameters t and k, x2 = f (t, k). These changes are highlighted in the following code in bold. kill(all)$ A: matrix([0.05, 0.1, 0.3], [0.3* (1-k), 0.05* (1-k) , 0.2* (1-k)], [0.5,0.5,0.15]); d: matrix([150 *(1+t) ], [200*(1+t)], [250*(1+t)])$ I:ident (3)$ x: (invert (I-A)).d; x2:x[2,1];
4
For simplicity, the paper adopts the same values as before.
27
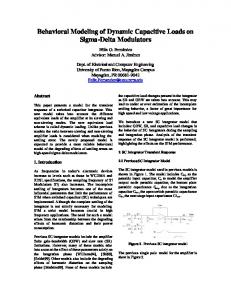
Step 4: Visualization. The formula for the function of the electricity supply x2 = f (t, k) depends on the rate of change of growth rates: of energy consumption k and the demand t. It is very complicated as it is non-linear due to both k and t. Using only manual calculations, its analysis is impossible to carry out. For CAS software, it is only a function of two variables, which can easily be analyzed graphically. The advantage of CAS is the ability to create 3D charts and map them onto a 2D surface. Modifying the code involves loading the graphics package and declaring the graphic function parameters5.
Plot 10: Three-dimensional surface of electricity production as a function of t and k
Source: Own graph in Maxima
Based on this graph (Plot 10), students should note that an analyzed model economy has little ability to reduce the production of energy by reducing energy intensity. The proportional reduction of energy consumption in the production of k goods by 30% will reduce the production of production to a level of about 450 units of electricity, assuming there is no increase in demand. In contrast, an increase in demand of 30% in the absence of improvement in energy intensity of the economy will increase the demand for electricity by over 700 units. With initial output being equal to 510 it is a highly unprofitable trade-off. In order not to rely solely on a very rough analysis, the mapping of 3D functions in the surface can be used. One can also specify the area of trade-off between the reduction of energy
5
The author encourages to run wxMaxima and execute the codes from the Annexes.
28
consumption and the increased demand, assuming that the supply of electricity has to be within the range specified by the capacity of the power plant, e.g..: it can be assumed that x2∈[510,550].
Plot 11: Trade-off between k and t for production x2∈[510,550]
Source: Own graph in Maxima
A more detailed result can be reached by creating graphs implicitly. In the analysis of the I-O models, this tool allows for the analysis of the simultaneous impact of the three parameters of energy consumption in production on the supply of electricity at a given increase in the demand on goods. The assumption of uniform changes in energy intensity is being repealed. One can calculate what should be the parameters a11,a22,a23, that production remains at the same level and there is a simultaneous increase in the demand by 10%. Plot 12 below shows graphically the dependence of energy consumption parameters satisfying the equation x2 = 510 = f(a11,a22,a23) and t =0.1.
29
Plot 12: Three-dimensional surface of a21, a22, a23 for which t=0.1 and x2 = 510
Source: Own graph in Maxima
The interpretation of the relation x2 = 510 = f(a11,a22,a23) and t =0.1 presented graphically on Plot 12 begins to be intriguing. Points located on the lower surface satisfy the equation in the form of a23 = - (6575*a22+6805*a21-3682)/12125. This result is not in doubt and is easily interpreted. This lower surface is also kind of limiting while existing in this economy. Points lying on this surface are a combination of parameters a21, a22, a23, for which it is possible to produce electricity at 510 units at a given increase of 10% in the demand. Below this surface there are combinations of coefficients of energy consumption, for which the production of energy can be less than 510 at a given external demand. By analyzing the slope of the surface it can be determined which of these parameters has the greatest impact on reducing the demand for electricity. On Plot 12 there is also the upper undulating surface. It is non-interpretable and is the result of limitations of CAS programs and the adoption of unacceptable values of a21, a22, a23. The appearance of this type of anomaly gives a pretext to reflection on the problem of the instability of economic models and the reliability of calculation methods. Step 5: Getting rid of units. In analyzing the results, students should feel uncomfortable handling physical entities. This should lead to the use of dimensionless values such as elasticity. Maxima allows for quick calculation of the elasticity of output growth due to changes in the parameters a11, a22, a23. Table 3 below shows the elasticity values of the initial parameters of the model. Figure 15 extends these results by the intervals of parameters a11, a22, a23.
30
Table 3: Elasticity values of energy production Measure
Value of
Assumptions
Electro-intensity of steel production elasticity of energy production Electro-intensity of energy production elasticity of energy production Electro-intensity of coal production elasticity of energy production
elasticity
t = 0, x2=510, a21:0.3
0.56
t = 0, x2=510, a22=0.4
1.2
t = 0, x2=510, a23=0.2;
0.52
Source: Own simulation
Plot 13: Elasticities of energy production as a function of electro-intensity E = (dx2/x2)*(da21/a21) E = (dx2/x2)*(da22/a22) E = (dx2/x2)*(da23/a23)
1.4
1.2
1
0.8
0.6
0.15
0.2
0.25
0.3
0.35
0.4
0.45
Source: Own graph in Maxima
By analyzing elasticity, students can identify the main problem associated with the production of electricity – such as the inefficient system of delivering the energy. Reducing the energy consumption in energy production means that, inter alia, the energy losses in transmission of 1% would result in a decrease in energy production by 1.2%. The higher the loss, the more important it is to reduce losses in power networks. These examples demonstrate how easy it is to expand the analysis of the model parameters only by modifying the ready-to-use Maxima code and supplementing it with 2D and 3D graphic elements. Students have the opportunity to learn the mechanics involved and the subjective assessment of the reality of its behavior. Comparing the initial output of the 31
model with the results obtained with CAS, it can be said that despite its initial simple assumptions, its behavior is far from simple interactions. This is consistent with the idea of the I-O model presented by Leontief (1928) as a “multiplicity of casual relationship”. What can be said about this model? It is an attractive approach due to its simplicity and potential ability to explain the economic, social, and technical phenomena. It has been used as a basis of students’ final projects dealing with the following issues: i) production of information on the Web, ii) the effect of CO2 emission restrictions on industrial production in developed European countries, iii) the effect of automation and computerization on the displacement of people in the service sector and education, amongst others. This is only the beginning of the discovery by students of the possible applications of this model. Moreover, as calculated by Leontief, this model has more uses beyond economics (Garfield, 1986).
Summary
This paper presents the experience of implementation of CAS software for applied courses in microeconomics. A key element of the quality change by the use of CAS software is to use it as proposed by Felix Klein postulates for the reform of mathematics education in the early twentieth century. The introduction of these postulates was of great potential for lecturers when creating tasks aimed at confronting the problems of formal mathematical models and real economic processes. Through the use of CAS, the economic model becomes the object of experiments. Instead of focusing on calculations, students can learn its mechanics through experiment. This allows them to discover its shortcomings and advantages, as well as justify the strengths of their criticism of the learned models. It is also the basis for a relationship between economics and mathematics in the teaching process, and thus also in the perception of the economy by the students. Instead of extreme attitudes: full compliance with mathematical formalism or the total negation of mathematics in economics, they can try to differentiate between a good and bad use of mathematics to model economic phenomena. Demarcation criterion is a subjective assessment of the reality of their behavior. This article also presents technical, educational, and social solutions so that it is possible to increase the availability of CAS software. These solutions focus on increasing the ease of obtaining and using codes in a mobile environment and online. It is shown how simple technical operations involving the publication of ready-to-use codes and the hybrid use of browser and mobile versions makes the open source solutions such as Maxima viable alternatives to commercial projects. Overcoming the fear of coding and creating a mechanism 32
for the creation of socially useful codes may contribute to the spread of the CAS program, not only as a supplement to the lectured subject, but also as a tool that can be constantly used by the students in their research work at the university and in future work. For the author, this article is a way to organize and evaluate the results of his own teaching experiment of using CAS in teaching microeconomics. At present, this is the prototype of the teaching product which has been tested in the past five years with good results. This is a beta version, which should be further examined and tested, but it is already mature enough to be made public and subject to the critical evaluation of others. Together with the publication of this article, the teaching materials and student's course covering advanced microeconomics are being distributed.
References Abrams, A., 2013, Topological Marvel: The Klein Bottle in Art http://www.darkroastedblend.com/2013/05/topological-marvel-klein-bottle-in-art.html Ariely, D., Kamenica, E., & Prelec, D. (2008). Man's search for meaning: The case of Legos. Journal of Economic Behavior & Organization, 67(3), 671-677. Becker W., Watts M., (eds.), 1999, Teaching economics to undergraduates: Alternatives to chalk and talk, Cheltenham, U.K.: Elgar Belsley, D. A. (1999). Mathematica as an environment for doing economics and econometrics. Computational Economics, 14(1-2), 69-87. Benedict, M. E., & Hoag, J. (2012). Factors influencing performance in economics: graphs and quantitative usage. International Handbook on Teaching and Learning Economics Bishop & M. A. Clements & C. Keitel & J. Kilpatrick & F. K. S. Leung (Eds.), Second International Handbook of Mathematics Education (Vol. 1, pp. 271-322). Dordrecht: Kluwer Academic Publishers. Bonaccorsi, A., & Rossi, C. (2003). Why open source software can succeed. Research policy, 32(7), 1243-1258. Bosch, N., D’Mello, S., & Mills, C. (2013). What emotions do novices experience during their first computer programming learning session?. In Artificial Intelligence in Education (pp. 11-20). Springer Berlin Heidelberg. Boyd, D. W. (1998). On the use of symbolic computation in undergraduate microeconomics instruction. The Journal of Economic Education, 29(3), 227-246. Bussi, M. G. B., Taimina, D., & Isoda, M. (2010). Concrete models and dynamic instruments as early technology tools in classrooms at the dawn of ICMI: From Felix Klein to present applications in mathematics classrooms in different parts of the world. ZDM, 42(1), 19-31. Charland, A., & Leroux, B. (2011). Mobile application development: web vs. native. Communications of the ACM, 54(5), 49-53.
33
Chislenko E., Tschinkel, Y., 2007, Notices of the AMS, September 2007, pp 961–970 Cohen, A. J., & Spencer, J. (1993). Using writing across the curriculum in economics: Is taking the plunge worth it?. The Journal of Economic Education, 24(3), 219-230. Cuban, L., Kirkpatrick, H., & Peck, C. (2001). High access and low use of technologies in high school classrooms: Explaining an apparent paradox. American educational research journal, 38(4), 813-834. Douglas, M. (1986). How institutions think. Syracuse University Press. Ely, D. P. (1999). Conditions That Facilitate the Implementation of Educational Technology Innovations. Educational technology, 39(6), 23-27. Feynman, R. (1997). Surely you're joking, Mr. Feynman!. W. W. Norton & Company Garfield, E. (1986). Wassily Leontief: Pioneer of Input-Output Analysis. Essays of an Information Scientist, 9, 3-12. Gilbert, J. K. (2005). Visualization: A metacognitive skill in science and science education. In Visualization in science education (pp. 9-27). Springer Netherlands. Guin, D., Ruthven, K., & Trouche, L. (2006). The didactical challenge of symbolic calculators: turning a computational device into a mathematical instrument (Vol. 36). Springer Science & Business Media. Hamermesh D., 2002, Microeconomic Principles Teaching Tricks, The American Economic Review Vol. 92, No. 2, Papers and Proceedings of the One Hundred Fourteenth Annual Meeting of the American Economic Association (May, 2002), pp. 449-453 Hammock, M. R., & Mixon, J. W. (2013). Microeconomic Theory and Computation. Springer. http://ssrn.com/abstract=2357536 or http://dx.doi.org/10.2139/ssrn.2357536 Hennessy, S., Ruthven, K., & Brindley, S. (2005). Teacher perspectives on integrating ICT into subject teaching: commitment, constraints, caution, and change. Journal of curriculum studies, 37(2), 155-192. Hodgin, G. 1999. Using Mathematica as a Teaching Tool in the Undergraduate Economics Curriculum. Journal for Economic Educators. 3 (1) : 1-11. Huang, Cliff J., & Philip S. Crooke. Mathematics and Mathematica for Economists. 1997, Malden, Mass. And Oxford: Blackwell. Jankowski, M.. "Whatever Happened to Computer Algebra Systems in the Engineering Classroom?." Digital Signal Processing Workshop, 12th-Signal Processing Education Workshop, 4th. IEEE, 2006. Kaput, J. J. (1992). Technology and Mathematics Education. In D. A. Grouws (Ed.), Kastrenakes, J., 2013, Raspberry Pi now includes Mathematica and Wolfram Language for free. The Verge Klein, F. (1939a). Elementary mathematics from an advanced standpoint: Arithmetic, algebra, analysis (Vol. 1). Reprinted Dover, New York. Klein, F. (1939b). Elementary Mathematics from an Advanced Standpoint, Geometry (1908). Reprinted Dover, New York. Komlos, J. (2014). What every economics student needs to know and doesn't get in the usual principles text. ME Sharpe.
34
Lavicza, Z. (2007). Factors influencing the integration of Computer Algebra Systems into university-level mathematics education. International Journal for Technology in Mathematics Education, 14(3), 121. Lazear, E. P. (1999). Economic imperialism (No. w7300). National bureau of economic research. Lee, W., Courtney, R. H., & Balassi, S. J. (2010). Do online homework tools improve student results in principles of microeconomics courses?. The American Economic Review, 283-286. Leibenstein, H. (1976). Beyond economic man. Harvard university press. Leontief, W. W. (1935). Input-output economics. Oxford University Press. Levy, S. (2002). The man who cracked the code to everything. Wired, June. Leydold, J., & Petry, M. (2011). Introduction to maxima for economics. Institute for Statistics and Mathematics, WU Wien, 119, 163-58. Li J., Racine J., 2008, Maxima: An Open Source Computer Algebra System, Journal of Applied Econometrics, Vol. 23, No. 4 (Jun., 2008), pp. 515-523 Lockhart, P. (2009). A mathematician's lament. New York: Bellevue literary press. Mäki, U. (2005). Models are experiments, experiments are models. Journal of Economic Methodology, 12(2), 303-315. Maney, K. (2010). Trade-off: Why Some Things Catch On, and Others Don't. Broadway Business. Marshall, N., Buteau, C., Jarvis, D. H., & Lavicza, Z. (2012). Do mathematicians integrate computer algebra systems in university teaching? Comparing a literature review to an international survey study. Computers & Education, 58(1), 423-434. McCloskey, D. N. (1998). The rhetoric of economics. Univ of Wisconsin Press. McEnery, T., & Xiao, R. (2011). What corpora can offer in language teaching and learning. Handbook of research in second language teaching and learning. London: Routledge, 364-380. Meyer, D., Hornik, K., & Feinerer, I. (2008). Text mining infrastructure in R. Journal of Statistical Software, 25(5), 1-54. Mirowski, P. (2002). Machine dreams: Economics becomes a cyborg science. Cambridge University Press. Raju, C. K. (2004). Math wars and the epistemic divide in mathematics. epiSTEME-1, 94. Romer, D. (2011). Advanced macroeconomics. McGraw-Hill/Irwin. Ruthven, K., & Hennessy, S. (2002). A practitioner model of the use of computer-based tools and resources to support mathematics teaching and learning. Educational studies in mathematics, 49(1), 47-88. Schoenfeld, A. H. (2004). The math wars. Educational policy, 18(1), 253-286. Schramm, T. (1998). Computer algebra systems in engineering education. Global J. of Engng. Educ, 2(2), 187194. Schwabish, J. A. (2014). An Economist's Guide to Visualizing Data. The Journal of Economic Perspectives, 28(1), 209-233.Tobies, R. (2000) Why a Felix Klein Prize?, ECMI Newsletter 27, 23–24. Shimojima, A. (2001). The graphic-linguistic distinction. In Thinking with diagrams (pp. 5-27). Springer Netherlands.
35
Sierpinska, A., Bobos, G., & Knipping, C. (2008). Sources of students’ frustration in pre-university level, prerequisite mathematics courses. Instructional Science, 36(4), 289-320. Soman, D., Ainslie, G., Frederick, S., Li, X., Lynch, J., Moreau, P., ... & Zauberman, G. (2005). The psychology of intertemporal discounting: Why are distant events valued differently from proximal ones?. Marketing Letters, 16(3-4), 347-360. Steen, L. A. (1988). The science of patterns. Science, 240(29), 616. Stinespring, J. R. (2002). Mathematica for Microeconomics: learning by example. Gulf Professional Publishing. Tobies R., 2000, Why a Felix Klein Prize?, ECMI Newsletter 27 (2000), 23–24. Torretti R.,, (1978) Philosophy of Geometry from Riemann to Poincaré, D. Reidel Publishing Company, Dordrecht-Boston-London. Varian, H. R. (Ed.). (1996). Computational economics and finance: modeling and analysis with Mathematica (Vol. 2). Springer Science & Business Media. Vriend, N. J. (1999). Was Hayek an ace?. Queen Mary and Westfield College Working Paper, (403) Walbert, M. S., & Ostrosky, A. L. (1997). Using Mathcad to teach undergraduate mathematical economics. The Journal of Economic Education, 28(4), 304-315. Watts, M., & Becker, W. E. (2008). A little more than chalk and talk: Results from a third national survey of teaching methods in undergraduate economics courses. The Journal of Economic Education, 39(3), 273-286. Weintraub, E. R. (2002). How economics became a mathematical science. Duke University Press. Wong, N. Y. (2003). The influence of technology on the mathematics curriculum. In Second international handbook of mathematics education (pp. 271-321). Springer Netherlands.
36
For Online Publication The annexes contain codes for graphs and calculations contained in the article. Due to the objectives of the publication it contains much more commands for formatting charts than is needed in work with students. Anex 1 Solution and visualization of the system of equations: 0.3𝑥1 + 0.2𝑥2 = 0.8 { (1 + 𝜀)𝑥1 + 0.8𝑥2 = 0.3 as relationship x1 = f(ε) and x2 = f(ε) kill(all); load(draw); A: matrix([0.3, 0.2], [1+e, 0.8]); b: matrix([0.2], [0.3]); x: invert(A).b; x1:x[1,1]; x2:x[2,1]; draw2d( yrange = [-10,20], xlabel = "error", ylabel = "Solutions of system of equations; x1,x2", key = "x1", line_type = solid, line_width = 3, explicit(x1,e,-2,2), key = "x2", line_type = dots, line_width = 2, explicit(x2,e,-2,2)); Anex 2 The Klein bottle – modification of Mario Rodríguez Riotorto's codes http://riotorto.users.sourceforge.net/gnuplot/parametric/index.html#kleinbottle
37
kill(all); load(draw); x1:6*cos(u)*(1+sin(u)) + 4*(1-0.5*cos(u))*cos(u)*cos(v); x2:6*cos(u)*(1+sin(u)) - 4*(1-0.5*cos(u))*cos(v); y1:16*sin(u)+4*(1-0.5*cos(u))*sin(u)*cos(v); y2:16*sin(u); z1:4*(1-0.5*cos(u))*sin(v); x : (if u0,px>0,py>0,U>0,%delta>0,%delta>1,%rho>-1); declare (%rho, noninteger,%delta, noninteger); /* parameters of CES utility function */ %delta:0.3; %rho:0.5; 38
/* declaration of CES utility function */ U:(%delta*(x^(-%rho))+(1-%delta)*(y^(-%rho)))^(-1/%rho); /* MRS = px/py */ MU1:diff(U,x,1); MU2:diff(U,y,1); eq1: MU1/MU2 = px/py; solve([eq1],[x]); x:''rhs(%[3]); eq2:px*''x + py*y = M; solve([eq2],[y]); /* result */ y:''rhs(%[1])$ x:''x; M:100; /*Draw Demand functions of good x = f(px,py)*/ draw3d( xlabel = "px - price of x", ylabel = "py - price of y", zlabel = "x - demand f(px,py)", enhanced3d = true, palette = [gray10,gray90], contour = base,contour_levels = {1,5,10,50,100,200}, colorbox = false, explicit(''x,py,0.1,20,px,0.1,20))$ Anex 4 Codes for I-O model used in paper Initial model: kill(all)$ A: matrix([0.05, 0.1, 0.3], [0.3, 0.05,0.2], [0.5,0.5,0.15]); d: matrix([150], [200], [250]); I: ident (3); x: (invert (I-A)).d; The function of the supply of electricity to the parameters t and k, x2 = f (t, k). Changes to initial model are in bold. kill(all)$ 39
A: matrix([0.05, 0.1, 0.3], [0.3* (1-k), 0.05* (1-k) , 0.2* (1-k)], [0.5,0.5,0.15]); d: matrix([150 *(1+t) ], [200*(1+t)], [250*(1+t)])$ I:ident (3)$ x: (invert (I-A)).d; x2:x[2,1]; Code for Plot 10: Three-dimensional surface of electricity production as a function of t and k kill(all)$ load(draw)$ A: matrix([0.05, 0.1, 0.3], [0.3* (1-k), 0.05* (1-k) , 0.2* (1-k)], [0.5,0.5,0.15]); d: matrix([150 *(1+t) ], [200*(1+t)], [250*(1+t)])$ I:ident (3)$ x: (invert (I-A)).d; x2:x[2,1]; draw3d( xrange= [0,0.3], yrange= [0,0.3], contour_levels = 8, contour = base, key = "Production of Electricity", xlabel = " rate of decrease in energy intensity (k)", ylabel = " growth rate of demand (t)", explicit(x2,k,0,0.3,t,0,0.3))$ Code for Plot 11: Trade-off between k and t for production x2∈[510,550] kill(all)$ load(draw)$ A: matrix([0.05, 0.1, 0.3], [0.3* (1-k), 0.05* (1-k) , 0.2* (1-k)], [0.5,0.5,0.15]); d: matrix([150 *(1+t) ], [200*(1+t)], [250*(1+t)])$ I:ident (3)$ x: (invert (I-A)).d; x2:x[2,1]; draw3d( xrange= [0,0.3], yrange= [0,0.4], contour_levels = {510,550}, contour = map, key = "Production of Electricity", xlabel = " rate of decrease in energy intensity(k) ", ylabel = " growth rate of demand (t)", explicit(x2,k,0,0.3,t,0,0.4))$ Code for Plot 12: Three-dimensional surface of a21, a22, a23 for which t=0.1 and x2 = 510 kill(all)$ load(draw)$ A: matrix([0.05, 0.1, 0.3], [a21, a22 , a23], [0.5,0.5,0.15])$ t:0.1; d: matrix([150 *(1+t) ], [200*(1+t)], [250*(1+t)])$ I:ident (3)$ x: (invert (I-A)).d$ x2:x[2,1]$ eq1:x2=500; draw3d( enhanced3d = true, palette = gray, zrange= [0,1],grid = true, xlabel = "a21", ylabel = "a22", zlabel = "a23", key = " 510 = x2 = f(a11,a22,a23) and t = 0.1", colorbox = false, surface_hide = true, implicit(eq1,a21,0.01,1,a22,0.01,1,a23,0.01,1)); 40
solve(eq1,a21); Code for Table 3 and Plot 12: Elasticity values of energy production, Elasticities of energy production as a function of electro-intensity kill(all)$ load(draw)$ t:0$ A: matrix([0.05, 0.1, 0.3], [a21, 0.4, 0.2], [0.5,0.5,0.15])$ d: matrix([150 *(1+t) ], [200*(1+t)], [250*(1+t)])$ I:ident (3)$ x: (invert (I-A)).d$ x2:x[2,1]$ el_a21: diff(''x2,a21,1)*a21/x2$ A: matrix([0.05, 0.1, 0.3], [0.3, a22, 0.2], [0.5,0.5,0.15])$ d: matrix([150 *(1+t) ], [200*(1+t)], [250*(1+t)])$ I:ident (3)$ x: (invert (I-A)).d$ x2:x[2,1]$ el_a22: diff(''x2,a22,1)*a22/x2$ A: matrix([0.05, 0.1, 0.3], [0.3, 0.4, a23], [0.5,0.5,0.15])$ d: matrix([150 *(1+t) ], [200*(1+t)], [250*(1+t)])$ I:ident (3)$ x: (invert (I-A)).d$ x2:x[2,1]$ el_a23: diff(''x2,a23,1)*a23/x2$ draw2d( key = " E = (dx2/x2)*(da21/a21) ", line_width = 3, line_type = dots, explicit(el_a21,a21,0.25,0.35), key = " E = (dx2/x2)*(da22/a22) ", line_width = 3, line_type = solid, explicit(el_a22,a22,0.35,0.45), key = " E = (dx2/x2)*(da23/a23) ", line_width = 2, line_type = dots, explicit(el_a23,a23,0.15,0.25))$ a21:0.3;a22:0.4;a23:0.2; print("Elasticity (dx2/da21)*(a21/x2)" = ''el_a21); print("Elasticity (dx2/da22)*(a22/x2)" = ''el_a22); print("Elasticity (dx2/da22)*(a22/x2)" = ''el_a23);
41