computer-based technologies can be integrated in the classroom to scaffold and amplify ... effects different instructional materials, textual or visual, may have on learners' .... movement of industries and jobs from the United States to Mexico.
IADIS International Conference Cognition and Exploratory Learning in Digital Age (CELDA 2004)
THINKING ABOUT COMPLEX PROBLEMS WITH MODELING SOFTWARE: THE ROLE OF COGNITIVE STYLE AND VISUAL AND TEXTUAL REPRESENTATIONS Charoula Angeli and Nicos Valanides Department of Education University of Cyprus
ABSTRACT Sixty-five undergraduates, classified into Field-Dependent (FD), Field-Mixed (FM), and Field-Independent (FI) learners, were randomly assigned to two groups, Text-Only (T-O) and Text-and-Visual (T-V). The T-O group received a textual description of a computer model, whereas the T-V group received the same description but in both textual and visual format. Participants were asked to run the model using Model-It to solve a complex problem about immigration dynamics. A 3x2 ANOVA indicated that the T-V group outperformed the T-O group, that performance was significantly related to field-dependence/independence, and that there was a significant interaction effect. Specifically, FieldIndependent learners in the Text-and-Visual group outperformed Field-Dependent and Field-Mixed learners in both groups, and Field-Independent learners in the Text-Only group. KEYWORDS
Complex task, problem solving, modeling software, field dependence, field independence, cognitive style
1. INTRODUCTION Many educators argue (e.g., Richmond, 2001; Penner, 2000/2001; Bransford, Brown, & Cocking, 2001; Paul, 1995; Bruer, 1993) that the way students are taught in schools is outdated, and, thus, they are not well equipped to think and communicate effectively. Nonetheless, learning how to think, communicate, and problem-solve can be taught and greatly depends on classroom practices (Bruer, 1993). New interactive and computer-based technologies can be integrated in the classroom to scaffold and amplify students’ thinking and learning (Bransford, Brown, & Cocking, 2001). Several researchers (e.g., Penner, 2000/2001; Jonassen & Reeves, 1996; Glass & Mackey, 1988; Haken, 1981) assert that dynamic systems modeling tools are perhaps the most intellectually demanding technologies that “enhance the cognitive powers of human beings during thinking, problem solving, and learning” (Jonassen & Reeves, 1996, p. 693). In view of recognizing the importance of understanding who can perform better in an instructional environment where computer-modeling tools assist the learning process, it may prove useful to study the effects different instructional materials, textual or visual, may have on learners’ performance during problem solving with these tools. Learning from either verbal or visual information is, however, directly associated with representational preferences and cognitive controls or cognitive styles, which constitute patterns of thinking that control the ways individuals process and reason about information. Evidently, textual and visual representations have different uses for different purposes and have implications for the ways individuals process information and construct mental representations. Currently, there is scarce research evidence to inform researchers and practitioners about the extent to which learners’ cognitive style1 (or control) affects their achievement in learning environments where dynamic systems modeling tools are infused or integrated to assist the instructional/learning process.
1
The words cognitive style and cognitive control are used synonymously.
289
ISBN: 972-98947-7-9 © 2004 IADIS
Therefore, the purpose of the present study was to investigate whether different instructional materials, using only textual, or textual and visual representations, differentially affect learners’ achievement during problem solving with modeling software depending on their cognitive control (or style), such as FD/I.
2. THEORETICAL FRAMEWORK A well-documented and popular source of cognitive difference is the construct of fielddependence/independence (FD/I) (Dillon & Gabbard, 1998). FD/I is generally considered to represent “differences in learners’ information processing mode along a bipolar plane- at either end of a continuum” (Morgan, 1997, p. 61). “The person with a more field independent way of perceiving tends to experience his surroundings analytically, with objects experienced as discrete from their backgrounds. The person with a more field dependent way of perceiving tends to experience his surroundings in a relatively global fashion, passively conforming to the influence of the prevailing field or context” (Witkin et al., 1974, p.35). Thus, comprehension of information, due to the effects of the encompassing field, or instructional context, related to the complexity of the problem-solving task as well as the instructional materials (Morgan, 1997; Reiff, 1996) is associated with FD/I. This construct describes learners along a continuum such that individuals at one end are considered to be Field-Independent (FI), and individuals at the other end Field-Dependent (FD). Individuals who fall in the middle of the continuum are characterized as Field-Mixed (FM) (Liu & Reed, 1994). In this context, a continuum means that there are persons with variations of traits at different points between the two extremes, on each side of a central point. The key difference between FD and FI learners is visual perceptiveness. In general, individuals who are more field independent are able to delineate objects or details that have surroundings that might obscure them from view. For example, when a FD learner is asked to identify a simple geometric figure that is embedded in a complex figure will take longer to identify the simple figure than a learner who is FI, or may not be able to do it at all. FD learners are thus not visually perceptive and have more difficulty in abstracting relevant information from visual (or even textual) instructional materials supporting more difficult learning tasks (Liu & Reed, 1994; Lyons-Lawrence, 1994; Canelos, Taylor, & Gates, 1980). Obviously, FD learners are more influenced by the prevailing field, and, thus, often fail to isolate target information, because other information tends to camouflage what they are looking for (Jonassen & Grabowski, 1993). The ramifications of field type on the performance of learners interacting with computers to accomplish a task are not well established, and the results of research studies are still inconclusive (Dillon & Gallard, 1998; Davis, 1991) and, at times, contradictory. No systematic efforts have been undertaken to examine the extent to which dynamic modeling tools are better fitted to one type of learner or another within an instructional context where instructional materials assist the problem-solving process. Undoubtedly, the consideration of individual differences in human-computer interaction studies can provide guidance on how computer tools can best be targeted at specific types of learners in the classroom-learning environment.
3. METHOD 3.1 Participants Research participants were recruited from the 2001-2002-freshman class of teacher education students at a university. Specifically, of the 165 first-year teacher education students, who at the time were enrolled in four different sections of an undergraduate-level technology course, 157 of them volunteered to participate in the study. This task was one of three possible assignments from which students could choose to fulfill the course requirements. Initially, prospective participants were asked whether they had any prior knowledge relating to either dynamic systems modeling software or immigration policies. None of the students reported any familiarity with immigration policies. However, two students, a male and a female, who stated that they had some prior knowledge with modeling software, were not allowed to participate in the study. Before forming the final sample of the study, prospective participants were also administered the Hidden Figures Test (HFT) (French,
290
IADIS International Conference Cognition and Exploratory Learning in Digital Age (CELDA 2004)
Ekstrom, & Price, 1963). Based on their HFT scores, most of them were classified as either FD (55) or FM (79), and only 23 of them as FI learners. Thus, we included all 23 students, who were identified as FI, and we randomly selected 24 FM and 24 FD students in an attempt to maximize the final sample of the study without any serious threats to the validity of the results. Of the 71 students who participated in the study, data obtained from 6 (2 males and 4 females) were used to pilot test the research materials and procedures. Thus, only the data from the remaining 65 participants (22 FD, 22, FM, and 21 FI learners) were used in the main study, and the final sample was much smaller than the initial pool of voluntary participants. Of the 65 participants, 53 were females and 12 were males, because 82% of the 165 teacher education students were females. Students from each group of learners (FD, FM, and FI) were randomly assigned into two groups, namely, Text-Only (T-O) and Text-and-Visual (T-V) groups that differed in the type of materials they received in order to solve a complex task. The T-O group had 11 students from each group of FD, FM, and FI learners, whereas the T-V group had 11 FD and 11 FM learners, but only 10 FI learners.
3.2 Instruments The HFT, which is one of the 72 tests in the Kit of Factor Referenced Cognitive Tests, was used to determine participants’ field type (French, Ekstrom, & Price, 1963). The HFT has 32 questions and it is either self- or group-administered. It consists of two separate parts, and 12 minutes are allowed for answering each part. The items require individuals to identify or determine which one of five simple figures is embedded in a more complex pattern. One point is assigned to each correct answer to a test item, and the total test scores range from 0-32. The HFT has been extensively used in research, is reliable, and highly correlated (r =. 67 to .88) to the Group Embedded Figures Test (Witkin, Oltman, Raskin, & Karp, 1971). For the purpose of this study, the HFT was administered to six groups of elementary education students totaling 157 people. The average performance of the total number of students on the HFT was 14.43 (SD = 5.42). Those who scored 10 or lower were classified as FD, those who scored from 11 to 21 as FM, and those who scored 22 or higher as FI. The cut off scores and the resulting classification scheme were based on the rationale that the FD/I construct describes learners along a continuum (Liu & Reed, 1994), and, consequently, studying the performance of those who fall in the two extreme ends of the continuum and those who fall in the middle range would reveal any differences associated with the construct. The results of the HFT indicated that only 23 students were FI, while the rest were either FD (55) or FM (79), and, thus, the final sample of the study was smaller than the initial pool of volunteers.
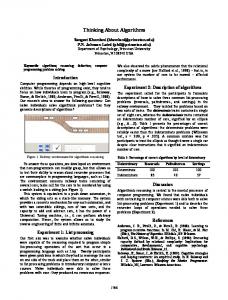
3.3 Description of Modeling Software A model usually consists of entities, factors, and relationships between factors. In the model in Figure 1, there are two entities, namely Mexico and USA, and each entity has several factors associated with it. Factors represent measurable or calculable characteristics of the entities, such as population, labor force, immigration flow, immigration rate, and jobs. Finally, factors are designated as causal or affected depending upon the direction of the relationship between them. For example, as shown in Figure 1, Mexico labor force is the affected factor and Mexico population is the causal factor, because any increase in Mexico population will cause an increase in Mexico labor force. After the creation of a model, the user may run it. When a model is run, a timer counts arbitrarily sized time steps, which may represent a minute, an hour, or whatever time interval a user may conceptualize. The user can also test a model using graphical tools. One tool, namely, the meter displays a factor’s current value at the current time step. If a factor is considered as an independent factor, its value can be adjusted while the model is running. Thus, the user may test a model at run time and observe how it changes dynamically. Another tool, the simulation graph, which presents a line graph displaying how factors change over a series of time steps. Model-It supports relationships (Jackson, Stratford, Krajcik, Soloway, 1996) that can model immediate effects in the value of the affected factor due to a change in the value of the causal factor that preceded it. Model-It also supports a qualitative, verbal description of relationships, because changes in a relationship may be defined in terms of two orientations (i.e., increases or decreases) and different variations (i.e., about the same, a lot, a little, more and more, less and less).
291
ISBN: 972-98947-7-9 © 2004 IADIS
3.4 Instructional Task Participants had to individually explore the model shown in Figure 1 for solving a problem about immigration policy. In order to solve the problem, students had to understand the underlying structure of the model, i.e., the entities of the model, the related factors, and the relationships among them. Thereafter, they were to form hypotheses, test them, evaluate their consequences, and decide which solution was the optimal solution to the problem. The model in Figure 1 presented the situation at the Mexican-USA border regarding the immigration of Mexicans to the United States due to a gap in unemployment rates between the United States and Mexico, and many opportunities for employment in the United States. It showed cause-and-effect relationships between several factors affecting the unemployment rate in each country, such as population, labor force, and job export. For example, the model showed how an increase in Mexico population would cause an increase in Mexico labor force, and, consequently, an increase in Mexico unemployment rate. The model also showed how an increase in Mexico unemployment rate would cause an increase in the movement of Mexicans to the United States, and how this increase in immigration flow to the United States would finally cause an increase in the unemployment rate of the United States. Participants were given four possible policies to explore in Model-It, such as (a) Open Border, (b) Closed Border, (c) Job Export, and (d) Immigration. An open border policy encourages the immigration of Mexican people to the United States, and allows the free movement of businesses and jobs from the United States to Mexico. A closed border policy discourages the immigration of Mexicans to the United States and the movement of industries and jobs from the United States to Mexico. A job export policy creates disincentives for American businesses in order to discourage their movement from the United States to Mexico. In addition this policy implements trade barriers, so that Mexican goods become more expensive to sell in the United States. Lastly, an immigration policy does not allow the immigration of Mexicans to the United States, but it takes no action about the movement of businesses and jobs from the United States to Mexico. Students were asked to form hypotheses based on these policies and test them using Model-It. Then, they were asked to evaluate the results and propose the policy that should be adopted for the purpose of regulating, as optimally as possible, the situation at the Mexican-USA border.
Figure 1. A model on immigration dynamics
292
IADIS International Conference Cognition and Exploratory Learning in Digital Age (CELDA 2004)
3.5 Scoring Rubric A rubric was constructed to evaluate participants’ problem-solving performance. Based on the rubric, participants’ scores ranged from 1 (low performance) to 3 (high performance). Learners' performance was holistically evaluated depending on three criteria, that is, (a) whether they took into account and correctly interpreted the simulated outcomes of the model, (b) whether they examined both the pros and cons of each of the four policies, and (c) whether they considered the long-term effects of each policy, and recognized that ramifying may take a long time.
3.6 Materials There were two sets of materials, namely Set A and Set B. The two sets differed only in how the underlying structure of the computer model was described. In Set A the model was described only in narrative form without any visuals. In Set B, the researchers presented the same information as in Set A, but, in addition, they explained the structure of the model using diagrams. Specifically, the researchers decomposed the complete model, presented in Model-It, into smaller parts, and included in the instructional materials a visual of each sub-part (in the form of a concept map) along with its description in narrative form.
3.7 Research Procedures Data were collected in six different sessions. During each two-hour session, the researchers initially demonstrated Model-It for twenty minutes, and showed, using a different model, how to run and test a model in Model-It. Each participant was then given the appropriate set of materials (Set A or Set B) and was asked to open a file with the computer model about immigration dynamics in Model-It. Students were instructed to work individually and use their instructional materials and the computer model in Model-It to suggest which of the four policies constituted the optimum solution to the USA-Mexico border problem.
4. RESULTS A 3 (FD, FM, FI) x 2 (T-O, T-V) factorial between-subjects research design, with a classifying variable (FD/I), an independent variable (type of instructional materials), and participants’ problem-solving achievement with the modeling software as the dependent variable, was conducted. Table 1 shows descriptive statistics of students' problem-solving performance for the T-O and T-V groups, and for the three subgroups of FD, FM, and FI. Table 1. Descriptive Statistics of Students’ Problem-Solving Achievement Scores (n=65) Classification Based on HFT Scores FM FI Mean SD n Mean SD n
Mean
FD SD
Text Only
1.45
.69
11
1.45
.52
11
1.55
.52
Text-and-Visual
1.55
.69
11
1.45
52
11
2.50
Total
1.50
.67
22
1.45
.51
22
2.00
Intervention
n
Mean
Total SD
11
1.48
.57
33
.71
10
1.81
.78
32
.77
21
1.65
.69
65
The results in Table 1 indicate that participants in the T-V group scored in general higher than those in the T-O group, but the effect ascribed to the textual-and-visual materials was highly depended upon learners’ field type. Specifically, FI students outperformed the other two groups of learners in the T-V group, while such differences did not seem to exist in the T-O group.
293
n
ISBN: 972-98947-7-9 © 2004 IADIS
A 3 (FD, FM, FI) x 2 (T-O, T-V) ANOVA was subsequently performed and the results indicated that students in the T-V group outperformed those in the T-O group, with F (1, 59) = 5.253, p =. 025, and that performance was significantly related to FD/I, with F (2, 59) = 5.658, p =. 006. Post hoc comparisons, using the Tukey HSD procedure, showed that FI learners had a statistically significant higher performance than both FD and FM learners, but there was no significant difference between FD and FM learners' performance. Finally, there was also a significant interaction effect between the two sets of instructional materials (T-O and T-V) and students' FD/I, with F (2, 59) = 3.938, p =. 025. The interaction effect indicates that the textual-and-visual materials significantly favored only FI learners. Thus, FI learners in the T-V group had significantly higher performance than both FD and FM learners in the T-V group, and FD, FM, and FI learners in the T-O group as well. There were no other significant differences among learners of different field types (FD, FM, or FI) in either group. The effect size of the superior performance of FI learners in the T-V group was 1.8 (2.50-1.55/. 52=1.8) indicating that the average FI learner in the T-V group was at 1.8 standard deviations above the mean of FI learners in the T-O group. Similarly, FI learners in the T-V group had a statistically significant higher performance than FD and FM learners in the same group. An effect size of 1.38 was calculated indicating that the average FI learner in the T-V was at 1.38 standard deviations above the mean performance of FD learners in the same group.
5. DISCUSSION AND EDUCATIONAL SIGNIFICANCE The results strongly suggest that the effectiveness of instructional materials depends on learners' FD/I style. The results showed that the average FI learner in the T-V group scored 1.8 standard deviations higher than the mean of FI learners in the T-O group, and 1.38 standard deviations higher than the mean of FD learners in the T-V group. These results indicate that the visuals inserted in the T-V materials had a strong advantage on FI learners who outperformed FD and FM learners in both groups, and FI learners in the T-O group. Thus, the evidence suggests that adding visuals in a spatial and timely coordination with the textual information can enhance understanding, and that their functional role depends on learners’ field type. Dual Coding Theory (Clark & Paivio, 1991; Paivio, 1986) attributes a facilitating effect of visuals on learning, because words and sentences are usually processed and encoded in the verbal system. Visuals, however, are processed and encoded in two cognitive subsystems, the imagery and the verbal. Thus, the facilitating effect of visuals is ascribed to the advantage of dual coding as compared to single coding in memory. The conjoint processing theory (Kulhavy, Stock, & Kealy, 1993) emphasizes that the simultaneous availability of textual and visual information in working memory makes it easier to make cross-connections between text and visuals, and facilitates later retrieval of information. Thus, visual displays can contribute to learning for two reasons. First, storing information in two codes, linguistic and visual, may increase memory of that information because it provides two paths to retrieve it from long-term memory, and, second, visual representations can be accessed as a whole and processed in a simultaneous manner, whereas linguistic representations are hierarchically organized and processed sequentially. The results of the study do not provide, however, unequivocal support to the aforementioned theoretical positions and the potential of visual information to promote learning. "Visual displays are considered tools for communication, thinking, and learning that require specific individual prerequisites in order to be used effectively" (Schnotz, 2002, p. 102). Field type, for example, represents learners' preferential mode of perceiving and processing information. Thus, some individuals may fail to master an instructional task, when they encounter tasks that require processing information in a way that they are unable to accomplish, simply, because they lack the information processing capabilities demanded by the task. Thus, FI learners appeared to outperform FD and FM learners in the T-V group, because the cognitive style of FD and FM learners inhibited the functioning of the appropriate information processing technique. The interaction effect between instructional materials and FD/I seems to support the notion of "cognitive coupling" (Fitter & Sime, 1980). In the context of this study, “cognitive coupling” refers to the relationship between the cognitive characteristics of the learner and the corresponding cognitive demands of the employed textual and visual materials (representations) and their consequent triggering effect on the construction of mental representations. The idea of “cognitive coupling” supports that an inappropriate “cognitive coupling” between the learner and the instructional materials, or any other system, does not provide any benefit to learners, but a proper “cognitive coupling” significantly facilitates the interaction of the learner with the instructional task (Moffat, Hampson, & Hatzipantelis, 1998),
294
IADIS International Conference Cognition and Exploratory Learning in Digital Age (CELDA 2004)
which, in this case, entailed a higher degree of "immersion" in the problem-solving task assisted by Model-It. This approach focuses on a learner-centered perspective, which implies that deeper "immersion" in model exploration results in deeper cognitive processing of information, and, consequently, better problem-solving performance. Even though cognitive style "has sparked the interest of researchers concerned with instructional development" (Greco & McClung, 1979, p. 97); researchers have not yet addressed adequately its implications for technology-enhanced learning environments. The findings of this study are of educational significance, because they provide preliminary evidence that a computer-supported learning environment with modeling tools benefited mostly FI learners. It is, however, premature to conclude that matching learners' cognitive control (style) will result in better learning. It rather remains an open question whether adapting instructional materials, textual or visual, to aptitude-treatment effects could be beneficial for thinking and learning. Accommodating learners' cognitive style in instruction may not only have cognitive benefits but also cognitive costs. The problems arise not only because "no matter how you try to make an instructional treatment better for someone, you will make it worse for someone else" (Snow, 1976, p. 292), but also because "no matter how you try to make an instructional treatment better in regard to one outcome, you will make it worse for some other outcomes" (Messick, 1976, p. 266). In conclusion, as Chinien and Boutin (1992/93) state, building cognitive style in the instructional design process can be a promising approach for accommodating individual differences due to cognitive functioning, but "it is equally important to ascertain the impact of accommodating for cognitive style on students of varying degrees of need of accommodation" (p. 308) by providing the flexibility to attenuate cognitive style biases in instructional materials.
REFERENCES Bransford, J. D., Brown, A. L., & Cocking, R. R., 2001. How people learn: Brain, mind, experience, and school. Washington, D.C.: National Academy Press. Bruer, J. T., 1993. Schools for thought: A science of learning in the classroom. Cambridge, MA: The MIT Press. Canelos, J., Taylor, W. D., & Gates, R. B., 1980. The effects of three levels of visual stimulus complexity on the information processing of field-dependents and field-independents when acquiring information for performance on three types of instructional objectives. Journal of Instructional Psychology, 7, 65-70. Chinien, C. A., & Boutin, F., 1992/1993. Cognitive style FD/I: An important learner characteristic for educational technologies. Journal of Educational Technology Systems, 21(4), 303-311. Clark, J. M. , & Paivio, A., (1991). Dual coding theory and education. Educational Psychology Review, 3, 149-210. Davis, J. K., 1991. Educational implications of field dependence-independence. In S. Wapner & J. Demick (Eds.), Field dependence-independence: cognitive styles across the lifespan (pp. 149-175). Hillsdale, NJ: Lawrence Erlbaum Associates. Dillon, A., & Gabbard, R., 1998. Hypermedia as an educational technology: A review of the quantitative research literature on learner comprehension, control, and style. Review of Educational Research, 68(3), 322-349. Fitter, M. J., & Sime, M. E., 1980. Responsibility and shared decision making. In A. T. Smith and T. R. G. Green (Eds.), Human Interaction with Computers, (pp. 32-60). London: Academic Press. French, J. W., Ekstrom, R. B., & Price, L. A., 1963. Kit of reference tests for cognitive skills. Princeton: Educational Testing Services. Glass, L., & Mackey, M., 1988. From clocks to chaos. Princeton: Princeton University Press. Greco, A. A., & McClung, C., 1979. Interaction between attention directing and cognitive style. Educational Communication and Technology Journal, 27(2), 97-102 Haken, H., 1981. Chaos and order in nature. New York, NY: Springer-Verlag. Jackson, S., Stratford, S., Krajcik, J., & Soloway, E., 1996. Making dynamic modeling accessible to pre-college science students. Interactive Learning Environments, 4, 233-257. Jonassen, D. H., & Grabowski, B. L., 1993. Handbook of Individual Differences, Learning and Instruction. Hillsdale, NJ: Lawrence Erlbaum Associates.
295
ISBN: 972-98947-7-9 © 2004 IADIS
Jonassen, D. H., & Reeves, T. C., 1996. Learning with technology: Using computers as cognitive tools. In D. H. Jonassen (Ed.), Handbook of Research for Educational Communications and Technology (pp. 693-719). New York, NY: Simon & Schuster Macmillan. Kulhavy, R. W., Stock, W. A., & Kealy, W. A., 1993. How geographic maps increase recall of instructional text. Educational Technology Research and Development, 41, 47-62. Liu, M., & Reed, W. M., 1994. The relationship between the learning strategies and learning styles in a hypermedia environment. Computers in Human Behavior, 10(4), 419-434. Lyons-Lawrence, C. L., 1994. Effect of learning style on performance in using computer-based instruction in office systems. The Delta Pi Epsilon Journal, XXXVI(3), 166-175. Messick, S. (Ed.)., 1976. Individuality in learning: Implications of cognitive styles and creativity for human development. San Francisco, CA: Jossey-Bass. Moffat, S. D., Hampson, E., & Hatzipantelis, M., 1998. Navigation in a "virtual" maze: Sex differences and correlation with psychometric measures of spatial ability in humans. Evolution and Human Behavior, 19, 73-78. Morgan, H., 1997. Cognitive styles and classroom learning. Westport, CT: Praeger. Paul, R., 1995. Critical thinking: How to prepare students for a rapidly changing world. Santa Rosa, CA: Foundation for Critical Thinking. Paivio, A., 1986. Mental representations: A dual coding approach. Oxford, UK: Oxford University Press. Penner, D. E., 2000/2001. Cognition, computers, and synthetic science: Building knowledge and meaning through modeling. Review of Research in Education, 25, 1-36. Reiff, J., 1996. At-risk middle level students or field dependent learners. Clearing House, 69(4), 231-234. Richmond, B., 2001. An introduction to systems thinking. Hanover, NH: High Performance Systems, Inc. Schnotz, W., 2002. Towards an integrated view of learning from text and visual displays. Educational Psychology Review, 14(1), 101-120. Snow, R. E., 1976. Aptitude-treatment interactions and individualized alternatives in Higher Education. In S. Messick (Ed.), Individuality in learning: Implications of cognitive styles and creativity for human development. San Francisco, CA: Jossey-Bass. Witkin, H. A, Oltman, P. K., Raskin, E., & Karp, S. A., 1971. A manual for the children’s embedded figures test. Palo Alto, CA: Consulting Psychologists Press. Witkin, H. A., Price-Williams, D., Bertini, M., Christiansen, B, Oltman, P. K., Ramirez, M., & Van Meel, J., 1974. Social conformity and psychological differentiation. International Journal of Psychology, 9, 11-29.
296