labeled derivative strain of Pseudomonas putida ATCC 17514 on fluorene and ... that P. putida tends to grow directly on phenanthrene, forming a biofilm on.
A.C. Rodrigues*, S. Wuertz**, A.G. Brito* and L.F. Melo*** * Universidade do Minho, Centro de Engenharia Biológica/IBQF, 4710-057 Braga, Portugal ** University of California, Department of Civil and Environmental Engineering, Davis, One Shields Avenue, Davis CA 95616, USA *** LEPAE – Faculty of Engineering of the University of Porto, Chemical Engineering Department, 4200-465 Porto, Portugal Abstract Confocal laser scanning microscopy was used to monitor the colonization pattern of the gfplabeled derivative strain of Pseudomonas putida ATCC 17514 on fluorene and phenanthrene crystals. The in situ experiments showed that P. putida tends to grow directly on phenanthrene, forming a biofilm on accessible crystalline surfaces. On the other hand, no significant biofilm formation was observed in the presence of fluorene. The results obtained showed that substrate properties affected bacterial strategy regarding uptake. Keywords CLSM; GFP; polycyclic aromatic hydrocarbons; Pseudomonas putida
Introduction
Fluorene and phenanthrene are polycyclic aromatic hydrocarbons (PAHs) that are found in high concentrations in contaminated sediments, surface soils, and waste sites. Bioremediation of these sites is limited by the low bioavailability of PAHs due to their low water solubility and dissolution rate. Some microorganisms are able to grow on hydrophobic PAHs by direct contact (Tiehm, 1994), thus overcoming the limiting steps of substrate solubilisation and diffusion through the aqueous phase to the cell surface. For instance, Ortega-Calvo and Alexander (1994) found that naphthalene present in a nonaqueous-phase liquid (NAPL) was degraded at a faster rate by bacteria growing at the water–NAPL interface compared with suspended bacteria. Attachment to crystalline PAHs may be a bacterial strategy to improve the substrate bioavailability. Advances in nondestructive methods of microscopic analysis using confocal laser scanning microscopy (CLSM) and cell markers such as the gfp gene encoding the green fluorescent protein (GFP) have led to more detailed information regarding biological processes (Chalfie et al., 1994). To obtain a deeper insight into the strategies used by bacteria to feed on such hydrophobic compounds, the time course of biofilm formation by a GFP-labeled Pseudomonas putida strain on fluorene and phenanthrene crystals as sole carbon and energy source was monitored using CLSM.
Water Science and Technology Vol 47 No 5 pp 139–142 © IWA Publishing 2003
Three-dimensional distribution of GFP-labeled Pseudomonas putida during biofilm formation on solid PAHs assessed by confocal laser scanning microscopy
Methods
The experiments with the gfp-labeled derivative strain of P. putida ATCC 17514 were carried out in a four-channel (5 × 10 × 40 mm) flow-cell, limited by two microscope glass coverslips. The glass coverslip at the bottom of the flow-cell was coated with PAH crystals. In channels 1 and 2, a single PAH was used (phenanthrene in channel 1 and fluorene in channel 2). In channel 3, fluorene was placed at the inlet and phenanthrene at the outlet. Channel 4 was not used in these experiments. Each flow channel was inoculated with an
139
A.C. Rodrigues et al.
overnight culture of gfp-labeled P. putida cells pregrown on the respective PAH at 25°C, in the dark, with shaking at 150 rpm. After 1 hour of incubation, mineral medium containing CaCl2.2H2O (69.6 mg L–1), NaCl (8 mg L–1), KNO3 (103 mg L–1), NaNO3 (698 mg L–1), MgSO4.7H2O (100 mg L–1), NTA (100 mg L–1), FeSO4.7H2O (2 mg L–1), ZnSO4.7H2O (0.1 mg L–1), MnSO4.5H2O (0.043 mg L–1), H3BO3 (0.3 mg L–1), CoSO4.7H2O (0.24 mg L–1), CuSO4.5H2O (0.01 mg L–1), NiSO4.7H2O (0.02 mg L–1), NaMoO4.2H2O (0.03 mg L–1), Ca(OH)2 (0.5 mg L–1), EDTA (5 mg L–1), KH2PO4 (544.4 mg L–1), Na2HPO4 (2148.9 mg L–1) and (NH4)2SO4 (30 mg L–1) was continuously pumped at a flow rate of 5 mL/h. The flow-cell was placed under a microscope AXIOVERT 135 TV with a confocal laser unit, coupled to a Leica QUANTIMET image analysis computer. In each channel, three distinct areas, at the inlet (a), at the middle (b) and at the outlet (c), were monitored. Twenty horizontal optical sections were scanned at 2 µm vertical intervals. The total number of scans was optimised in order to minimize the artefacts caused by exposure of cells to the laser light for long periods (i.e., bleaching). The bacteria were detected with an Ar 488 nm laser using a 515 nm long-pass filter, and the PAH crystals with a HeNe 543 nm laser line using a 550 nm long-pass filter. Images were obtained with a 40×/1.3 NA oil immersion lens. The growth of P. putida::gfp cells was monitored during six days. Biovolumes were determined by numeric integration of microbial colonization profiles, following the method described in Kuehn et al. (1998). Batch assays were performed in 250-mL Erlenmeyer flasks, containing 50 mL of mineral medium and PAH crystals (100 mg/L), in order to gather information regarding biodegradation rates and partition coefficients of the PAHs between the biomass and the liquid phase. PAHs were analysed by reversed-phase high-pressure liquid chromatography after extraction with n-hexane. Biomass growth was assessed by means of optical density (OD540nm) measurements. The volatile suspended solids (VSS) concentration was determined by gravimetry. Results and discussion
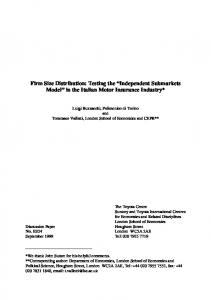
Figure 1 Time profiles of the gfp-labeled P. putida cell volume during growth on phenanthrene, in different stacks, for three areas (a, b and c) of flow channel 1
Stack No.
4c
96 7b
24 Time [h]
0
3c
4c
3c
7b
96 8b
1a
0
5.000
8b
5.000
Direction of Flow
10.000
1a
10.000
15.000
2a
Direction of Flow
Stack No.
140
Cell Volume [µm3]
15.000
2a
Cell Volume [µm3]
By using CLSM in conjunction with GFP-labeling, horizontal (xy) and sagital (xz) sections of P. putida cell-aggregates during growth on PAH crystals were obtained. Figures 1–3 depict the growth of P. putida::gfp cells in flow channels 1–3, in the different stacks. Growth of P. putida::gfp cells was detected in all scanned regions in channels 1 (phenanthrene crystals only) and 2 (fluorene crystals only). In both channels, the colonization pattern was random and no external effect on growth was detected (Figures 1 and 2). In contrast, in channel 3 (inlet: fluorene, outlet: phenanthrene), P. putida cells were mainly concentrated where the phenanthrene crystals were located, with the cell volume at the inlet and at the centre of the channel being relatively low (Figure 3). In all channels, a decrease in
24
Time [h]
Figure 2 Time profiles of the gfp-labeled P. putida cell volume during growth on fluorene, in different stacks, for three areas (a, b and c) of flow channel 2
Direction of Flow
3
3.000 2.000 1.000
24 4c
Stack No.
3c
7b
1a
96 Time [h]
Figure 3 Time profiles of the gfp-labeled P. putida cell volume during growth on fluorene (inlet) and phenanthrene (outlet), in different stacks, for three areas (a, b and c) of flow channel 3
A.C. Rodrigues et al.
2a
0 8b
Cell Volume [µm ]
4.000
[PAH] (mg/L)
150
2,5 2 1,5 1 0,5 0
100 50 0 0 total FL
5 10 Time (days)
15
total PH
OD (540 nm)
OD (540 nm)
the biovolume in the different stacks was occasionally observed, a phenomenon that was considered to be the result of cell motility or detachment. The in situ experiments indicated that substrate characteristics affected bacterial strategy regarding uptake. P. putida cells attach and grow on the phenanthrene crystals throughout the formation of a biofilm on accessible surfaces, despite the fact that they can also feed on dissolved fluorene, more water-soluble than phenanthrene, supplied from upstream. Indeed, Figure 4 shows that, in the presence of fluorene and phenanthrene crystals, P. putida degrades both PAHs simultaneously. As can be seen in Figure 4, after a lag period of approximately 2 days, exponential growth was observed. Initially, an increase in the total fluorene and phenanthrene apparent concentrations was noticed due to dissolution rates superimposed on PAH metabolism. After an equilibration period, fluorene and phenanthrene concentration in the suspension decreased with time. The maximum specific apparent degradation rates for fluorene, 9.2 mg g VSS–1 d–1, and phenanthrene, 22.8 mg g VSS–1 d–1 (corresponding to 0.41 and 1.03 mg PAH L–1 h–1, respectively) were higher than the observed degradation rates of these PAHs when a single compound was used by P. putida ATCC 17514 as sole carbon and energy source for growth (data not shown). Apparently, the bacterial strategy of feeding on fluorene and phenanthrene simultaneously stimulates the degradation of both PAHs. During the exponential growth phase, an increase in the concentration of cell-associated PAH was observed. At the late exponential growth phase, the PAH concentration in the cell pellet declined continuously as a result of the continued metabolism of cell-associated PAH (Figure 5). The increase in pellet-associated PAH was more noticeable for phenanthrene, the fraction of cell-associated phenanthrene being 2.24 ± 0.48 times higher than the fraction of cell-associated fluorene. These data are consistent with the higher hydrophobicity of phenanthrene compared to fluorene.
Figure 4 Fluorene (FL) and phenanthrene (PH) degradation by P. putida ATCC 17514
141
PAH in cell pellet (mg/gVSS)
800
Fluorene
600
Phenanthrene
400 200 0 3
A.C. Rodrigues et al.
8 Time (days)
13
Figure 5 Degradation of cell-associated fluorene and phenanthrene by P. putida
Conclusions
The combination of CLSM and GFP-labeling proved to be an effective method to monitor in situ the growth of P. putida on solid PAHs. The method allowed us to obtain quantitative information and to make three-dimensional reconstructions of cell volumes. Quantitative confocal laser scanning microscopy studies showed that P. putida overcomes the low aqueous phase concentration of phenanthrene by directly colonizing crystals, thus promoting the availability and uptake of such a predominantly water-insoluble compound. Acknowledgements
The authors acknowledge grant PRAXISXXI/BD/15944/98 from the Foundation for Science and Technology/M.C.T., Portugal, awarded to A.C. Rodrigues, and the financial support provided by Instituto de Biotecnologia e Química Fina (IBQF). The CLSM studies were performed at the Technical University of Munich, Germany and partially supported by the EC Biotech program (contract BIO4-CT97-2015). ACR is grateful to L. Hendrickx for assistance in the labeling of P. putida and A. Schnell for help in setting-up the flow-cell experiments. References Chalfie, M., Yuan, T., Euskirchen, G., Ward, W.W. and Prasher, D.C. (1994). Green fluorescent protein as a marker for gene expression. Science, 263, 802–805. Kuehn, M., Hausner, M., Bungartz, H.J., Wagner, M., Wilderer, P. and Wuertz, S. (1998). Automated confocal laser scanning microscopy and semiautomated image processing for analysis of biofilms. Appl. Environ. Microbiol., 64(11), 4115–4127. Ortega-Calvo, J.J. and Alexander, M. (1994). Roles of bacterial attachment and spontaneous partitioning in the biodegradation of naphthalene initially present in nonaqueous-phase liquids. Appl. Environ. Microbiol., 61, 2643–2646. Tiehm, A. (1994). Degradation of polycyclic aromatic hydrocarbons in the presence of synthetic surfactants. Appl. Environ. Microbiol., 60, 258–263.
142