ersu s. D ifferen tâ. N ew. C a n o n ica l. M e an. 5 .9. 4*. *. 5 .3. 2*. 3. 5.44 y y. 32 .1. 7y y. 4. 8 .2. 4y y. 4 ...... Mind and Language, 5,. 387â410. Kazmerski, V. A. ...
Time Course of Processes and Representations Supporting Visual Object Identification and Memory Haline E. Schendan1 and Marta Kutas 2
Abstract & Event-related potentials (ERPs) were used to delineate the time course of activation of the processes and representations supporting visual object identification and memory. Following K. Srinivas (1993), 66 young people named objects in canonical or unusual views during study and an indirect memory test. Test views were the same or different from those at study. The first ERP repetition effect and earliest ERP format effect started at ¹150 msec. Multiple ERP repetition effects appeared over time. All but the latest ones were largest for same views, although other aspects of their form specificity varied. Initial ERP format effects support multipleviews-plus-transformation accounts of identification and indi-
INTRODUCTION To identify an object visually, many functionally distinct brain areas analyze the retinal image. When visual analyses have advanced sufficiently, the percept is matched to stored object representations and categorized into a known class (e.g., car). This function is known as ‘‘object model selection’’ (Ullman, 1996) or a ‘‘structural description system’’ process (Humphreys & Bruce, 1989). On some identification accounts, unusual views of objects also undergo ‘‘view compensation’’ (viz. transformation, view interpolation/extrapolation, alignment, mental rotation) before a model is selected. Successful model selection then enables activation of knowledge associated with the object class (e.g., its name or utility). The present study aimed to use memory to probe model selection representations and view compensation processes to characterize memory in terms of these functions. Behavioral and event-related brain potential (ERP) measures were recorded. ERPs are a direct measure of neurophysiological activity with the temporal resolution (1 msec) needed to delineate the sequence of identification-related and memory processes. Our study also aimed to compare view-invariant and view-dependent accounts of object identification. On fully view-invariant accounts, identification occurs when a perceptual description is constructed of the same
1
Tufts University, 2University of California
© 2003 Massachusetts Institute of Technology
cate the timing of processes of object model selection (frontal N350 from 148 – 250 to 500 – 700 msec) and view transformation via mental rotation (posterior N400/P600 from 250 – 356 to 700 msec). Thereafter, a late slow wave reflects a memory process more strongly recruited by different than same views. Overall, the ERP data demonstrate the activation of multiple memory processes over time during an indirect test, with earlier ones (within 148 – 400 msec) characterized by a pattern of form specificity consistent with the specific identification-related neural process or representational system supporting each memory function. &
invariant type as in stored representations of salient features ( Jolicoeur, 1990; Corballis, 1988) or objectcentered whole (3-D) models (Marr & Nishihara, 1978). On partial view-invariant accounts, identification is also invariant but only over a limited rotation range where view-invariant 3-D parts (Biederman, 1987), salient features (Koenderink, 1990), or 2-D views (Perrett, Oram, & Ashbridge, 1998; Turnbull, Carey, & McCarthy, 1997) in stored representations are the same as those perceived. Whenever other parts, features, or views are visible, a different object model is needed, and identification performance drops. On view-dependent accounts, identification is achieved by matching a perceived image with stored representations of multiple 2-D views (Bu ¨ lthoff, Edelman, & Tarr, 1995). Regarding model selection processes, these accounts thus all differ in the nature of the underlying representations but concur that such processes suffice to identify familiar or canonical views of objects. A key point on which these frameworks disagree concerns how unusual views are identified. The hallmark of viewdependent accounts is that they alone postulate a dual procedure wherein identification of unusual views requires an extra process of view compensation before a correct object model can be selected (Bu ¨ lthoff et al., 1995). Critically, this predicts different processing effects in the ERPs over time. We used an indirect memory test to probe model selection and hypothesized compensation functions, as Journal of Cognitive Neuroscience 15:1, pp. 111– 135
Figure 1. Designs and sample stimuli for Experiments 1 (Unusual test views) and 2 (Canonical test views). In both experiments, during the study session, objects were seen in either Unusual or Canonical views (top) and, during the indirect memory test, either the Same or a Different view of each studied object was shown among New objects. During the indirect memory test, all objects were shown from only one type of view. In Experiment 1, they were all Unusual views (middle). In Experiment 2, they were all Canonical views (bottom). Sample stimuli are from the Tarr Object DataBank (Copyright 1996, Brown University, Providence, RI; all rights reserved); other objects included birds, buildings, clothing accessories, fruit, furniture, kitchen items, mammals, musical instruments, office supplies, sports items, toiletries, tools, toys, and vehicles.
such tests have been considered to be well-suited for characterizing the processes and representations mediating identification (Biederman & Cooper, 1991). Indirect tests presumably tap unconscious memory processes occurring outside of awareness, as inferred from differences in performance between old and new items (‘‘priming’’), while direct memory tests assess conscious memory occurring with awareness of the remembered information (‘‘recognition’’). In both indirect and direct memory tests, ERP differences between studied and new items (ERP repetition effects) typically begin ¹300 msec or so with greater positivity for studied words, nonwords (Swick & Knight, 1997), faces (Mu ¨ nte et al., 1997), and other objects (Kazmerski & Friedman, 1997). This time course coin112
Journal of Cognitive Neuroscience
cides with that for ERP components linked to stimulus meaning within a context, such as P300 modulation by target/nontarget status (McCarthy & Donchin, 1981) and N400 modulation with semantic analysis (Ganis, Kutas, & Sereno, 1996). We were especially interested in assessing early repetition effects (pre-300 msec), which have thus far remained quite elusive (Badgaiyan & Posner, 1997), because convergent evidence indicates that perceptual processes contribute to priming (Buckner et al., 1998; Schacter et al., 1995). As early ERP components (50 – 200 msec) have been linked to lower-level visual analyses (Schendan, Ganis, & Kutas, 1998; Clark, Fan, & Hillyard, 1995), modulation of these components would likely reflect the effect of prior exposure on perceptual processes. Volume 15, Number 1
We also aimed to use the pattern of ERP repetition effects to examine key issues for object identification accounts. (i) When, under what viewing conditions, and during which processes are object representations viewspecific? In memory research, view specificity is known as a kind of form specificity. (ii) Does object identification involve view compensation operations? (iii) And if so, are compensation and model selection supported by the same brain system? (iv) Does view compensation precede object model selection? We hoped to use the answers to these questions to bridge a gap between high-level vision and visual memory research by characterizing memory for objects in terms of various identification processes and representational systems. To that end, we applied the transfer appropriate processing (TAP) memory framework to each representational system and process specified in the various object identification accounts (Kolers & Magee, 1978; Tulving & Thomson, 1973). As the size of the expected ERP repetition effects would thus depend on the degree to which the study and test experiences activated the same repre-
sentation(s) and/or process(es), we could use the success of the identification accounts at predicting the ERP pattern across time to specify which these were. We adapted a design that yields view-dependent priming, implicating view compensation in identification (Srinivas, 1993). In the study phase, participants named objects from an ‘‘unusual’’ or a ‘‘canonical’’ view (Figure 1). In a later indirect memory test, they named new objects or ones previously studied from the same or a different view to assess the form specificity of memory (‘‘format effects’’). In Experiment 1, all test views were Unusual, and we hypothesized that ERP format effects would reveal memory for a view compensation process in Same but not in Different view conditions; Experiment 2 with canonical test views was conducted to evaluate which findings from Experiment 1 were specific to unusual test views, reflecting view compensation, and which processes were recruited by all views (i.e., model selection). Accordingly, we will discuss the results of both experiments together, comparing the pattern predicted by each representation type
Figure 2. Diagrams depicting how the predicted repetition effects differ depending upon each type of representational system, process (i.e., view compensation), or combined representation and process that a particular object identification account hypothesizes. Each account predicts different patterns of form-specificity (Same vs. Different) and testview dependence (Canonical vs. Unusual). Corners labeled with the four repetition trial types represent both the amplitude and the scalp distribution shape of each respective repetition effect, except for the following: (A) Two visual streams diagrams depict predictions for only scalp distribution shape, while the Parts diagram depicts predictions for only amplitude differences. (B) The diagram for the view compensation process & multiple individual 2-D views combined depicts predictions for only amplitude differences, as the scalp distribution shape predictions are depicted in the diagram for the view compensation process alone; note, the process & linked 2-D views diagram is drawn in gray lines because it predicts the same pattern as the view compensation process alone.
Schendan and Kutas
113
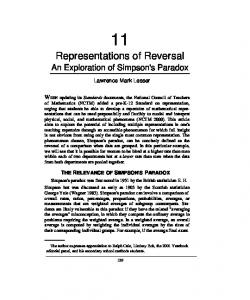
main effect of format within Experiment 1 F(1,33) = 7.3, p < .02. For all items, Same view repetitions showed no priming, Fs < 1.6, while Different view repetitions showed higher identification accuracy when originally studied in a canonical instead of an unusual view, Fs(1,27) > 17, ps < .0005. Direct memory queries showed that participants overestimated object repetitions (actual 66%) to the same extent for Unusual (75%) and Canonical (79%) test views. They also mistakenly ‘‘remembered’’ that more objects were repeated from a Different (49% Unusual, 43% Canonical) than the same (28% Unusual, 36% Canonical) view, main effect of format, F(1,60) = 14, p < .001. Test Phase ERPs Figure 3. Priming (msec) of identification RTs during the indirect memory test for Experiment 1 (Unusual test views) and Experiment 2 (Canonical test views) with equal group sizes (n = 30). For studied objects, values include only trials where identification was correct at both study and test. Values on the bars are the priming value for each condition; note, for all 36 participants in Experiment 1, mean Same RT was 757 msec and mean Different RT was 815 msec. RTs to New objects are provided ( bottom). Main repetition effects were reliable: Same versus new, Experiment 1: F(1,33) = 48.2, Experiment 2: F(1,27) = 24.9, ps < .0001; Different versus New, Experiment 1: F = 24.4, Experiment 2: F = 12.4, ps < .005.
and/or process in the identification accounts (Figure 2) to the full pattern of ERP repetition and format effects (across four trial types: Same Unusual, Different Unusual, Same Canonical, Different Canonical).
RESULTS Analyses were limited to trials (41 possible/condition) on which objects were named correctly at study and test. Mixed ANOVAs assessed the effect of changing view from study to test (a) within experiments using a format factor (Same, Different) and (b) between experiments using a test-view factor (Unusual, Canonical); all included a between-subject factor of object set (three levels) that is not reported. Alpha is .05.
Prior research guided selection of time periods for analysis (alpha = .04): (a) 140 – 250 msec assessed a vertex P150 indexing the earliest visuoperceptual categorization ¹132 msec (Schendan et al., 1998) and early (180 – 300 msec) repetition effects ( Van Petten, Kutas, Kluender, Mitchiner, & McIsaac, 1991); ( b) 300 – 400 msec assessed a frontal N350 indexing a model selection system (Schendan & Kutas, 2002) implicated in object priming (Schacter et al., 1995); (c) 400 – 500 msec assessed a parietal negativity indexing mental rotation (Bajric, Rosler, Heil, & Hennighausen, 1999) and an N400 modulated in indirect memory tests (Rugg et al., 1998); (d) 500 – 700 msec assessed ongoing parietal negativity, as well as a P600 implicated in late identification-related processes (Schendan & Kutas, 2002; Stuss, Picton, Cerri, Leech, & Stethem, 1992) and recollection in direct memory tests (Paller, Kutas, & McIsaac, 1995). Pilot work suggested two additional periods (alpha = .01): a frontal P250 between 250 and 300 msec and a slow wave (SW ) between 700 and 850 msec. Table 1. Mean Identification Accuracy on the Indirect Memory Test Test-View Condition Study Condition
Unusual
Canonical
Test Phase Performance
All Items
Priming was assessed within each experiment in mixed ANOVAs (alpha = .0125) using a within-subject factor of repetition (studied vs. new). Identification response time (RT) showed overall priming and was slower on Different than Same trials (Figure 3), main effect of format, between experiments, F(1,54) = 18.7, p < .0005; within Experiment 1, F(1,33) = 14.8, p < .001; Experiment 2, F(1,27) = 13.4, p < .005. Accuracy was computed for (a) items identified correctly at study and (b) all items (Table 1). For the former measure, accuracy was worse in Different than Same conditions for Unusual test views, Format £ Test View interaction between experiments, F(1,54) = 6.9, p < .02;
Same
94.1 (93.6)
98.9
Different
97.0 (97.2)
93.1
New
93.7 (93.8)
98.1
Same
99.7 (99.7)
98.9
Different
98.3 (98.5)
99.6
114
Journal of Cognitive Neuroscience
Items Identified at Study
Identification accuracy was computed for all items ([number of correct at test/41] £ 100%) or only items identified correctly at study ([number of correct at test/number of correct at study] £ 100%). Results are from 30 participants each or in parentheses (all 36 participants of Experiment 1).
Volume 15, Number 1
Analyses of each period were based on unfiltered difference waves, computed by subtracting ERPs to studied items from those to respective new ones, analogous to methods used to estimate to behavioral priming. Separate ANOVAs were performed for midline (‘‘mid’’ 1, 26, 23, 6) and lateral electrode sites (all others) to assess hemispheric asymmetry using within-subject factors of hemisphere and site; Huynh – Feldt adjustments to degrees of freedom corrected for violation of sphericity assumptions. As statistical evaluations of variation in repetition and format effects with test view were required to test the hypotheses fully (Figure 2), omnibus ANOVAs between experiments were performed with format and test-view factors in each period. We assessed when repetition affects object processing and which repetition effects, if any, are formspecific by examining reliable deviations from zero of
the mean difference waves and format effects, respectively, in the two within-experiment ANOVAs: (i) Same – New versus Different – New with Unusual test views and (ii) Same – New versus Different – New with Canonical test views. Assessing which of these effects, if any, depends on the test view required four between-experiment contrasts: Two ANOVAs with a test-view source of variance contrast (iii) Same – New Unusual versus Same – New Canonical and (iv) Different – New Unusual versus Different – New Canonical; two ANOVAs with a trial type (i.e., Test View £ Format) source of variance contrast (v) Same – New Unusual versus Different – New Canonical and (vi) Same – New Canonical versus Different – New Unusual. The Bonferroni inequality specifies half the familywise alpha level per source of variance (alpha = .02 for P150, N350, N400, and P600; alpha = .005 for P250 and SW ).
Figure 4. Grand average ERPs to objects from unusual views during the indirect memory test. Epoch shown covers a 150-msec pre-stimulus baseline until 850 msec after stimulus onset. After 160 msec, P150, P250, N325, N400, LPC, and SW components to studied objects exhibit more positive voltage than those to new objects. Before 700 msec, repetition effects are smaller or comparable to objects studied in different than same views, whereas after 700 msec, they are not. Geodesic montage ( bottom right) shows ERP recording sites over the head; note, sites 6 and 26 correspond to traditional 10 – 20 sites, Oz and Cz, respectively.
Schendan and Kutas
115
Finally, assessment of whether the same brain systems support these effects required analyzing the vector normalization of difference ERP amplitudes (McCarthy & Wood, 1985), subjected to the same contrasts as above. Different scalp distribution shapes after normalization presumably implicate different configurations of neural generators, although to unknown degrees and in unknown ways, and similar shapes may reflect no difference or differences that cannot be seen at the scalp. To increase statistical power, all electrodes were analyzed together. Pattern and Scalp Distribution Shape of Repetition and Format Effects Repetition modulated at least one component in each measurement window (Figures 4 and 5). The specific pattern of ERP repetition effects varied over time and
was modulated by changing views from study to test. Format effects were typically larger for Unusual than Canonical test views; note, differences in effects between test views were not due to differential variability of ERPs between participant groups in Experiment 1 versus 2 (see scatter graphs in Appendix; Picton et al., 2000). P150 (140– 250 msec). Repetition increased a frontocentral P150, but this effect was larger in Same than Different conditions (Figure 6). Repetition effects were marginal for Unusual test views (Experiment 1) and reliable for Canonical ones (Experiment 2), and the main effect of format was reliable with Unusual test views and marginal with Canonical ones, as was a Format £ Site interaction (Table 2). Between experiments, the omnibus ANOVA further supported P150 effects with reliable repetition and format effects; testview effects were not reliable, Fs < 1, ps > .43. In addition, pairwise contrasts revealed the smallest repetition
Figure 5. Grand average ERPs to objects from canonical views during the indirect memory test. Epoch shown covers a 150-msec pre-stimulus baseline until 850 msec after stimulus onset. After 160 msec, P150, P250, N325, N400, LPC, and SW components to studied objects exhibit more positive voltage than those to new objects. Before 700 msec, repetition effects are smaller or comparable to objects studied in different than same views, whereas after 700 msec, they are not. Geodesic montage (bottom right) shows ERP recording sites over the head; note, sites 6 and 26 correspond to traditional 10 – 20 sites, Oz and Cz, respectively.
116
Journal of Cognitive Neuroscience
Volume 15, Number 1
Unusual Test Views
Canonical Test Views
P150 Studied Same View Studied Different View New
P150 –100
0
100
2 m V
200 msec
Figure 6. Grand average ERPs during the indirect memory test at the vertex (electrode 26, Cz) from ¡150 to 250 msec. The earliest repetition effect occurred by 160 msec, modulating a P150 that was maximal near the vertex. This effect is also the first form-specific one; P150 repetition effects to objects studied from the same view were larger than those studied from a different view.
effect in the Different Unusual condition. Repetition effects—indistinguishable for Canonical and Unusual test views—were reliable for same conditions (Table 3) but not for Different conditions (Fs < 1.2, ps > .28). Contrasts across formats and test views (Table 4) revealed reliable trial-type effects between Same Canonical and Different Unusual waves. The shapes of the scalp distributions of the P150 effects were similar across trial types, with one spurious exception (Same vs. Different for Canonical test views), F(27,729) = 2.40, p < .05. N350 (250– 400 msec). After 250 msec, a form-specific repetition effect modulated a frontal N350. Repetition reduced negativity for studied relative to new objects (Figures 4, 5, and 7), but the N350 repetition effect was larger for Same than Different views. Moreover, at this time, repetition effects were largest for Same Unusual views relative to all other trials. In the following N350 description, the P250 epoch (250 – 300 msec) is subsumed, as it behaved similarly to the N350. The repetition and format effects on the N350 were reliable (Table 2). Of analyses between experiments, omnibus ANOVAs further showed that format effects were larger for Unusual test views; Test View £ Format interactions were reliable during the P250 epoch and marginal during the N350 (Fs > 3.6, ps < .061). In addition, pairwise contrasts suggested further that repetition effects were largest for Same Unusual trials, smallest for Different conditions, with Same Canonical ones in between. Repetition effects were marginally larger on Same Unusual than Same Canonical trials (Table 3), and across formats and test views (Table 4), same unusual ERPs were larger than Different Canonical ones, as trial-type effects were reliable, while Same Canonical and Different Unusual effects differed mainly during the P250 when a trial-type effect was marginal.
The shape of the scalp distribution of the N350 effect on Same Unusual trials differed from that on others, which were indistinguishable from each other. In each experiment, scalp distribution shapes differed reliably between Same and Different conditions only for Unusual test views, Format £ Site, P250: F(27,891) = 4.31, e = .23; N350: F = 3.92, e = .19, ps < .005. Omnibus ANOVAs revealed a reliable Format £ Site interaction, N350: F(27,1458) = 6.03, p < .0001, e = .16. Pairwise contrasts between experiments showed that Same Unusual waves differed marginally or reliably from Same Canonical, Test View £ Site, P250: F(27,1458) = 2.21, p < .05, e = .23, and Different Canonical ones, Trial Type £ Site, P250: F = 2.22, p = .053; N350: F = 3.91, p < .005, e s = .2). N400 and P600 (400– 700 msec). Between 400 and 700 msec, repetition reduced the positivity for studied relative to new objects, and effects were larger posteriorly than anteriorly. A late positive complex (LPC) covered N400 (400 –500 msec) and P600 (500 – 700 msec) time periods during which effects were similar, except that, during the N400, repetition effects were larger on Same Unusual than other trials, which were indistinguishable from each other, while, during the P600, repetition effects at central sites were largest for Same Unusual trials, intermediate for Same Canonical and Different Unusual ones, which were indistinguishable from each other, and smallest for Different Canonical trials (Figures 4, 5, 7, and 8). LPC repetition and format effects were reliable, and format effects varied across the head with only Unusual test views (Table 2). Of analyses between experiments, omnibus ANOVAs supported these effects and their variation with test view (Table 2), and pairwise contrasts provided further evidence. The two Same conditions differed reliably throughout the LPC, while the two Different conditions differed marginally at the P600 time (Table 3; effect of test view, F = 3.92, p = .053) but not the N400 ( ps > .45). Contrasts across formats and test views (Table 4) revealed differences between Same Unusual and Different Canonical trials. The shapes of the scalp distributions of LPC repetition effects also differed between Same Unusual and other trials, which were indistinguishable. Within experiments, only Unusual test views showed a reliable Format £ Site interaction, N400: F = 5.61; P600: F = 2.93 (e s = .24, ps < .005). Of analyses between experiments, omnibus ANOVAs showed a reliable Format £ Site interaction during the N400 time, F(27,1458) = 7.38, p < .0001, e = .24. In addition, pairwise contrasts suggested that Same Unusual waves differed reliably from Same Canonical ones, Test View £ Site, N400: F(27,1458) = 3.33, p < .01, e = .19; P600: F = 2.84, p < .02, e = .21) and from Different Canonical waves, Trial Type £ Site, N400: F = 5.83, p < .0001, e = .17; P600: F = 2.65, p < .02, e = .22. SW (700– 850 msec). A post-700 msec SW marked the only repetition effect that was larger for Different than Schendan and Kutas
117
118
Journal of Cognitive Neuroscience
Volume 15, Number 1
ns
ns
E
E£H
ns
ns
ns
ns
E
E£H
F£E£H
F£H
ns
ns
2.83**
4.45**
F
F£E
6.70***
Mean
Canonical Test Views
F£E£H
F£H
ns
4.93***
F
F£E
3.86*
Lateral
Mean
Unusual Test Views
Source
P150
–
–
ns
–
ns
ns
4.79***
–
–
ns
–
ns
6.10***
4.29**
Mid
y
3.28
ns
ns
ns
ns
ns
15.14yy
–
–
ns
–
ns
ns
11.00y
ns
ns
ns
3.04***
ns
ns
19.24yy
ns
–
3.73
4.14**
6.26
yy
–
11.08
yyy
ns
7.21
y
yyy
–
5.37
yy
16.02yy
43.27yyy
Lateral
5.02***
10.47
ns
7.94
yy
19.72yy
18.50yy yy
25.49yyy
Mid
20.91yy
Lateral
P250
N350
yy
–
–
ns
–
ns
ns
16.32yy
–
–
8.80
–
9.10
yy
17.63yy
46.21yyy
Mid
yy
yyy
ns
ns
ns
6.78yy
9.97
ns
44.20yyy
2.42***
ns
7.56
ns
25.59
yyy
45.22yyy
88.18yyy
Lateral
N400
yyy
–
–
ns
–
10.79
ns yy
33.19yyy
–
–
15.37
–
38.97
yyy
48.32yyy
93.89yyy
Mid
y
yyy
ns
ns
ns
7.53yyy
14.54
ns
33.02yyy
3.90
ns
10.45
yyy
4.53yy
20.55
yyy
18.35yy
97.38yyy
Lateral
P600
yyy
–
–
ns
–
18.99
ns yyy
21.75yy
–
–
14.70
–
33.20
yyy
20.53yy
117.6yyy
Mid
y
ns
ns
ns
2.88***
3.15***
5.56***
7.54***
4.15
ns
4.91
y
3.14***
2.73**
ns
30.85yyy
Lateral
SW Mid
–
–
ns
–
3.90***
4.90***
ns
–
–
3.63***
–
8.10yy
ns
22.47yyy
Table 2. Within-Subjects Analysis of Variance for Experiment 1 (Unusual Test Views) and Experiment 2 (Canonical Test Views) and Omnibus Analysis of Variance across both Experiments
Schendan and Kutas
119
ns
4.33**
ns
ns
ns
ns
ns
ns
ns
ns
4.35
–
–
ns
–
–
ns
ns
ns
–
–
4.98
–
2.33**
6.24***
ns
ns
ns
ns
–
–
3.70***
–
–
ns
6.96***
8.13yy
–
–
ns
yy
7.87
yy
ns
4.40
ns
7.21
y
–
5.28y
6.58y ns
20.88yyy
27.50yyy
24.76yyy
31.17yyy
ns
ns
ns
ns
ns
ns
ns
ns
3.12
y
4.16**
6.94***
–
4.83yy
–
–
ns
–
–
ns
ns
ns
–
–
8.90
yy
8.58y
13.88yy
48.81yyy
6.72y
17.69yy
52.03yyy
yy
ns
ns
ns
ns
ns
ns
12.78yy
4.93***
3.42
ns
6.44
yy
8.87yyy
27.73yyy
39.15yyy
132.5yyy
yyy
–
–
ns
–
–
ns
11.34y
ns
ns
3.33***
ns
ns
3.11**
5.37***
12.00y
7.30y
yy
4.60
ns
8.07
yy
15.28yyy
28.82yyy
12.33yy
120.0yyy
–
–
15.09
–
38.02yyy
35.57yyy
117.2yyy
yyy
y
–
–
5.75
–
–
5.11***
15.12yy
–
–
14.41
–
45.95yyy
10.83y
112.2yyy
yyy
ns
–
–
ns
ns ns
–
–
ns
ns
4.71***
–
–
3.82***
–
10.30yyy
8.44yy
17.57yyy
ns
ns
ns
ns
4.86***
5.84
ns
5.60
yy
6.19yyy
4.53yy
8.41yy
32.93yyy
p = .05). Within experiments df: (1,33) for mean, F, and H effects, and lateral (11,363) and mid (3,99) for E effects of unusual test; (1,27) for mean, F, and H effects, and lateral (11,297) and mid (3,81) for E effects of Canonical test. No H effects were reliable. Epsilon values of reliable effects: P150 .24; P250 (Unusual: E .22, F £ E .31, F £ E £ H .54; mid E .8, F £ E .86; Canonical: F £ E £ H .48); N350 (Unusual: E .24, F £ E .24; mid E .71, F £ E .75; Canonical: E £ H .45); N400 (Unusual: E .24, F £ E .25, F £ E £ H .44; mid E .68, F £ E .68; Canonical: E .23, E £ H .32; mid E .63); LPC (Unusual: E .26, E £ H .43, F £ E .24, F £ E £ H .49; mid E .76, F £ E .62; Canonical: E .28, E £ H .34; mid E .56); SW (Unusual: E .28, E £ H .41, F £ E .27, F £ E £ H .41; mid E .72; Canonical: E .29, E £ H .34; mid E .61); Omnibus df: (1,54) for mean, T, F, and H effects, and lateral (11,594) and mid (3,162) for E effects. Epsilon values of reliable effects: P150 (.25; mid .76); P250 (E .28, F £ E .22, F £ E £ H .5; mid E .84, F £ E .67); N350 (E .27, F £ E .21, F £ E £ H .45; mid E .75, F £ E .59); N400 (E .23, F £ E .24, F £ E £ H .46; mid E .65, F £ E .68); P600 (E .26, E £ H .46, F £ E .25, F £ E £ H .41; mid E .65, F £ E .67).
T£F£E£H
T£F£H
T£F£E
T£E£H
T£H
T£E
T£F
T
F£E£H
F£H
F£E
2.25**
E£H
y
2.84***
E
y
8.71y
10.61y
F
ns
7.54y
9.19y
Mean
Omnibus
120
Journal of Cognitive Neuroscience
Volume 15, Number 1
ns
E£H
ns
ns
E
E£H
ns
6.41***
–
–
ns
–
ns
ns
ns
–
–
ns
–
5.00
ns
yy
12.76yy
Mid
yyy
ns
ns
ns
ns
ns
ns
9.06y
ns
ns
3.19**
3.71y
11.39
ns
45.17yyy
Lateral
P250
yy
–
–
ns
–
ns
ns
8.40***
–
–
ns
–
9.78
ns
41.85yyy
Mid
ns
ns
ns
3.00***
4.07***
ns
19.34yy
ns
ns
ns
5.59yy
9.02
yyy
3.60
*
63.40yyy
Lateral
N350
–
–
ns
–
3.10**
ns
20.79yyy
–
–
ns
–
yyy
14.12
4.20
**
56.43yyy
Mid
yyy
yyy
ns
ns
ns
5.06yy
20.68
ns
56.87yyy
ns
ns
3.43
***
9.54yyy
25.22
11.65
y
144.4yyy
Lateral
N400
y
yyy
–
–
ns
–
20.97
ns yyy
47.67yyy
–
–
5.79
–
45.14
14.45
yy
137.6yyy
Mid
yyy
ns
ns
ns
8.27yyy
17.29
ns
73.47yyy
ns
ns
2.73
**
15.05yyy
29.11
yyy
13.98
yy
100.5yyy
Lateral
P600
yyy
–
–
ns
–
26.88
yyy
5.03**
61.39yyy
–
–
4.97***
–
47.88
17.11
yy
96.64yyy
Mid
ns
ns
ns
ns
3.59***
ns
51.19yyy
ns
ns
ns
9.04yyy
5.51
y
4.50**
10.65y
Lateral
SW
–
–
ns
–
8.04yy
ns
31.18yyy
–
–
ns
–
9.97yy
ns
4.49**
Mid
p = .05). df: (1,54) for mean, T, and H, and lateral (11,594) and mid (3,162) for E. No H effects were reliable. Epsilon values of reliable effects: P150 (Same – New: E .24; mid E .71); P250 (Same – New: E .25; mid E .81); N350 (Same – New: E .25, E £ H .4; mid E .73; Different – New: E .25, E £ H .51; mid E .69); N400 (Same – New: E .23, E £ H .34; mid E .65; Different – New: E .24, E £ H .5; mid E .66); LPC (Same – New: E .23, E £ H .39; mid E .6; Different – New: E .30, E £ H .56; mid E .75); SW (Same – New: E .26, E £ H .38; mid E .68; Different – New: E .3; mid E .71).
T£E£H
T£H
ns
ns
T
T£E
ns
ns
ns
Mean
Different – New
T£E£H
T£H
ns
5.31
E
T£E
ns
T
y
15.33yy
Lateral
Mean
Same – New
Source
P150
Table 3. Analysis of Variance Between Experiments Contrasting Repetition Effects (Studied –New) for Same or Different Conditions Between Tests
Schendan and Kutas
121
Lateral
Mid
Lateral
P250
ns
ns
E
E£H
ns
ns
–
–
ns
–
ns
ns
5.32*
ns
ns
5.43***
ns
8.62 yy
4.63*
35.44yy
2.68*
ns
E
E£H
ns
ns
–
–
ns
–
ns
4.22*
6.11**
ns
ns
ns
ns
ns
4.62*
15.19y
–
–
ns
–
ns
ns
13.92y
–
–
4.58**
–
6.12
ns
ns
ns
4.25***
3.96**
ns
30.52yy
ns
4.20*
6.27 y
3.65***
y
8.48 y
8.72***
5.23*
48.24yy
Lateral
N350
–
–
ns
–
4.64**
ns
27.96yy
–
y
ns
ns
–
–
ns
–
7.15yy ns
27.54yy
ns
57.78yy
–
–
8.25
–
34.34
21.39yy
ns
64.67yy
ns
ns
5.11***
6.53*** –
7.14yy
22.78 yy
29.31yy
26.38yy yy
129.3yy
Mid
141.7yy
Lateral
–
8.43 y
8.86***
47.59yy
Mid
N400
ns
ns
ns
10.91yy
16.66yy
ns
65.55yy
2.66**
ns
4.23**
11.81yy
30.46 yy
22.98yy
111.1yy
Lateral
P600
y
–
–
ns
–
28.04yy
ns
52.55yy
–
–
8.61
–
47.26
yy
28.86yy
115.7yy
Mid
ns
ns
3.58**
3.98***
2.71*
10.17***
19.16y
3.02**
ns
ns
6.10yy
5.07***
ns
32.38yy
Lateral
SW
–
–
ns
–
6.48***
9.22***
10.01***
–
–
ns
–
10.88yy
ns
18.81y
Mid
p < .0001.
yy
p < .001.
y
***p < .005.
**p < .02.
*p < .05.
Mean of old – new difference waves captures each repetition effect. Electrode site (E) factor reveals variation in repetition effects across the scalp. T = test view across format; H = hemisphere; Mid = midline ANOVA; – = not applicable; ns = not significant ( p > .05). df: (1,54) for mean, T, and H, and lateral (11,594) and mid (3,162) for E. No main effects of H were reliable. Epsilon values of reliable effects: P150 (II: E .25; mid E .76); P250 (I: E .26; mid E .83); N350 (I: E .26, E £ H .48; mid E .69; II: E .25, E £ H .41; mid E .71); N400 (I: E .22, E £ H .41; mid E .61; II: E .26, E £ H .36; mid E .72); LPC (I: E .25, E £ H .51; mid E .61; II: E .27, E £ H .37; mid E .7); SW (I: E .27, E £ H .46; mid E .66; II: E .28, E £ H .36; mid E .73).
T£E£H
T£H
ns
6.38**
T
T£E
8.11**
Mean
Mid
32.17yy
II. Same – New Canonical versus Different – New Unusual
T£E£H
T£H
ns
ns
T
T£E
5.94**
Mean
I. Same – New Unusual versus Different – New Canonical
Source
P150
Table 4. Analysis of Variance Between Experiments Contrasting Repetition Effects (Studied – New) Across Formats (Same, Different) and Test Views (Unusual, Canonical)
Figure 7. Grand average difference waves (studied – new; nonnormalized) to objects from canonical and unusual views during the indirect memory test from ¡150 to 850 msec. Initially, P150 and N350 repetition effects have an anterior distribution. Next, N400 and P600 (LPC) repetition effects have a posterior distribution, and the latest repetition effect (SW ) has a broad centro-anterior distribution. N350 and N400 repetition effects are largest to Same Unusual than other conditions that resemble each other. P600 repetition effects are largest for Same Unusual views, intermediate for Different Unusual and Same Canonical views, and smallest for Different Canonical views. SW repetition effects are larger for Different than Same conditions. Geodesic montage (bottom right) shows ERP recording sites over the head; note, sites 6 and 26 correspond to traditional 10 – 20 sites, Oz and Cz, respectively.
Same conditions (Figures 4, 5, 7, and 9). ANOVAs within each experiment and in the omnibus analysis revealed that the repetition and format effects on the SW were reliable or marginal and varied across the head (Table 2; note also format main effects, Unusual mid: F = 3.54, p = .0706; Canonical: ps < .05. Pairwise contrasts between test views provided further support. While late repetition effects were still larger on Same Unusual than Same Canonical trials, they were not distinguishable between the two different conditions (Table 3). Across formats and test views (Table 4), repetition effects were larger on Different Canonical than Same Unusual trials and on Different Unusual trials than Same Canonical ones. The shapes of the scalp distributions differed between Different and Same conditions. The omnibus ANOVA had a reliable Format £ Site interaction, F = 3.31, p < .005, e = .21; the contrast of Different Unusual and Same Canonical trials 122
Journal of Cognitive Neuroscience
showed a marginal Trial Type £ Site interaction, F = 2.50, p < .05, e = .2. Frontal, Central, and Posterior Scalp Distributions As the ERPs overlapped temporally, each was isolated spatially using within-experiment ANOVAs on subsets of frontal (2, 10; 11, 20; 12, 19; 3, 9), central (21, 25; 13,18; 22, 24; 4, 8), and posterior (14, 17; T5, T6; 15,16; 5, 7) lateral sites (alpha = .0133 for P150, N350, N400, LPC; alpha = .0033 for P250, SW; see Table 5). P150 and N350 effects. These effects showed reliable or marginal main effects of repetition and format during the P150, P250, and N350 (and extending into the N400 time) over fronto-central sites. Crucially, frontal format effects occurred with both test views. In contrast at these times, posterior sites showed only main effects of site and Format £ Site interactions. Volume 15, Number 1
LPC effects. For LPC effects (N400 and P600), a centroposterior distribution was indicated. For Unusual test views, reliable main effects of format interacted with site only at posterior and central sites at the P600 time. For Canonical views, repetition effects were reliable at only central and posterior sites; note, Format £ Site £ Hemisphere interactions supported N400 and P600 format effects at central sites, Fs(3,81) > 5.4, ps < .03, e s > .52 (Figure 7). SW effects. For the SW, repetition and format effects showed a broad distribution, but a left anterior bias was suggested by a marginal Format £ Frontal Site £ Hemisphere interaction, Unusual: F(3,99) = 3.16, p < .03, e = .97. Time Course of Repetition and Format Effects As some view-dependent accounts of identification predict that perceptual categorization precedes view compensation, which in turn preced es object model
selection, we evaluated the temporal course of format effects. These analyses were conducted on raw and normalized difference ERPs with an added factor of time; here, we report only time effects. Raw difference ERPs. An omnibus ANOVA (six levels of time) indicated that repetition and format effects and their scalp distributions changed over time. Main effects of time were reliable, F(5,270) = 26, e = .65, mid F(5,270) = 20, e = .45, and interacted with site, F(55,2970) = 20, e = .1445, mid F(15,810) = 17, e = .25, and Site £ Hemisphere, F(55,2970) = 5.06, e = .16 ( ps < .0001). Time £ Format interactions were reliable, F(5,270) = 26, e = .81, mid F(5,270) = 18, e = .51, and interacted with site, F(55,2970) = 13, e = .13, mid F(15,810) = 7.86, e = .33 (ps < .0001), hemisphere, F(10,540) = 3.3, p < .02, e = .72, and Site £ Hemisphere, F(55,2970) = 2.77, p = .0002, e = .29. Test-view effects also varied over time. Time interacted with test view, F(5,270) = 4.93, mid F(10,540) = 8.26, which interacted also with site, mid F(15,810) = 4.87, ps < .005. Time £
Figure 8. Line graph of grand average difference waves (studied – new) during the indirect memory test showing the N400 from 450 to 500 msec. Repetition reduced the amplitude of posterior negativity. N400 repetition effects were larger and differed in scalp distribution shape between Same Unusual relative to other conditions. To illustrate this, current source density (CSD) maps showing relatively focal, current sources (positive values) and sinks (negative values) across the head were calculated from the normalized voltages of difference ERPs (Same – New) from 450 to 500 msec (Ganis, Kutas, & Sereno, 1995); recording sites are marked with schematic electrodes; note, maps for Different conditions are not shown since their distributions were comparable to the Same Canonical condition. N400 repetition effects to Same Unusual views mark memory for the contribution of mental rotation operations to identification of unusual views.
Schendan and Kutas
123
Figure 9. Grand average difference waves (studied – new) to objects from canonical and unusual views during the indirect memory test from ¡150 to 850 msec see geodesic montage on Figures 4, 5, or 7 (for electrode sites). After 700 msec, SW repetition effects were larger for different than same conditions. Repetition effects during the SW were maximal over right parietal locations in different but not same conditions, consistent with scalp distribution shape differences between Same and Different trials. To illustrate this, CSD maps show relatively focal, current sources (positive values) and sinks (negative values) across the head and were calculated from the normalized voltages of difference ERPs (Same – New) from 750 to 800 msec (Ganis et al., 1995); recording sites are marked with schematic electrodes.
Format £ Test View interactions were reliable, Fs(5,270) > 4, ps < .005, and interacted with site, F(55,2970) = 2.78, p = .0078, mid F(15,810) = 3.87, p < .005, and hemisphere, F(5,270) = 3.7, p < .01. Contrasts between pairs of consecutive epochs (alpha = .01, time source of variance) suggested more functional distinctions. P150 VERSUS P250 . Main effects of time were reliable, Fs(1,54) > 17, ps = .0001, interacting marginally with format, Fs > 5, ps < .05. Time £ Format interacted with Site £ Hemisphere, F(11,594) = 3.2, e = .49, test view, Fs(1,54) > 10, ps < .005, and Test View £ Site, 124
Journal of Cognitive Neuroscience
F(55,2970) = 7.05, e = .29, mid F(15,810) = 6.61, e = .77 ( ps < .0005). P250 VERSUS N350 . Main effects of time were reliable, Fs > 8.6, and interacted with site, F(11,594) = 9.35, e = .33, mid F(3,162) = 6.2, e = .82 ( ps < .005). N350 VERSUS N400. Reliable main effects of time, Fs > 39, interacted with site, F = 32, e = .19, mid F = 39, e = .64 ( ps < .0001), and Site £ Hemisphere, F(11,594) = 4.76, p < .005, e = .34. Time £ Format interactions were reliable, Fs > 12, and interacted with site, F(11,594) = 5.98, e = .22, mid F(3,162) = 6.03, e = .67, Site £ Volume 15, Number 1
Schendan and Kutas
125
ns
ns
E
F£E
y
6.20
19.94yy
15.56yy
ns
6.24y
5.56***
E
F£E
12.46yy
28.85yy
6.65
**
31.68yy
21.20yy
50.00yy
35.65yy
108.9yy
14.74yy
23.45yy
47.50yy
89.33yy
6.60y
4.67***
29.20yy
34.37yy
150.9yy
9.11yy
18.44yy
20.75y
4.86***
7.30y
ns
31.00yy
ns
5.95***
3.23** 4.47**
ns
10.26***
ns
ns
ns
13.15y
ns
ns
ns
15.23y
P250
ns
ns
ns
ns
3.73** 6.50y
5.28**
6.31**
ns
ns
8.74
***
9.31***
P150
ns
30.05yy
3.83**
4.25**
91.67yy
ns
4.59
**
15.02y
SW
6.66y
ns
26.26yy
P600
4.93***
6.97***
ns
18.30y
ns
ns
ns
15.11y
ns
ns
4.76
**
11.53y
N350
ns
5.09***
ns
52.35yy
ns
4.03**
ns
35.13yy
ns
6.45y
5.25
**
13.46y
N400
Canonical Test Views
ns
ns
ns
56.31yy
ns
7.64y
ns
30.64yy
ns
8.30y
ns
ns
P600
4.67***
4.48**
4.84**
11.09y
ns
4.21**
4.87**
8.45***
ns
4.07**
4.68**
ns
SW
p < .0001.
yy
p < .0033.
y
***p < .0133.
**p < .05.
*p = .0678.
Mean of old – new difference waves captures each repetition effect. Electrode site (E) factor reveals variation in repetition effects across lateral scalp locations. F = format (i.e., Same – New vs. Different – New); H = hemisphere; ns = not significant ( p > .05). df: (1,33) for mean, F, and H, and (3,99) for E and F £ E of Unusual test; (1,27) for mean, F, and H, and (3,81) for E of Canonical test. H or E £ H effects are not reported, as they were not relevant here and are covered in other analyses. Epsilon values of reliable effects: P150 (Unusual: E .67; Canonical: E .76); P250 (Unusual: central: E .61, F £ E .72; posterior E .61, F £ E .55; Canonical E .78); N350 (Unusual: frontal E .86; central E .65, F £ E .72; posterior E . 55, F £ E .57; Canonical: posterior E .7902, F £ E .72); N400 (Unusual: frontal E .88, F £ E .868, central E .67, F £ E .73, posterior E .56, F £ E .68; Canonical: frontal E .75, central E .67, posterior E .67); LPC (Unusual: frontal E .84, F £ E .75, central E .71, F £ E .85, posterior E .66, F £ E .57; Canonical: frontal E .88., central E .6); SW (Unusual: frontal F £ E .75, central E .59, F £ E .69, posterior E .64, F £ E .6; Canonical: frontal E .81, central E .56, posterior E .63, F £ E .8).
**
F
7.03***
ns
Mean
Posterior
7.33y
ns
F£E
11.43yy
ns
E
18.97y 11.45y
20.58y
4.27**
F
39.63yy
ns
16.39yy
4.48***
30.13yy 27.18yy
yy
N400
14.64y
29.10
N350
6.66y
19.96y
3.56*
ns
ns
22.03yy
20.37
P250
Mean
Central
4.59
**
4.76**
P150
F
Mean
Frontal
Source
Unusual Test Views
Table 5. Within-Subjects Analysis of Variance for Experiment 1 (Unusual Test Views) and Experiment 2 (Canonical Test Views) on Subsets of Frontal, Central, or Posterior Lateral Scalp Sites
Hemisphere, F = 4.07, e = .4, and hemisphere, F(1,54) = 14 (ps < .005). Marginal Time £ Test View interactions, F(1,54) = 2.99, p < .09, mid F(1,54) = 4.47, p < .05, interacted marginally with format (Fs > 6), mid site, and Format £ Site, Fs(15,810) > 3.2 ( ps < .05). N400 VERSUS P600. Time interacted with site, F = 4.39, p < .01, e = .23, Site £ Hemisphere, F = 4.43, e = .37, format, Fs > 10 ( ps < .002), and Format £ Site, F = 17, e = .18, mid F = 11, e = .53 ( ps < .0001). P600 VERSUS SW. Reliable main effects of time, Fs > 39, interacted with site, F = 32, e = .23, mid F = 27, e = .78 ( ps < .0001), hemisphere, F(1,54) = 10, Site £ Hemisphere, F = 4.86, e = .42, and format, Fs > 75 ( ps < .005). Time £ Format interacted reliably with site, F = 12, e = .24, mid F = 15, e = .74 ( ps < .0001), marginally with hemisphere, F = 5.49, and Site £ Hemisphere, F = 2.61, e = .47 ( ps < .05). Time £ Format £ Test View interactions were marginal, Fs > 4.3, ps < .05. Normalized difference ERPs. Changes in the shapes of the scalp distributions across time can help further demarcate each process. The omnibus ANOVA of all ERP components showed no reliable Time £ Site interactions. However, contrasts on consecutive time epochs suggested that, depending upon the test view, the scalp distribution shapes of format effects differed for the P150 versus P250, Time £ Format £ Test View £ Site, F(27,1458) = 3.52, p < .005, e = .21, and marginally for the N350 versus N400 times, F = 2.04, p < .08, e = .18, and of repetition effects differed for the P600 versus SW, Time £ Test View £ Site, F(27,1458) = 3.72, p < .005, e = .22. In addition, contrasts between time periods for each of the four trial types (alpha = .005, Format £ Test View £ Time source of variance) further indicated that neural generators of repetition effects at P150 and N350 times were similar, except on Same Unusual trials, Time £ Site, F(27,729) = 3.29, p < .005, e = .22. Generators of effects at N350, N400, and P600 times also seemed distinct from each other on all trials, except the Different Canonical ones; the other three trial types showed Time £ Site interactions that were reliable between N350 versus N400, Fs > 3.9, ps < .0025, and N400 versus P600 times with Unusual test views, Same: F = 5.96, Different: F = 3.68 (e s = .2, ps < .005) and marginal with Canonical ones, Same: F = 3.14 (ps < .02, e = .14). Finally, engaged generators seemed distinct when comparing P600 and SW epochs on all trials, Time £ Site, Fs > 5, ps < .0005, e s < .2392. Overall, based on a standard interpretation of reliable electrode interactions following vector normalization of ERP amplitudes, these findings implicate distinct neural generators for the N350, LPC, and SW effects on most trials, as well as for the N400 and P600 with Unusual test views.
electrode (Picton et al., 2000). The latency at which 15 or more consecutive points first differed reliably from zero (alpha = .05) was taken as the onset time. Onset latency of repetition effects (Same – New waves) was estimated at ¹188 msec for Unusual test views (central 19, 23, 24, 26; df = 1,33) and ¹164 msec for Canonical ones (anterior 9, 19, 20, 25; df = 1,27). Onset of format effects (Same – Different waves) was estimated at ¹212 msec for Unusual test views (site 3) and ¹160 msec for Canonical ones
Onset Latency
Figure 10. Grand average ERPs during the study phase of Experiment 1 (Unusual test views) and Experiment 2 (Canonical test views) shown from ¡150 to 850 msec. In both experiments, canonical views show more positivity at all times after 160 msec than unusual views.
Onset latency was estimated using a series of point-bypoint F tests (List factor) on difference ERPs at each 126
Journal of Cognitive Neuroscience
Volume 15, Number 1
(site 9). An omnibus ANOVA across-experiments (df = 1,63) estimated the onset of effects of repetition at ¹148 msec (central 18) and format at ¹172 msec (site 9). We also assessed onset time for the LPC and SW effects at sites with minimal overlap. Format effects with Unusual test views, diagnostic of view compensation, estimated the LPC onset at ¹356 msec (T5). The SW onset for Different – New Unusual waves was estimated at ¹540 msec (site 2). Study Phase To assess whether repetition effects reflect processing differences at study, study phase data were analyzed with a within-person view factor (Unusual, Canonical). ERPs were more positive to Canonical than Unusual views from 140 to 700 msec (Figure 10). Main view effects were reliable in Experiment 1 (Unusual) for the P150 at mid sites, F(1,33) = 4.72, p = .037; at all sites for the P250, Fs > 18, ps < .001, for N350, Fs > 19, ps < .001, N400: Fs > 29, ps < .001, P600: Fs > 16, ps < .001. They were reliable in Experiment 2 (Canonical) for the P150 at mid sites, F(1,27) = 6.52, p = .0167, and all sites for the P250, Fs > 20, ps < .001, N350 Fs > 19, ps < .001, N400 Fs > 13, ps < .002 [note, P600: Fs > 3.4, ps < .08; Format £ Site for P600: F(11,297) = 5.04, mid F(3,81) = 5.31, ps < .01; and SW, mid F = 4.15, p = .022].
DISCUSSION In this study, findings from two ERP experiments are used to delineate the time course of model selection and view compensation processes during an indirect memory test wherein people identified old and new objects. The patterns of repetition effects predicted by applying the TAP memory account to each process and representational system postulated by various visual object identification accounts is illustrated in Figure 2. Overall, the form-specificity and test-view dependence (Canonical vs. Unusual) of the ERP repetition effects we observed are most consistent with view-dependent accounts of object identification. When, and under which viewing conditions, is memory for objects form-specific? Our results indicate it is throughout higher-order visual processing. Thus, fully view-invariant accounts, which predict equivalent repetition effects on all trials, that is, no form specificity, given that the same object model is always selected and corresponding memories are reactivated, find no support from our data. Nor do other identification accounts predicting no form specificity because the same process or representation is activated in all conditions. Next, we discuss this and other identification issues in detail for each of our ERP repetition effects, focusing on effects starting within 200 – 300 msec, as these are most likely to reflect the effect of prior exposure on perceptual processes.
Object Memory Representations and Processes Specified in Identification Accounts Memory We found reliable early repetition effects: By 148 msec, the vertex P150 is more positive for studied than new objects. These P150 effects precede the earliest times reported to date for repetition effects in indirect memory tests, including modulations of a P2(00) to words ( Van Petten et al., 1991) and faces, 190 – 250 msec (George, Jemel, Fiori, & Renault, 1997); they are later only than repetition effects to word stems, 60/100 – 135/ 200 msec (Badgaiyan & Posner, 1997). Around the same time, the P150 also marks the earliest known formspecific effect of memory. Thus, at its outset, object memory appears to rely upon the similarity between past and present experiences, in this case, study and test percepts; although a repetition modulation of the P150 is present for different views of the same object, it is smaller than for the same views. Between 250 and 700 msec, ERPs are also more positive to repeated than new objects, and these effects are form-specific. These intermediate-latency format effects, however, are test-view dependent, being larger for Unusual than Canonical views, suggesting a functional dissociation from the earlier P150 effects. At intermediate processing times, differences between trial types implicate somewhat distinct memory processes. Specifically, repetition effects on Same Unusual trials differ in size and scalp distribution shape (i.e., neural generators) from other trials: Different Unusual ones from 250 to 700 msec, Different Canonical trials from 300 to 700 msec, and Same Canonical ones from 400 to 700 msec. This may indicate one brain system for memory of Same Unusual views and a different system for all other studied objects. Alternatively, a common brain system may have subregions that are activated differentially by Same Unusual than other trial types. Regardless, the intermediate time window seems to encompass at least two somewhat distinct memory processes: Different patterns of repetition and format effects between the frontal N350 (250 – 400 msec) and the posterior LPC (400 – 700) suggest a functional dissociation between these two processing times, while differences in the shapes of the scalp distributions of these two effects point to a neuroanatomical dissociation, as well. Object Model Selection We hypothesize that frontal N350 repetition effects index memory in a neural network for object model selection. A frontal N350 marks the first ERP divergence with identification success, being larger for unidentified than identified objects, and is sensitive to the recoverability of object structure (Schendan & Kutas, 2002; Doninger et al., 2000). Similarly, in the study phase of our experiments, the N350 is larger for views that are Schendan and Kutas
127
harder to identify (unusual) relative to easier canonical views. N350 reduction has been taken to reflect the pruning of the candidate object representations down to the one(s) matching the percept. Research on a related N300 suggests that frontal negativity may also index neural networks involved in representing conceptual relationships between objects (McPherson & Holcomb, 1999), consistent with convergence zones between structural and conceptual knowledge (Damasio, Grabowski, Tranel, Hichwa, & Damasio, 1996). The N350 is thought to be generated in the lateral occipital complex (LOC; Schendan & Kutas, 2002; Doninger et al., 2000). Like other object-related cortices (and the N350), LOC is differentially responsive to real objects versus unidentifiable or unidentified images and its activity is associated with identification accuracy (Grill-Spector, Kushnir, Hendler, & Malach, 2000) and object priming (Buckner et al., 1998). The frontal N350 effects seem to begin simultaneously with those on the P150. For the most part, we find no clear scalp distribution evidence that they are neuroanatomically dissociable (caveat, null scalp distribution results may reflect merely the proximity of both neural generators and the limited spatial resolution of ERPs); thus, we will refer to them together as N350 effects. N350 repetition effects are, however, functionally dissociable between P150 and N350 times; while initially (140 – 250 msec) format effects do not vary with test view, later on (250 – 500 msec), they are larger for Unusual than Canonical ones. Similarly, view-specificity effects have been found to be greater in more posterior than anterior object-related cortices (Grill-Spector et al., 1999). We suggest that initial N350 effects reflect an early perceptual process (Ullman, 1996) or representational function (Humphreys & Bruce, 1989) in a more posterior model selection network that categorizes images into broad classes of visually similar objects and has been proposed to facilitate subsequent identification operations in more anterior object-related cortices. A view-specific activation pattern in LOC has been taken as evidence against fully view-invariant accounts that postulate representations of whole 3-D object structures (Vuilleumier, Henson, Driver, & Dolan, 2002; Grill-Spector et al., 1999). We similarly take the form specificity of the N350 effects to be most compatible with view-dependent or partial view-invariant accounts, according to which repetition effects should be large in Same conditions but absent or smaller in Different ones (see Figure 2): This is what we observe. In particular (Figure 2), on a view-dependent account, memory does not transfer on Different trials because distinct view representations (canonical vs. unusual) are selected during study versus test phases. Model selection utilizes two layer(s): (i) In a ‘‘multiple individual 2-D views’’ network, all views reside separately—no TAP. (ii) In a ‘‘linked 2-D views’’ network, sets of views are 128
Journal of Cognitive Neuroscience
linked together into whole object representations ( Weinshall, Edelman, & Bu ¨ lthoff, 1990), predicting the same results as in fully invariant accounts. Partial viewinvariant accounts offer other reasons for the reduced object constancy on Different relative to Same trials. (a) The viewpoints at study and at test have different sets of parts or features. A ‘‘recognition-by-components’’ variant (Biederman, 1987) posits two distinct processes: Initial differences between Same and Different conditions reflect activation of intermediate representations of object parts in terms of 3-D volumetric primitives (‘‘geons’’); these are followed by similarity between conditions when fully invariant processes match the percept to the same higher order model, specifying the global spatial configuration of geons for that particular object class. (b) Separate brain pathways analyze the study and test views. A two-visual stream version (Turnbull et al., 1997) also postulates two processes: Canonical views are matched to view-invariant object representations in the ventral stream, whereas unusual views are matched to view-dependent representations in the dorsal stream. This makes the further prediction that scalp distribution shapes should differ between Same Canonical trials (ventral stream effects) and the other trials wherein same unusual views activate other (dorsal) representations, and both Different trials activate representations in different visual streams at study versus at test (i.e., no TAP). We find no such evidence. (c) Finally, a neuronal account maintains that the 2-D view tolerance of neurons cannot accommodate the large angular disparity separating canonical and unusual views (Perrett et al., 1998). Which of these best explains the ERP repetition effects over time depends, at least in part, on whether any of the effects is consistent with view compensation. View Compensation In fact, the pattern of repetition effects on the posterior LPC (N400, P600) is consistent with a multiple-viewsplus-transformation variant of view-dependent accounts. This version hypothesizes that view compensation co-opts processes used to perform mental rotation tasks (Tarr & Pinker, 1989). In these tasks, people are shown two objects, one is rotated relative to the other, and asked to decide if they are the same or mirror images; the time to perform the task scales with the angular disparity between the objects. ERP studies of mental rotation have described a late (420 – 800 msec) parietal negativity, peaking around 500 msec, that is larger for images that need to be rotated than ones that do not. The amplitude of this negativity grows systematically with increasing rotation angle (Bajric et al., 1999; Heil, Bajric, Rosler, & Hennighausen, 1996; Ruchkin, Johnson, Canoune, & Ritter, 1991; Rosler, Schumacher, & Sojka, 1990; Peronnet & Farah, 1989; Wijers, Otten, Feenstra, Mulder, & Mulder, 1989). Similarly, our study phase ERPs show a Volume 15, Number 1
parietal negativity at post-400 msec that is larger for unusual views that entail mental rotation than for canonical views that should not. Our memory test findings are also consistent with the idea that this negativity is associated with mental rotation. Consider that repetition priming has been hypothesized to result from enhanced processing fluency, and the biological correlate of this is thought to be faster neuronal computation and reduced requirements for neural resources (Schacter & Buckner, 1998; Squire, 1994). As the parietal negativity increases in amplitude with larger rotations, a repetition-based reduction in the neural resources needed for rotation should correspond to reduced negativity. Moreover, this reduction should be greatest on Same Unusual trials where both study and test views are rotated (Figure 2); according to TAP, it is only on these trials that an extra process of view compensation is recruited and encoded during study and so could then be reactivated when the same unusual view appears at test. We find that repetition modulates the LPC in the direction expected for mental rotation. Memory test ERPs show the least negativity (i.e., largest LPC) to Same Unusual relative to all other trial types for which view compensation processing has not been encoded and/or does not need to be retrieved. In addition, our finding of differences in scalp distribution shape between LPC repetition effects to Same Unusual trials versus the other trial types is compatible with somewhat separate neural systems for view compensation and model selection. A current source appears over midline parietal scalp locations only on Same Unusual trials (Figure 8). Other studies have implicated parietal cortex in the identification of unusual views (Sugio et al., 1999; Turnbull et al., 1997; Kosslyn et al., 1994; Warrington & Taylor, 1973) and mental rotation (Harris et al., 2000; Cohen et al., 1996). Model Selection and View Compensation We also used the timing and pattern of ERP repetition effects to evaluate the hypothesis that view compensation precedes model selection. To the contrary, our results not only would indicate that the time course of these two processes overlap, but also that model selection (148 – 250 or 400 msec) may instead precede view compensation (250 – 356 msec) by ¹100 msec or so. Specifically, frontal N350 effects, presumably indexing model selection, begin within 148 – 250 and end at ¹500 msec for Canonical test views but last until ¹700 msec for Unusual ones, consistent with reports of longer identification RTs for Unusual than Canonical views. Mental rotation studies suggest that this process is active at ¹420 – 800 msec, and our LPC repetition effects similarly estimate view compensation at ¹356 – 700 msec. The pattern of results from 250 – 400 msec, however, also largely conforms to that predicted for
view compensation (Figure 2), thereby raising the possibility that it starts even earlier. Temporally overlapping, view compensation and model selection processes run counter to most viewdependent accounts but favor counterstream variants hypothesizing concurrent and parallel processes, wherein view compensation operates iteratively on both model(s) and percept until they are mutually aligned and an appropriate model has been selected (Ullman, 1996). In this framework, Same Unusual trials yield the largest memory effects due to view compensation. We speculate that dorsal stream areas contain view-dependent object representations and are involved in the transformation of ventral (or dorsal) structural descriptions largely in parallel with the model selection process. This is consistent with reports of object-related areas in the human intraparietal sulcus (Grill-Spector et al., 2000) and of shape selectivity, comparable to that along the ventral stream, in monkey parietal lobe (Sereno & Maunsell, 1998). Object memory representations and processes not specified in identification accounts secondary identification-related processes. We propose further that the posterior LPC repetition effects also reflect the influence of memory on secondary identification functions. Identification success with a variety of visual images is associated with LPC enhancement by 550 msec, while only well-specified images, such as those used herein, also modulate the frontal N350 (Schendan & Kutas, 2002; Doninger et al., 2000; Pietrowsky et al., 1996; Stuss et al., 1992). LPC identification effects have been proposed to index late inferential procedures for re-analyzing impoverished images and determining object identity, perceptual closure, and processes enabling naming and perhaps also awareness of object identity (Schendan & Kutas, 2002; Stuss, Sarazin, Leech, & Picton, 1983). As unusual views may be expected to recruit more strongly some of these functions, an explanation based on late identification processes is an alternative to the mental rotation account, but these accounts are not mutually exclusive. View frequency. We also cannot discount the possibility that test-view effects may reflect viewpoint typicality influences on object memory, analogous to word-frequency effects on priming (Kirsner, Speelman, & Schofield, 1993). Srinivas (1993), for example, interpreted the greater priming to the same unusual than canonical views as a frequency effect, given that canonical views are naturally more common. It is tempting to attribute the LPC effects to view frequency since N400 and P600 amplitudes are known to be modulated by word frequency (Van Petten et al., 1991; Rugg, 1990), and some of our ERP effects mirror these. Relative to frequent words, infrequent ones elicit larger N400s when read out of context early in sentences or lists, like our objects. Word frequency can also interact with repetition within Schendan and Kutas
129
an experiment. Repeated infrequent words show smaller N400s and larger P600s (i.e., more positivity) than unrepeated ones, and the P600 repetition effects are smaller for frequent words. Our findings refute, however, a simple frequency explanation. The LPC between canonical and unusual views in the study phase reveals baseline differences (frequency independent of repetition) that are much smaller than the LPC repetition effect between these views in the test phase. Factors other than just frequency must thus be implicated in memory effects. Frequency also cannot readily explain scalp distribution differences between Same Unusual and other trial types. In any case, we believe that frequency has no explanatory power per se. Rather, frequency effects are a symptom of the cumulative consequences of lifetime exposure on neural representations, indexing the degree to which the statistical regularities of the input are stored therein (Schendan et al., 1998).
Nolde, 1997; Wilding & Rugg, 1996). Our SW effects, however, start earlier and do not show this asymmetry. Instead, they resemble in scalp distribution, polarity, and timing, ERP effects of immediate repetition priming that were linked to the organization of related items in working memory (WM) (Schendan, Kanwisher, & Kutas, 1997). Thus, these SW repetition effects likewise may reflect the organization of perceived and remembered items in WM, perhaps marking its initial contribution to a processing cascade ultimately associating multiple object views in long term-memory (Bu ¨ lthoff et al., 1995). WM may participate in the comparison and computation of structural relations between a perceived view and a remembered different view. Finally, SW effects may reflect activity in the left middle frontal gyrus (BA 9/46), which is greater for recognized objects that are rotated from a studied view than in the same view (Schacter et al., 1997).
Different View Memory
Time Course of Visual Identification and Memory for Objects
Despite evidence earlier in the ERP waveform for worse or at best equivalent memory for Different than Same views, late repetition effects on the SW (¹700 msec) reveal a memory process that is recruited more strongly by Different than Same views. Late right frontal repetition effects have been linked to direct memory retrieval (e.g., Paller & Gross, 1998; Du ¨ zel, Yonelinas, Mangun, Heinze, & Tulving, 1997; Johnson, Kounios, &
In the present study, we used the sequence of ERP repetition effects to delineate the time course of visual object identification and memory functions (see Figure 11). We defined identification processes in terms of a set of functionally distinct ERP memory effects based on their unique patterns of form-specificity and test-view dependence. Further, based on the different shapes of the scalp distributions of the various repetition effects,
Figure 11. Hypothetical time course of activation of visual object identification and memory functions. Gray scale gradients are used to indicate start and end times estimated from the ERP time course of repetition and format effects. Top two gradients correspond to the memory functions; bottom four gradients correspond to the identification functions. Middle row of schematic heads depicts the corresponding ERP effect(s) and their scalp distribution in 100-msec time windows. In sum, between 148 – 250 and 500 – 700 msec (frontal N350), the appropriate stored object model is selected from long-term memory and matched to an incoming percept. Between 250 – 356 and 700 msec (posterior negativity; N400/LPC), procedures for view compensation, presumably by mental rotation, enable the identification of unusual views. These neural networks may comprise perceptual representation systems supporting implicit memory. By 500 msec, secondary identificationrelated procedures (P600/LPC), perhaps involving top-down processes, assist in the final selection (confirmation, or disconfirmation and reselection) of the correct object model and name retrieval. Around this time, the studied object may also be consciously recollected from explicit memory (LPC), perhaps further evaluating its identity. Finally, by 540 – 700 msec, if the remembered and currently perceived views differ, a late memory process (SW ) is recruited more strongly than if the views are the same; we propose that this process may contribute ultimately to the associative encoding of different views of an object.
130
Journal of Cognitive Neuroscience
Volume 15, Number 1
we suggest that (a) multiple brain systems support N350, N400, P600, and SW repetition effects for Same Unusual views, (b) at least three neural networks (indexed by N350, LPC, and SW) may support repetition effects on Different Unusual and Same Canonical trials, and (c) perhaps as few as two neural systems support repetition on Different Canonical trials, one from 140 to 700 msec and another during the SW. Multiple memory systems thus seem to contribute to identification and memory behaviors in various ways and at different times. In contrast to unidimensional performance indices, the time course of ERP effects provides direct evidence that the form specificity of behavioral priming is not a singular phenomenon, but rather the cumulative outcome of various degrees of form specificity across functionally distinct neural networks activated over the course of an object’s identification. Our ERP memory findings can be understood not just within the framework of the single memory process (TAP) account used to predict the ERP results but also within multiple systems accounts. On these, an explicit memory system supporting conscious recognition and recall depends on intact medical temporal lobe structures, although ultimate episodic storage and retrieval may also utilize cortical areas for perceptual and conceptual processing (Squire, 1994; Warrington & Weiskrantz, 1970; Milner, Corkin, & Teuber, 1968). In contrast, an implicit memory system supporting object priming depends on perceptual and conceptual systems in posterior neocortical regions different from those serving explicit memory (Buckner et al., 1998; Fleischman, Vaidya, Lange, & Gabrieli, 1997; Keane, Gabrieli, Mapstone, Johnson, & Corkin, 1995; Park & Gabrieli, 1995). By one version, various perceptual representation systems (PRSs) underlie distinct types of perceptual priming (Tulving & Schacter, 1990). For instance, object priming relies on a structural description PRS (Schacter et al., 1995). In this framework, our frontal N350 findings suggest recruitment of a structural description PRS by ¹148 – 250 msec; the posterior negativity (N400/LPC) results would suggest recruitment of a mental rotation PRS by ¹250 – 400 msec. Multiple memory systems thus map onto multiple processes, consistent with brain imaging findings (Buckner et al., 1998). Our data would suggest, in general, that each PRS has its own pattern of form specificity, corresponding to the specific identification-related function underlying it. Since we did not test memory directly, we cannot rule out the possibility that our posterior LPC effects may in part reflect distinct implicit and explicit memory processes linked to N400 and P600 repetition effects, respectively (Rugg et al., 1998). While we used an indirect memory test, neither this nor direct tests necessarily engage only implicit or explicit memory systems, respectively; either system can explain results on either test (Schacter & Buckner, 1998; Schacter et al., 1995;
Squire, 1994). Parietal N400 repetition effects have been linked to lexical, semantic, or conceptual priming (Rugg et al., 1998). P600 enhancement, in contrast, has been linked to conscious recollection of study information using explicit memory systems (Rugg et al., 1998; Du ¨ zel et al., 1997; Paller et al., 1995). During direct tests, this modulation occurs by ¹300 – 500 msec until 900 msec, while during indirect memory tests, as in our case, it starts later, only after 500 msec. In this way, our ERP findings may suggest that, during an indirect test, presemantic PRSs are at least partially activated before an object is consciously recollected. That LPC (N400/P600) effects reflect multiple functions is consistent with reports that many brain regions (temporal, parietal, and frontal) contribute to LPC repetition effect s (Guillem, N’Kaoua, Rougier, & Claverie, 1995).
METHODS Pilot Work Common objects were taken from digitized models, 70 of Verfaillie and Boutsen (1995) and 26 of Tarr and Yu (1996), and 30 also from digitized photographs. Pilot studies were conducted to determine the canonical and unusual views for which (a) most people identified the object spontaneously (without cues) and (b) mean identification RTs (key press) were slower for unusual than canonical views. For Verfaillie and Boutsen (1995) models, the best views, based on ‘‘goodness of view’’ scales, were tested as canonical and worst views as unusual, for those that were identifiable, but, if not, another view closest on the scale to the worst and at least one unit from the best view was tested instead until the above criteria were met. For Tarr and Yu (1996) models, except for two, we tested the three-quartersfront elevated views as canonical and top, side, or front ones as unusual. For the photograph pilot, participants saw two views serially, reported which was best/worst, and rated their mutual similarity on a four-point scale; the most dissimilar best or worst views then served as canonical or unusual views, respectively. Materials Color views of 123 digitized objects chosen in pilot work (Figure 1) were centered on a white background and scaled to ¹78 of visual angle on a 1700 cathode-ray tube at a distance of ¹155 cm. Design While the three study-view (canonical, unusual, new [unstudied]) £ two test-view design was within group in Srinivas (1993), in ours, test view conditions were between-group (Unusual views in Experiment 1, Canonical views in Experiment 2). The 123 objects were Schendan and Kutas
131
divided randomly into three sets of 41 objects, each with the same number of objects from each source, category, and branch of a cluster hierarchy (Verfaillie & Boutsen, 1995). Assignment of each set to the study test conditions was counterbalanced across subjects. The same random order of the objects was used for all participants, although the order of objects differed between the study and test phases.
APPENDIX Scatter graph of individual variability of each ERP component (in the respective time period) for each condition (S = Same, D = Different, N = New).
Procedure In both study and test phases, each trial began with central fixation (+) for 700 msec followed ¹1100 – 1600 msec later by an object. Participants pressed a handheld button (dominant hand) as soon as they identified the object, but spoke its name only after it disappeared; correct names were those given to canonical views in piloting and the study phase. In the study phase, each object was shown for 5 s; in the test phase, objects were shown until an identification response was given (or not), followed 1750 – 2500 msec later by a ‘‘?’’ cueing participants to name it. Two novel objects were used as practice for each phase. Three novel filler objects preceded the first test trial. A vocabulary distracter task followed the study phase (¹10 min). Following the indirect test, explicit memory was probed by asking people to estimate the percentage of objects repeated and, of these, how many from the same or a different view. Dependent Measures Identification RTs and naming accuracy assessed performance. Electroencephalographic (EEG) activity was sampled at 250 Hz (bandpass 0.01 – 100 Hz) from 28 tin electrodes in a plastic cap, of which 26 formed a geodesic arrangement, and 2 (T5, T6) were positioned as in the 10 – 20 system (Figure 4). Cap and right mastoid electrodes and an electrode below the right eye (to monitor eye-blinks) were referenced to the left mastoid; bilateral eye electrodes (to monitor eye movements) were referenced to each other. ERPs were calculated by averaging EEG in each condition, excluding trials with above threshold muscle activity, eye-blinks, horizontal eye, or other movement artifacts, rereferencing to the mean of both mastoids, and time-locking to image onset with a 150-msec pre-stimulus baseline. Participants UCSD undergraduates in psychology or cognitive science volunteered for course credit and/or cash. In each experiment, data from two people were excluded for excessive movement artifacts, leaving 36 participants in Experiment 1 (18 – 24 years; 20 females) and 30 in Experiment 2 (18 – 27 years, 15 females). Betweenexperiment ANOVAs included data from the 30 participants with the most artifact-free EEG in Experiment 1. 132
Journal of Cognitive Neuroscience
Volume 15, Number 1
Acknowledgments Research was supported by grant AG05914, graduate fellowships from the McDonnell-Pew Center for Cognitive Neuroscience in San Diego and a President’s Dissertation Fellowship from the University of California to H. E. Schendan and grants HD22614 and MH52893 to M. Kutas. Studies were conducted in the Department of Cognitive Science at UCSD. Special thanks to Dr. Giorgio Ganis for software support and for making the SPACERP software for producing voltage and current source density maps freely available to the scientific community. Reprint requests should be sent to Haline E. Schendan, Department of Psychology, Boston University, 648 Beacon Street, Boston, MA 02215, USA, or via e-mail: schendan@ bu.edu.
REFERENCES Badgaiyan, R. D., & Posner, M. I. (1997). Time course of cortical activations in implicit and explicit recall. Journal of Neuroscience, 17, 4904 – 4913. Bajric, J., Rosler, F., Heil, M., & Hennighausen, E. (1999). On separating processes of event categorization, task preparation, and mental rotation proper in a handedness recognition task. Psychophysiology, 36, 399 – 408. Biederman, I. (1987). Recognition-by-components: A theory of human image understanding. Psychological Review, 94, 115 –117. Biederman, I., & Cooper, E. E. (1991). Priming contourdeleted images: Evidence for intermediate representations in visual object recognition. Cognitive Psychology, 23, 393 –419. Buckner, R., Goodman, J., Burock, M., Rotte, M., Koutstaal, W., Schacter, D. L., Rosen, B., & Dale, A. (1998). Functional – anatomic correlates of object priming in humans revealed by rapid presentation event-related fMRI. Neuron, 20, 285 – 296. Bu ¨ lthoff, H. H., Edelman, S. Y., & Tarr, M. J. (1995). How are three-dimensional objects represented in the brain? Cerebral Cortex, 5, 247 – 260. Clark, V. P., Fan, S., & Hillyard, S. A. (1995). Identification of early visual evoked potential generators by retinotopic analyses. Human Brain Mapping, 2, 170 – 187. Cohen, M. S., Kosslyn, S. M., Breiter, H. C., DiGirolamo, G. J., Thompson, W. L., Anderson, A. K., Brookheimer, S. Y., Rosen, B. R., & Belliveau, J. W. (1996). Changes in cortical activity during mental rotation. A mapping study using functional MRI. Brain, 119, 89 –100. Corballis, M. C. (1988). Recognition of disoriented shapes. Psychological Review, 95, 115 – 123. Damasio, H., Grabowski, T. J., Tranel, D., Hichwa, R. D., & Damasio, A. R. (1996). A neural basis for lexical retrieval. Nature, 380, 499 –505. Doninger, G. M., Foxe, J., Murray, M., Higgins, B., Snodgrass, J. G., Schroeder, C., & Javitt, D. (2000). Activation timecourse of ventral visual stream object-recognition areas: High density electrical mapping of perceptual closure processes. Journal of Cognitive Neuroscience, 12, 615 –621. Du ¨ zel, E., Yonelinas, A. P., Mangun, G. R., Heinze, H. J., & Tulving, E. (1997). Event-related brain potential correlates of two states of conscious awareness in memory. Proceedings of the National Academy of Sciences, U.S.A., 94, 5973 – 5978.
Fleischman, D. A., Vaidya, C. J., Lange, K. L., & Gabrieli, J. D. (1997). A dissociation between perceptual explicit and implicit memory processes. Brain and Cognition, 35, 42 – 57. Ganis, G., Kutas, M., & Sereno, M. I. (1995). Freeing the ERPs: Freeware for high quality spatial map construction and presentation. Psychophysiology, 32 (Suppl. 1), Abs. 533. Ganis, G., Kutas, M., & Sereno, M. I. (1996). The search for common sense: An electrophysiological study of the comprehension of words and pictures in reading. Journal of Cognitive Neuroscience, 8, 89 – 106. George, N., Jemel, B., Fiori, N., & Renault, B. (1997). Face and shape repetition effects in humans: A spatio-temporal ERP study. NeuroReport, 8, 1417 – 1423. Grill-Spector, K., Kushnir, T., Edelman, S., Avidan, G., Itzchak, Y., & Malach, R. (1999). Differential processing of objects under various viewing conditions in the human lateral occipital complex. Neuron, 24, 187 – 203. Grill-Spector, K., Kushnir, T., Hendler, T., & Malach, R. (2000). The dynamics of object-selective activation correlate with recognition performance in humans. Nature Neuroscience, 3, 837 – 843. Guillem, F., N’Kaoua, B., Rougier, A., & Claverie, B. (1995). Intracranial topography of event-related potentials (N400/P600) elicited during a continuous recognition memory task. Psychophysiology, 32, 382 – 392. Harris, I., Egan, G., Sonkkila, C., Tochon-Danguy, H., Paxinos, G., & Watson, J. (2000). Selective right parietal lobe activation during mental rotation: A parametric PET study. Brain, 123, 65 – 73. Heil, M., Bajric, J., Rosler, F., & Hennighausen, E. (1996). Event-related potentials during mental rotation: Disentangling the contributions of character classification and image transformation. Journal of Psychophysiology, 10, 326 – 335. Humphreys, G. W., & Bruce, V. (1989). Visual cognition: Computational, experimental, and neuropsychological perspectives. Hove, England: Erlbaum. Johnson, M. K., Kounios, J., & Nolde, S. F. (1997). Electrophysiological brain activity and memory source monitoring. NeuroReport, 8, 1317 – 1320. Jolicoeur, P. (1990). Identification of disoriented objects: A dual systems theory. Mind and Language, 5, 387 –410. Kazmerski, V. A., & Friedman, D. (1997). Old/new differences in direct and indirect memory tests using pictures and words in within- and cross-form conditions: Event-related potential and behavioral measures. Cognitive Brain Research, 5, 255 –272. Keane, M. M., Gabrieli, J. D., Mapstone, H. C., Johnson, K. A., & Corkin, S. (1995). Double dissociation of memory capacities after bilateral occipital-lobe or medial temporal-lobe lesions. Brain, 118, 1129 – 1148. Kirsner, K., Speelman, C., & Schofield, P. (1993). Implicit memory and skill acquisition: Is synthesis possible? In P. Graf & M. E. J. Masson (Eds), Implicit memory (pp. 119 – 139). Hillsdale: Erlbaum. Koenderink, J. J. (1990). Solid shape. Cambridge: MIT Press. Kolers, P. A., & Magee, L. E. (1978). Specificity of patternanalyzing skills in reading. Canadian Journal of Psychology, 32, 43 – 51. Kosslyn, S. M., Alpert, N. M., Thompson, W. L., Chabris, C., Rauch, S., & Anderson, A. (1994). Identifying objects seen from different viewpoints. A PET investigation. Brain, 117, 1055 – 1071. Marr, D., & Nishihara, H. K. (1978). Representation and
Schendan and Kutas
133
recognition of the spatial organization of three-dimensional shapes. Proceedings of the Royal Society of London, Series B: Biological Sciences, 200, 269 – 294. McCarthy, G., & Donchin, E. (1981). A metric for thought: A comparison of P300 latency and reaction time. Science, 211, 77 – 80. McCarthy, G., & Wood, C. C. (1985). Scalp distributions of event-related potentials: An ambiguity associated with analysis of variance models. Electroencephalography and Clinical Neurophysiology, 62, 203 – 208. McPherson, W. B., & Holcomb, P. J. (1999). An electrophysiological investigation of semantic priming with pictures of real objects. Psychophysiology, 36, 53 – 65. Milner, B., Corkin, S., & Teuber, H. L. (1968). Further analysis of the hippocampal amnesic syndrome: 14-year follow-up study of H. M. Neuropsychologia, 6, 215 – 234. Mu¨nte, T. F., Brack, M., Grootheer, O., Wieringa, B. M., Matzke, M., & Johannes, S. (1997). Event-related brain potentials to unfamiliar faces in explicit and implicit memory tasks. Neuroscience Research, 28, 223 – 233. Paller, K. A., & Gross, M. (1998). Brain potentials associated with perceptual priming vs explicit remembering during the repetition of visual word-form. Neuropsychologia, 36, 559 – 571. Paller, K. A., Kutas, M., & McIsaac, H. K. (1995). Monitoring conscious recollection via the electrical activity of the brain. Psychological Science, 6, 107 – 111. Park, S. M., & Gabrieli, J. D. (1995). Perceptual and nonperceptual components of implicit memory for pictures. Journal of Experimental Psychology: Learning, Memory and Cognition, 21, 1583 –1594. Peronnet, F., & Farah, M. J. (1989). Mental rotation: An eventrelated potential study with a validated mental rotation task. Brain and Cognition, 9, 279 – 288. Perrett, D. I., Oram, M. W., & Ashbridge, E. (1998). Evidence accumulation in cell populations responsive to faces: An account of generalization of recognition without mental transformations. Cognition, 67, 111 – 145. Picton, T. W., Bentin, S., Berg, P., Donchin, E., Hillyard, S. A., Johnson, R. Jr., Miller, G. A., Ritter, W., Ruchkin, D. S., Rugg, M. D., & Taylor, M. J. (2000). Guidelines for using human event-related potentials to study cognition: Recording standards and publication criteria. Psychophysiology, 37, 127 – 152. Pietrowsky, R., Kuhmann, W., Krug, R., Molle, M., Fehm, H. L., & Born, J. (1996). Event-related brain potentials during identification of tachistoscopically presented pictures. Brain and Cognition, 32, 416 – 428. Rosler, F., Schumacher, G., & Sojka, B. (1990). What the brain reveals when it thinks: Event-related potentials during mental rotation and mental arithmetic. German Journal of Psychology, 14, 185 –203. Ruchkin, D. S., Johnson, R., Canoune, H., & Ritter, W. (1991). Event-related potentials during arithmetic and mental rotation. Electroencephalography and Clinical Neurophysiology, 79, 473 – 487. Rugg, M. D. (1990). Event-related brain potentials dissociate repetition effects of high- and low-frequency words. Memory and Cognition, 18, 367 – 379. Rugg, M. D., Mark, R. E., Walla, P., Schloerscheidt, A. M., Birch, C. S., & Allan, K. (1998). Dissociation of the neural correlates of implicit and explicit memory. Nature, 392, 595 – 598. Schacter, D. L., & Buckner, R. L. (1998). Priming and the brain. Neuron, 20, 185 – 195. Schacter, D. L., Reiman, E., Uecker, A., Polster, M. R., Yun, L. S.,
134
Journal of Cognitive Neuroscience
& Cooper, L. A. (1995). Brain regions associated with retrieval of structurally coherent visual information. Nature, 376, 587 – 590. Schacter, D. L., Uecker, A., Reiman, E., Yun, L. S., Bandy, D., Chen, K., Cooper, L. A., & Curran, T. (1997). Effects of size and orientation change on hippocampal activation during episodic recognition: A PET study. NeuroReport, 8, 3993 – 3998. Schendan, H. E., Ganis, G., & Kutas, M. (1998). Neurophysiological evidence for visual perceptual categorization of words and faces within 150 ms. Psychophysiology, 35, 240 – 251. Schendan, H. E., Kanwisher, N. G., & Kutas, M. (1997). Early brain potentials link repetition blindness, priming, and novelty detection. NeuroReport, 8, 1943 – 1948. Schendan, H. E., & Kutas, M. (2002). Neurophysiological evidence for two processing times for visual object identification. Neuropsychologia, 40, 931 – 945. Sereno, A. B., & Maunsell, J. H. (1998). Shape selectivity in primate lateral intraparietal cortex. Nature, 395, 500 – 503. Squire, L. R. (1994). Declarative and nondeclarative memory: Multiple brain systems supporting learning and memory. Memory systems 1994 (pp. 203 – 231). Cambridge: MIT Press. Srinivas, K. (1993). Perceptual specificity in nonverbal priming. Journal of Experimental Psychology: Learning, Memory and Cognition, 19, 582 – 602. Stuss, D. T., Picton, T. W., Cerri, A. M., Leech, E. E., & Stethem, L. L. (1992). Perceptual closure and object identification: Electrophysiological responses to incomplete pictures. Brain and Cognition, 19, 253 –266. Stuss, D. T., Sarazin, F. F., Leech, E. E., & Picton, T. W. (1983). Event-related potentials during naming and mental rotation. Electroencephalography and Clinical Neurophysiology, 56, 133 – 146. Sugio, T., Inui, T., Matsuo, K., Matsuzawa, M., Glover, G. H., & Nakai, T. (1999). The role of the posterior parietal cortex in human object recognition: A functional magnetic resonance imaging study. Neuroscience Letters, 276, 45 – 48. Swick, D., & Knight, R. T. (1997). Event-related potentials differentiate the effects of aging on word and nonword repetition in explicit and implicit memory tasks. Journal of Experimental Psychology: Learning, Memory and Cognition, 23, 123 – 142. Tarr, M. J., & Pinker, S. (1989). Mental rotation and orientationdependence in shape recognition. Cognitive Psychology, 21, 233 – 282. Tarr, M. J., & Yu, S. (1996). Object databank (v 1.0) [CD-ROM]. Providence, RI: Brown University. Tulving, E., & Schacter, D. L. (1990). Priming and human memory systems. Science, 247, 301 – 306. Tulving, E., & Thomson, D. M. (1973). Encoding specificity and retrieval processes in episodic memory. Psychological Review, 80, 359 – 380. Turnbull, O. H., Carey, D. P., & McCarthy, R. A. (1997). The neuropsychology of object constancy. Journal of the International Neuropsychological Society, 3, 288 – 298. Ullman, S. (1996). High-level vision: Object recognition and visual cognition. Cambridge: MIT Press. Van Petten, C., Kutas, M., Kluender, R., Mitchiner, M., & McIsaac, H. (1991). Fractionating the word repetition effect with event-related potentials. Journal of Cognitive Neuroscience, 3, 131 – 150.
Volume 15, Number 1
Verfaillie, K., & Boutsen, L. (1995). A corpus of 714 full-color images of depth-rotated objects. Perception and Psychophysics, 57, 925 –961. Vuilleumier, P., Henson, R. N., Driver, J., & Dolan, R. J. (2002). Multiple levels of visual object constancy revealed by event-related fMRI of repetition priming. Nature Neuroscience, 5, 491 –499. Warrington, E. K., & Taylor, A. M. (1973). The contribution of the right parietal lobe to object recognition. Cortex, 9, 152 –164. Warrington, E. K., & Weiskrantz, L. (1970). Amnesic syndrome: Consolidation or retrieval? Nature, 228, 628 – 630.
Weinshall, D., Edelman, S. Y., & Bu ¨ lthoff, H. H. (1990). A self-organizing multiple-view representation of 3D objects. In D. S. Touretzky (Ed.), Advances in neural information processing systems 2 (pp. 274 – 281). San Mateo, CA: Morgan Kaufmann. Wijers, A. A., Otten, L. J., Feenstra, S., Mulder, G., & Mulder, L. J. M. (1989). Brain potentials during selective attention, memory search, and mental rotation. Psychophysiology, 26, 452 –467. Wilding, E. L., & Rugg, M. D. (1996). An event-related potential study of recognition memory with and without retrieval of source. Brain, 119(Pt 3), 889 – 905.
Schendan and Kutas
135