2013 17th International Conference on Information Visualisation
Time-pie visualization: Providing contextual information for energy consumption data Masood Masoodian∗ , Birgit Endrass† , Ren´e B¨uhling†‡ , Pavel Ermolin† , Elisabeth Andr´e† ∗ Department of Computer Science The University of Waikato, New Zealand
[email protected] † Human Centered Multimedia Augsburg University, Germany {endrass,buehling,andre}@hcm-lab.de ‡ Faculty of Computer Science University of Applied Sciences Augsburg, Germany
The first category of tools and services include building automation technology [2] such as Gira1 , HomeMatic2 and Intellihome3 . Software systems have been developed to allow users to control the behaviour of their building automation technology, for instance by setting and managing rules and activities [3], or accessing them via the internet [4]. The second category of tools and services itself can be divided into: physical devices and appliances; and information visualization systems that inform users about their energy consumption. The interactive physical devices, which are also referred to as eco-visualizations [5] or ambient and artistic visualizations [6], [7], are “targeted at revealing energy use in order to promote sustainable behaviours or foster positive attitudes towards sustainable practices” [1]. Examples of such devices include the Energy AWARE Clock [8], Power-Aware Cord [9], and many others (see [10]). The focus of this paper is on information visualization systems for monitoring energy consumption. Development of these types of systems are motivated by some evidence, at least in the case of residential homes, that monitoring energy usage information can lead to energy savings and changes to patterns of use [11]. Most of these visualizations, however, tend to focus only on energy consumption data, and ignore incorporating other information such as inside/outside temperature, presence of people, etc. to provide contextual information to users about their energy use. In this paper we introduce the time-pie visualization, which has been designed to facilitate the inclusion of contextual data on visualization of energy use across time. Although here we focus on energy usage data, time-pie visualization may have potential applications for other types of time-based data.
Abstract—In recent years a growing number of information visualization systems have been developed to assist users with monitoring their energy consumption, with the hope of reducing energy use through more effective user-awareness. Most of these visualizations can be categorized into either some form of a time-series or pie chart, each with their own limitations. These visualization systems also often ignore incorporating contextual (e.g. weather, environmental) information which could assist users with better interpretation of their energy use information. In this paper we introduce the time-pie visualization technique, which combines the concepts of timeseries and pie charts, and allows the addition of contextual information to energy consumption data. Keywords-Energy usage visualization, energy usage monitoring, energy usage management, time-line visualization, pie chart visualization, rose chart, time-pie visualization.
I. I NTRODUCTION World-wide energy consumption has been increasing rapidly over the past few decades. This increase in demand for energy, coupled with decreasing availability of nonrenewable resources, as well as environmental concerns over the use of fossil fuels, has made it necessary to consider ways of saving energy both in commercial and private sectors. Initiatives such as developing more energy efficient buildings, transport systems, appliances, etc. are aimed at helping with reduction in energy consumption. There has also been much research and development in recent years targeting inhabitants of buildings, both residential and commercial, by providing them with tools and services that could assist them with reducing their energy consumption. The objective of such tools and services is to: a) automate energy using activities so that they can be carried out more efficiently and/or when there is more renewable energy available, b) provide users with better feedback [1] about their energy use, so that they can make concious decisions about when and how they use energy. 1550-6037/13 $26.00 © 2013 IEEE DOI 10.1109/IV.2013.12
1 www.gira.de 2 www.homematic.com 3 www.intellihome.com
102 93
day period, it would be impossible to know during what periods of the day energy was used for heating.
II. V ISUALIZATION OF ENERGY USE As mentioned, various information visualization tools and techniques have been developed to provide users with energy consumption awareness, by allowing them to view and interactively explore their energy usage data [12]. Pierce at al. [1] identify 8 different strategies employed by designers of eco-visualization devices, two of which also apply to information visualizations, and are therefore considered here. These are: “offering behavioural cues and indicators” and “providing tools for analysis”. Pierce at al. point out that these two strategies “relate to supporting conservation goals by providing clear and useful information and feedback”. Since energy use data is collected over time, it is not surprising that most visualization techniques provided by existing systems generally fall under the broad category of time-oriented visualizations [13]. Furthermore, the vast majority of them are actually some form of graphical timeseries [14], such as bar graphs, line charts, and silhouette graphs [13]. Examples of time-series visualizations used for viewing energy consumption include E-SAVE [15], Lucid Building Dashboard4 , Holmes5 , ECOIS [16], FigureEnergy [17], and USEM [18]. These systems tend to show the total energy consumption for the entire building (e.g. house), individual areas (e.g. a room), a group of devices (e.g. heating), or individual devices (e.g. refrigerator) or users. The basic unit of time, across which the usage is measured, can range from a month or a week to a day or an hour. Although these types of time-series are useful for visual exploration of usage trends across time, most users often have no clear understanding of the metrics used for measuring energy consumption (e.g. kilowatt hour) [19]. Other types of visualizations are therefore used to make usage data more meaningful to ordinary users. The most common visualization used to represent an overview of the total energy consumed by different devices, activities, or users in relation to one another is through pie charts. Several of the above mentioned systems [18], [16], [15], [19] provide pie chart views of the total energy consumption by various devices, activities, or users during specific units of time (e.g. a week, a day, or an hour). In some systems it is even possible to set limits or targets for the total energy consumption, which the visualization can show when they are likely to be exceeded [19], [18]. Despite their popularity, and ease of comprehension by non-expert users, pie charts do not incorporate the important concept of time, other than the total unit of time over which the measurements were made. Therefore, although by using a pie chart it would be possible to, for instance, see that heating has consumed 40% of the total energy during a one
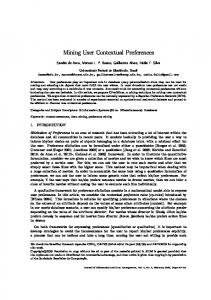
III. C ONTEXT FOR ENERGY USE Another major limitation of the existing energy consumption visualization systems is that regardless of the type of visualization used (e.g. time-series or pie charts), they generally do not included contextual information in their visualizations. Although separate graphs are sometimes provided, for instance for outside temperature or general weather conditions across time, they are not seamlessly combined with energy consumption visualizations to allow users to perform visual analysis of any potential links between such contextual factors and their energy consumption. As mentioned before, most people have little understanding of energy consumption metrics. This combined with the fact that recorded energy use data for even a small building with several devices in use can grow rapidly over time, often makes energy consumption data meaningless on their own. Furthermore, it is highly unlikely that without gaining some understanding of the energy usage data users will be able to modify their behaviour to save energy. It is also unreasonable to assume that people will simply stop using energy even if this has negative impact on their life-style or comfort levels. Providing contextual information such as environmental conditions can allow people to see where and when energy is being used unnecessarily, thus savings can be made without negatively impacting users’ life-style. Even when only energy usage data is presented to the user, this can be visualized in the context of historical consumption data. For instance, energy usage data for the last week can be shown along with the usage data for the same week last year, weekly or daily averages for the entire year, etc. One idea would be to use a composite time-series visualization similar to the one used by the New York Times for reporting their annual review of New York City’s weather (see [14]). Figure 1 shows a sample sketch of such a visualization for energy usage data over a week. In this example the viewer can for instance see that more energy is generally used on Sundays, Wednesdays, and Fridays; and that this past Tuesday and Friday more energy was used than what the average is for Tuesdays and Fridays respectively. Although this is a simple improvement over the type of time-series used by existing systems, it provides some context to allow users to compare their energy use with similar periods over time. However, other alternative visualizations are needed when more comprehensive contextual information has to be presented with energy usage data. In the next section we propose one such visualization. IV. T IME - PIE VISUALIZATION The main idea behind the proposed time-pie visualization is to combine the important features of time-series and pie
4 www.luciddesigngroup.com/network/features.php 5 www.diykyoto.com/uk/aboutus/holmes-the-software/
103 94
Figure 2. Sketch of an example time-pie visualization, showing the total energy used by one type of device in a 24-hour period. Figure 1. Sketch of an example composite time-series, showing recorded energy usage data for a week in the context of historical energy use data.
charts—the two most commonly used energy consumption visualizations. Time-series rely on the universally known dimension of time. Time is easily understood, at least in its most basic level, by ordinary people. Despite their widespread use, however, time-series can become less effective, or even misleading (for examples see [14]), when the second dimension along which data is shown in not easily understood or misrepresented. Energy consumption data is one such case, where, for instance, most people do not necessarily understand the concept of kilowatt hour, along which energy use data is often presented. Pie charts, on the other hand, are useful for illustrating proportions, and are easily understood by most people. Although it must be noted that comparing the areas of different slices of a pie chart accurately can be difficult [20], in some cases, such as those discussed here, the ability to estimate relative proportions can be more important than knowing the exact values. Time-pie, therefore, visualizes the proportions of total energy use across the measured time period (e.g. a day, month, etc.) in a pie chart style. This gives a non-linear, but proportional, representation of time across the total measured time period. Figure 2 illustrates a sketch of a time-pie visualization showing the amount of energy used, for instance, by the air-conditioning system in a 24-hour period. From this visualization it can be easily seen that around a quarter of the total energy was used between the hours 0:00-8:00 and 20:00-24:00 (totalling a 12-hour night period), while a similar amount of energy was used within a 3-hour period between 11:00 and 14:00.
Figure 3. Sketch of an example time-pie visualization, showing contextual information such as the outside temperature, and the number of building occupants during various hours.
To allow for a better analysis of the variations in energy use by the air-conditioning system, for example, it is then possible to incorporate other contextual information in the time-pie visualization. Figure 3 demonstrates one such case where information about the number of people present in the room, and the outside temperature are included for all the slices of the time-pie. From this example the user may, for instance, conclude that energy was used unnecessarily between 14:00 and 15:00, since the temperature outside was not very warm, and there was no one in the room. The time-pie visualization can be extended to include other relevant contextual information (shown around the circumference), or different categories of energy consuming devices by proportionally using the area inside each slice. Figure 4 shows a time-pie visualization presenting energy usage data for three types of devices (air-conditioning, computers, and lights) in a 24-hour period. From this example it can be concluded that, for instance, computers are using
104 95
energy unnecessarily over night when there is no one in the room.
Figure 5. Sketch of several time-pies, showing percentages of day and night time energy use during the seven days of a week.
The last example in Figure 5 also shows that when most of the context information and time slices are removed from a time-pie, it naturally ends up looking like a normal pie chart. This allows both types of visualizations to be used together seamlessly. V. P ROTOTYPE To evaluate our ideas of visualization of time-based data using time-pies, we have developed a prototype system that handles energy usage data in an office work environment. In this section we describe this system, both in terms of its physical components, as well as its time-pie visualization. To collect energy consumption data we equipped five offices in a university building with different kinds of sensors and monitoring devices. Two people work in each of the offices, with each person using a desktop computer with two computer screens and a desk lamp. The electricity consumption data is recorded in each office using Current Cost6 sensors. The actual recording of measured data is implemented in an independent server module. In intervals of approximately 20 seconds measured data is sent wirelessly to a sensor station which is connected via USB to our server module. Our recording software reads these xml formatted data sets and stores them in a local database. The data set is subsequently used to provide several different visualizations. The visualization component of the prototype has been developed for an iPad7 device using the IDE XCode8 for development. There are essentially two groups of visualizations: one group is used for showing private consumption data to individual users only, and another group for showing generalized consumption data publicly. The time-pie visualization discussed in this paper is part of the public visualization, showing energy consumption over time for different offices. To allow comparison of data across multiple offices, without sharing private energy usage information, it is important for the visualization not to focus on the total energy consumption, but rather on where and when the energy is used. It is hoped that this would encourage people to use energy more efficiently, as opposed to simply not using energy to save
Figure 4. Sketch of an example time-pie visualization, showing the proportions of total energy use by three types of devices in a 24-hour period.
Once again it should be noted that time-pie is not being used here to provide the viewer with immediate information about the exact amount of energy used by each category of devices (e.g. in kWh), but rather to allow estimate comparisons to be made across different time slices, or device categories within individual slices. In an interactive timepie visualization (see next section) the user would be able to enquire dynamically about the exact values represented by the individual slices or segments inside the slices (e.g. by pointing or clicking on them), should this be needed. It should also be mentioned that this type of time-pie visualization has some resemblance to rose charts (or polar area graphs) and windrose [13], [21]. In rose charts or windrose the central angle of individual slices remain the same, and in the case of rose charts the time is shown linearly along the circumference. In time-pie, however, slices are proportional (as with conventional pie charts), and time is shown proportionally. This allows the time-pie to be contained entirely in a circle, thus contextual information can be shown more easily around the circumference. Finally, multiple time-pies can be used together to allow comparison of proportions across several time periods. For instance comparisons might be required between proportion of energy consumption by the same category of devices in different days. For example, Figure 5 shows the proportion of energy used at night time (i.e. combined 0:00-8:00 and 20:00-24:00 time slices) for different days of the week. In this example, it can be seen that although the total amount of energy used during the weekend days is less than the normal weekdays (i.e. variations in sizes of circles), the percentage of energy use at night also changes (i.e. in the weekends the amount of energy used is similar between day and night).
6 www.currentcost.com 7 www.apple.com/ipad/ 8 developer.apple.com/xcode/
105 96
energy, for example by switching off their desk lamp even when they need it at night time. Figure 6 shows the time-pie visualization of our prototype system. The upper area shows several time-pies visualizing the percentages of day and night time energy usage for different days of the week, similar to the sketch shown in Figure 5. The actual times for day and night periods are obtained from the wunderground weather API 9 that, amongst other data, provides the exact times for sunrise and sunset for the requested location. The size of each circle reflects the total energy consumption for that day by all the offices.
consumption of all offices on a 2-hour basis, while the sections of the slices relate to each office in which the energy was consumed. By selecting either a time period (by tapping on one of the slices) or an office (by tapping the office colour) additional information can be provided as outlined in Figure 3. While selecting the office shows timebased details of energy usage for the target office, selecting the time slice shows a normal pie chart of the percentages of energy consumption for each office. To help the user, especially when selecting very small slices representing low energy consumption values, the currently selected slice is highlighted using a white outline (as shown in Figure 6). In order to demonstrate how the electricity consumption data can be put in context using other information, our system currently records the room temperature of each office using an M-ware10 USB thermometer. Additionally, the outside temperature is obtained for the target time and location using the wunderground weather API. The context information of the outside and inside temperature for each room are displayed around the circumference of the time-pie visualization (see Figure 6). It should be noted that although these temperature measurements (for inside and outside) may not be that accurate, at this stage our aim is to demonstrate the potential value of our prototype system. In future, more accurate sensors will be used, and other contextual information such as the number of people present in each office at any given time will be collected and visualized by our system. VI. C ONCLUSIONS This paper has presented the time-pie visualization, which combines important aspects of conventional time-series visualizations and pie charts. Time-pie has been discussed primarily as a technique for visualization of energy consumption data across time. The aim has been to visualize the proportions of total energy used, rather than the actual values, over a specified time period. The examples we have provided, both in terms of sketches and the prototype implementation, are demonstrative in nature. Time-pie can be used for other applications where it is necessary to show data as proportions across time. The total time period measured (e.g. 24 hours in our examples), as well as the individual time slices required (e.g. an hour in our sketches, and two hours in our prototype), can vary depending on the application. The type of measurements made can also change (e.g. energy consumed by individual devices, offices, or users). Finally, the contextual information measured and shown around the time-pie can also change depending on the needs. For instance for the air-conditioning energy usage data the context information might be the temperature outside, while for the computers energy use the
Figure 6. A prototype implementation of time-pie visualization, showing the proportions of energy usage by five different offices in a 24-hour period.
By tapping on one of the time-pie daily circles, a detailed time-pie for that day is shown in the bottom area of the screen (see Figure 6). The time-pie proportions are based on the actual energy consumption data from the five offices. In comparison to the schematic descriptions of the time-pie visualization earlier in this paper, in this prototype different coloured areas holding the proportions of the energy consumption do not show the different devices but the different offices. This choice is dependent on the application area, and could easily be changed by installing additional Current Cost sensors, one for each device. Thus, the slices of the time-pie and their size respectively represent the energy 9 www.wunderground.com/weather/api/
10 www.m-ware.de
106 97
contextual information might be the number of people using their computers. In terms of the future work, we first aim to complete the development of our prototype. We will then carry out a user study of the time-pie visualization to evaluate its effectiveness.
[10] S. Backlund, M. Gyllensw¨ard, A. Gustafsson, S. I. Hjelm, R. Maz´e, and J. Redstr¨om, “STATIC! the aesthetics of energy in everyday things,” in Proceedings of Design Research Society Wonderground International Conference. Design Research Society, 2006. [11] T. Ueno, F. Sano, O. Saeki, and K. Tsuji, “Effectiveness of an energy-consumption information system on energy savings in residential houses based on monitored data,” Applied Energy, vol. 83, no. 2, pp. 166–183, 2006. [Online]. Available: http://www.sciencedirect.com/science/ article/pii/S030626190500019X
ACKNOWLEDGEMENT This research has been undertaken as part of the IT4SE project, funded by the German Federal Ministry of Education and Research (BMBF) under the APRA initiative. For more information please visit www.it4se.net.
[12] S. Goodwin and J. Dykes, “Visualising variations in household energy consumption,” in Proceedings of the IEEE Conference on Visual Analytics Science and Technology. IEEE Computer Society, 2012, pp. 217–218.
R EFERENCES [1] J. Pierce, W. Odom, and E. Blevis, “Energy aware dwelling: a critical survey of interaction design for eco-visualizations,” in Proceedings of the 20th Australasian Conference on Computer-Human Interaction. ACM, 2008, pp. 1–8.
[13] W. Aigner, S. Miksch, H. Schumann, and C. Tominski, Visualization of Time-Oriented Data, ser. Human-Computer Interaction Series. Springer-Verlag, 2011.
[2] A. Wong and A. So, “Building automation in the 21st century,” in Proceedings of the 4th International Conference on Advances in Power System Control, Operation and Management. IEE, 1997, pp. 819–824.
[14] E. R. Tufte, The Visual Display of Quantitative Information, 2nd ed. Graphics Press, 2001.
[3] M. Kugler, E. Andr´e, M. Masoodian, F. Reinhart, B. Rogers, and K. Schlieper, “Assisting inhabitants of residential homes with management of their energy consumption,” in Proceedings of the 4th International Conference on Sustainability in Energy and Buildings. Springer-Verlag, 2013, pp. 147–156.
[15] S. Soni and Y. Lee, “E-SAVE: saving energy by smart serves,” in IEEE International Symposium on a World of Wireless, Mobile and Multimedia Networks. IEEE Computer Society, 2012, pp. 1–3.
[4] A. Rossell´o-Busquet and J. Soler, “A novel web service based home energy management system,” in Proceedings of the 3rd International Conference on Advances in Future Internet. IARIA, 2011, pp. 126–131.
[16] T. Ueno, F. Sano, O. Saeki, and K. Tsuji, “Effectiveness of an energy-consumption information system on energy savings in residential houses based on monitored data,” Applied Energy, vol. 83, no. 2, pp. 166–183, 2006.
[5] T. G. Holmes, “Eco-visualization: combining art and technology to reduce energy consumption,” in Proceedings of the 6th ACM SIGCHI Conference on Creativity & cognition. ACM, 2007, pp. 153–162.
[17] E. Costanza, S. D. Ramchurn, and N. R. Jennings, “Understanding domestic energy consumption through interactive visualisation: a field study,” in Proceedings of the ACM Conference on Ubiquitous Computing. ACM, 2012, pp. 216–225. [Online]. Available: http://doi.acm.org/10.1145/2370216.2370251
[6] J. Rodgers and L. Bartram, “Ambient and artistic visualization of residential resource use,” in Proceedings of the Graphics Interface, 2010, pp. 17–19.
[18] F. Reinhart, “Designing a tablet interface for effective energy usage feedback using persuasive technologies,” MSc, Human Centered Multimedia, Universit¨at Augsburg, 2012.
[7] ——, “Exploring ambient and artistic visualization for residential energy use feedback,” IEEE Transactions on Visualization and Computer Graphics, vol. 17, no. 12, pp. 2489– 2497, 2011.
[19] P. Monigatti, M. Apperley, and B. Rogers, “Power and energy visualization for the micro-management of household electricity consumption,” in Proceedings of the International Conference on Advanced Visual Interfaces. ACM, 2010, pp. 325–328. [Online]. Available: http: //doi.acm.org/10.1145/1842993.1843052
[8] L. Broms, “Sustainable interactions : Studies in the design of energy awareness artefacts,” PhD, MDALAB - Human Computer Interfaces, The Institute of Technology, Link¨oping University, 2011. [9] A. Gustafsson and M. Gyllensw¨ard, “The power-aware cord: energy awareness through ambient information display,” in Extended Abstracts of the ACM SIGCHI Conference on Human Factors in Computing Systems. ACM, 2005, pp. 1423–1426. [Online]. Available: http://doi.acm.org/10.1145/ 1056808.1056932
[20] G. van Belle, Statistical Rules of Thumb, 2nd ed. Interscience, 2008.
Wiley-
[21] M. Friendly, “The golden age of statistical graphics,” Statistical Science, vol. 23, no. 4, pp. 502–535, 2008.
107 98