Article pubs.acs.org/JCTC
Time Recovery for a Complex Process Using Accelerated Dynamics S. Alexis Paz*,†,‡ and Ezequiel P. M. Leiva† †
INFIQC − Departamento de Matemática y Física, Facultad de Ciencias Químicas, Universidad Nacional de Córdoba, Córdoba X5000HUA, Argentina ‡ Department of Chemical and Biological Engineering, Drexel University, Philadelphia, Pennsylvania 19104, United States S Supporting Information *
ABSTRACT: The hyperdynamics method (HD) developed by Voter (J. Chem. Phys. 1996, 106, 4665) sets the theoretical basis to construct an accelerated simulation scheme that holds the time scale information. Since HD is based on transition state theory, pseudoequilibrium conditions (PEC) must be satisfied before any system in a trapped state may be accelerated. As the system evolves, many trapped states may appear, and the PEC must be assumed in each one to accelerate the escape. However, since the system evolution is a priori unknown, the PEC cannot be permanently assumed to be true. Furthermore, the different parameters of the bias function used may need drastic recalibration during this evolution. To overcome these problems, we present a general scheme to switch between HD and conventional molecular dynamics (MD) in an automatic fashion during the simulation. To decide when HD should start and finish, criteria based on the energetic properties of the system are introduced. On the other hand, a very simple bias function is proposed, leading to a straightforward on-the-fly set up of the required parameters. A way to measure the quality of the simulation is suggested. The efficiency of the present hybrid HD−MD method is tested for a two-dimensional model potential and for the coalescence process of two nanoparticles. In spite of the important complexity of the latter system (165 degrees of freedoms), some relevant mechanistic properties were recovered within the present method.
1. INTRODUCTION One of the biggest problems of computer simulations using molecular dynamics (MD) is the relatively short time scale that can be reached within this method. To achieve long simulation times powerful computer clusters are needed, and even in this case, only a few microseconds can be simulated. For many systems, the dynamics at long times is characterized by rare (infrequent) events: the system must escape from a certain basin of its potential energy surface (PES) after wasting a long time trapped in it. At present, many tools to handle these rare events have been developed. For instance, there are different methods that allow an enhanced sampling of the free energy surface (FES) associated with one or more specific collective variables (CVs) of the system.1−10 Suitable CVs are chosen from prior knowledge of the system. On the other hand, the hyperdynamics (HD) developed by Voter11,12 aims to achieve an acceleration in a representative way of the exact dynamics of the system. In this case, the time information and the power of prediction of the conventional MD can be retained. Following the importance sampling,13 the HD introduces a transformation of the PES by the addition of a bias function ΔUb Ub(r) = U (r) + ΔUb(r)
will be shorter, improving the occurrence frequency of the rare events. Using transition state theory (TST), Voter showed that the correct long-time kinetics of the system can be recovered if the bias function is designed to vanish at the transition states (TS). In spite of the great potential of this method, its implementation is not straightforward, as can be seen from the many different approaches made in the last 15 years.14−30 For instance, finding a bias function that vanishes at the TS is a nontrivial task, especially for systems with many degrees of freedom. Since HD is based on TST, the system is required to achieve pseudoequilibrium conditions (PEC) at the trapped state before the HD may be applied. If the system is well-known, then ensuring these conditions for any state (as is the case for a Markovian process) is not a major problem. However, in the opposite case, an on-the-fly algorithm should be applied to determine when HD can be safely used. In addition, the use of a bias function usually requires different parameters that must be fixed for the particular state of the system. These parameters might be unknown or even need drastic recalibration as the evolution of the system takes place. Therefore, an acceleration algorithm with an automatic regulation of these parameters is needed. For instance, Perez and Voter19 used a self-learning
(1)
While this transformation leads to a reduction of the energy barriers of the PES, the residence time in the metastable states © 2015 American Chemical Society
Received: October 31, 2014 Published: February 24, 2015 1725
DOI: 10.1021/ct5009729 J. Chem. Theory Comput. 2015, 11, 1725−1734
Article
Journal of Chemical Theory and Computation algorithm to safely parametrize a variation of the bond boost method of Miron and Fichthorn.25 In the present work, we propose a hybrid HD−MD scheme to parametrize on-the-fly energy-based bias functions similar to that proposed by Hamelberg et al.23 During a MD simulation period, a test for the PEC is continually performed. When this test is successful, the parameters of the bias function are automatically fixed using local energy properties of the trapped state and some generals rules for the desired acceleration. Then, the HD simulation starts and continues until a maximum limit for the magnitude of the bias (i.e., the instantaneous value of the bias function) is overcome. In general, this limit leads to a decay probability for the HD simulation, but it also acts as a fuse if the acceleration becomes too aggressive, indicating that a recalibration of the bias parameters is needed. Finally, the MD simulation starts again, and the described process is iterated. This work is organized as follows. The method to analyze the occurrence of PEC is presented in Section 2. In Section 3, we present the simple bias function used for the present implementation, and in Section 4, we indicate how the parameters required are adjusted on-the-fly. The criterion to finish the HD simulation is presented in Section 5, and a global scheme of the hybrid HD−MD algorithm is given in Section 6. Finally, we illustrate the use of the method for two different systems. First, we use the method to recover the drift and diffusion coefficient in a simple two-dimensional potential surface. Second, we apply it to study the coalescence process of metal nanoparticles (NPs). The results are compared directly with those obtained in our recent work31 by long MD simulations. The application of the present HD scheme allows us to recover useful time information for a complex process with a relatively large number of degrees of freedom (165). In spite of the good performance of the present method, further improvements are finally discussed, and the need for a deeper study on the scope and limitations of the hybrid HD−MD method is stated.
Flyvbjerg−Petersen Plot (FPP),32 which shows the dependence with m of
2. ANALYSIS OF THE ATTAINMENT OF PSEUDOEQUILIBRIUM CONDITIONS Since HD is based on TST, it is necessary that the system achieves pseudoequilibrium conditions (PEC) at the trapped state before HD is applied. Here, we propose a criterion to define when PEC are reached based on the statistical behavior of the potential energy. Let X be the potential energy of a system monitored during a canonical MD simulation. The value of X at the ith step of the simulation will be denoted Xi. For a set of MD simulations, each one with N steps, the average value X̅ = ∑iN Xi/N has a variance given by
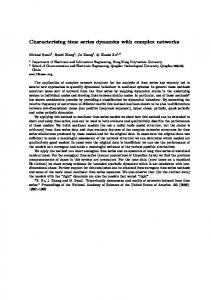
coalescence of two particles made of 42 Au atoms and 13 Co atoms, respectively. The trajectory arose from a Langevin dynamics at 550 K (friction coefficient of 5 ps−1) using second moment approximation to the tight binding potentials (parameters from ref 33). It is noted in this figure that the initial decrease of the energy due to the formation of the new Au−Co bonds and the steady state are reached after ≈4 ns due to the occurrence of the final core−shell structure. For the time intervals 1−2 ns and 4−5 ns, we computed the respective FPPs, as shown in Figure 2. The presence of a plateau is evident in Figure 2b, in contrast with the exponential shape observed in Figure 2a. The use of the criterion presented above to start the HD simulation has some advantages. First, the FPP can be constructed on-the-fly using the dynamic decorrelation distributable algorithm (DDDA) designed by Kent et al.34 This is a very efficient algorithm and can be even used in parallel computing schemes. Second, the test exhibits a relatively good sensitivity to small perturbations of energy. Third, after the test is successfully evaluated, the X̅ and σ(X) of the particular trapped state are immediately available for use. For instance, these values can be used to set up the bias function parameters required, as described in Section 4. Fourth, if the trapped state involves several local minima and small barriers, then the criterion will still be useful if the energy trace involved is taken over a sufficiently large run. Beyond these
σ 2(X̅ ) =
σ 2(X ) 2 + 2 N N
σm =
⎛ ⎜⎜1 ± ⎝
⎞ ⎟⎟ 2(m − 1) ⎠ 1
(3)
This quantity increases with m until a certain value is reached, and then it remains constant within fluctuations. This plateau is an estimator for σ(X̅ ), and its presence indicates that a decorrelated data set was obtained by the blocking operation. From another point of view, the plateau in the FPP serves as an indicator that the system has a well-behaved energy distribution with meaningful values for X̅ and σ(X). A well-behaved energy distribution is a characteristic of systems that have reached pseudoequilibrium conditions (PEC). Therefore, we propose to use the occurrence of the plateau in the FPP as prerequisite to start the HD simulation. In Figure 1, we show the energy trace of a MD simulation obtained in a previous work.31 The process under study was the
Figure 1. Energy trace for the coalescence process of two metallic NPs, made of 42 Au atoms and 13 Co atoms, respectively. Au atoms are shown in pink, and Co atoms, in blue.
N
∑ σ (X i , X j ) j>i
σ(?) m−1
(2)
where σ(Xi,Xj) is the covariance for the pairs Xi and Xj along the different MD simulations and σ2(X) is the variance of X. To avoid the computation of the covariance term, a decorrelation process on the data trace from each MD simulation is commonly used. This process involves splitting each trace in m blocks and using the averages over each block as a set of ?i , ..., ?m decorrelated energy values per MD simulation. If N is sufficiently large, then the minimum value of m required to obtain a decorrelated data set can be obtained from a 1726
DOI: 10.1021/ct5009729 J. Chem. Theory Comput. 2015, 11, 1725−1734
Article
Journal of Chemical Theory and Computation
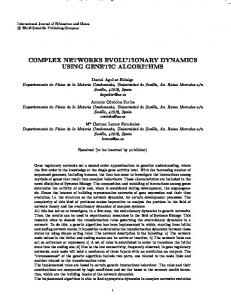
meaning: any escape from the basin enclosed by the surface U(r) = E satisfies Voter’s conditions for zero bias at the TS. Therefore, E may be tuned to observe rare events in the desired time scale, whereas the other events inside the basin are assumed to be ergodically sampled as required by the PEC. However, when the number of degrees of freedom of the system (say n) is relatively large, the setup of E is not trivial. The average energy and energy fluctuations grow with n, thus forcing E to be increased to obtain a reasonable acceleration. For these cases, Hamelberg and collaborators suggest to set up E relative to the average energy.23 It must be emphasized that within the methodology presented above the statistical properties of the energy (as σ(X) and X̅ ) are immediately available after the FPP plateau is found. For the sake of simplicity, instead of the Hamelberg et al. bias function, we will use a simpler version given by ⎧(E − U )(1 − α) U < E ΔUb(U ) = ⎨ ⎩ 0 U≥E
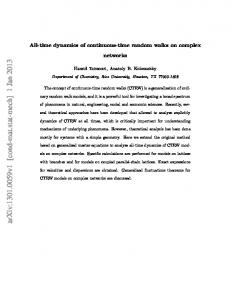
Figure 2. Flyvbjerg−Petersen plots (FPP) of the energy trace shown in Figure 1 for the intervals 1−2 ns and 4−5 ns as indicated. Vertical and horizontal lines are drawn to guide the eyes.
with 0 < α ≤ 1. This function leads to the transformation ⎧ αU (r) + E(1 − α) U (r) < E Ub(r) = ⎨ U (r) U (r) ≥ E ⎩ ⎪
advantages, it is important to emphasize that the proposed test is only a criterion and not a definitive proof of the PEC. Although it is true that a plateau will be found in the FPP when the system reaches the PEC, the opposite might not be true, as happens with some pathological cases, like a system with a consistently flat PES. After the FPP is obtained on-the-fly using the DDDA, an automatic way to detect the plateau in the plot is needed. In this work, we use a simple procedure, but other more sophisticated procedures might be chosen. First, we measure the length of the candidate plateau as the maximum number of consecutive m values, counted from the right side of the plot, for which the intersection of the error bars is not void. For example, the plateau in Figure 2a has only three consecutive m values of length (log2(m) = 16, 15, 14), but in Figure 2b, it extends over seven m values (log2(m) = 16, ..., 10). If this length covers a certain (arbitrarily defined) fraction of the total m values, then we consider the FPP to have a well-defined plateau. The vertical lines in Figure 2 indicate the defined fraction used in this work (7/17).
⎪
Figure 3. Example of the PES transformation obtained using the bias function defined in eq 6.
The parameter E keeps the same meaning as before. The main drawback of this function with respect to that of Hamelberg et al. is the introduction of a discontinuity in the force when U(r) = E. However, since stochastic dynamics is used to performed the HD simulation, we believe that this discontinuity does not introduce a major error in the results. We have determined that for some simple systems the present bias function delivers results similar to those obtained with the bias of eq 5. It is important to remark that in any case the hybrid HD−MD algorithm presented here could be improved using the Hamelberg et al. bias function. The choice of the lineal transformation scheme was made to clarify the presentation of the method.
(4)
where g is any arbitrary function. In order to keep a transparent notation, we will write g(x) also as ΔUb(x), where the distinction with ΔUb(r) will be evident from the nature of the argument. A useful energy-based bias function was proposed by Hamelberg et al.23 ⎧ (E − U )2 ⎪ U ZM) will increase quickly, and the HD will be finished, allowing the MD to be started and the bias parameters to be recalibrated for the new state.
6. GLOBAL PICTURE OF THE HYBRID HD−MD METHOD Figure 5 shows a complete diagram of the method proposed. Prior to starting the simulation, it is necessary to define the
Figure 4. Contour map of B and w as a function of E′ and α′. The maximum boundary of α′ indicated for 55 atoms is approximated from a system of 165 independent harmonic oscillators.
input parameters for the hybrid HD−MD simulation. Furthermore, since B and w can also be directly measured during the simulation, the comparison between the target and measured values may be taken as a degree of the quality of the simulation.
5. SWITCHING BACK TO THE MD FROM THE HD In a similar way as we predict the biased energy distribution Pb(y), we can predict the probability distribution of the bias values observed, say PΔ(z). That is, PΔ(z) dz is the probability of observing a bias between z and z + dz in the course of the simulation. In the Appendix, we derive an expression relating PΔ(z) with Pb(y) (and therefore P(x)). For the bias function used in this work ⎧ B ⎛ z ⎞⎟ −βz e P ⎜E − z>0 ⎪ ⎝ 1 − α⎠ PΔ(z) = ⎨ 1 − α ⎪ (1 − w) δ(z) z=0 ⎩
Figure 5. Flowchart of the hybrid HD−MD method. The main input parameters are the desired boost factor B, the desired nonzero bias probability w, and the decay probability ϕ to stop the HD simulation.
(18)
time scale of interest, which leads to the setup of the boost factor, B. Also, a value for parameter w must be chosen. We suggest for the latter that a value close to 0.5 be used, as was discussed in Section 4. Once B and w have been chosen, the E′ and α′ values can be found using Figure 4 or, equivalently, eq 15. Finally, it is necessary to select a value for ZM by choosing a decay probability ϕ, which determines the length of the HD simulation periods. Noting that ϕ/w is the expected fraction of bias values above ZM, we can suggest ϕ < w/1000 for a good sampling on each HD simulation period. Then, using the selected ϕ and eq 20, the value for ZM is obtained. Once the three parameters E', α′ and ZM are determined, the first MD simulation begins, and the criterion for the attainment of the pseudoequilibrium conditions is checked every l steps. When the PEC conditions are satisfied, the values for X̅ and σ(X) are evaluated and parameters α and E and are computed through eqs 17 and 16, respectively. Then, the HD simulation starts. Since the first n steps of HD do not belong to an ergodic sampling of the biased PES, but rather to the unbiased one, these steps are considered to be an equilibration stage and are discarded. Note that suitable values for l and n can be estimated from a straightforward study of the energy autocorrelation function, a common practice in most MD studies. Finally, the HD simulation proceeds until the condition ΔUb > ZM is achieved, and the MD starts again.
Therefore, the probability to observe a bias of magnitude Z above a certain value ZM is ϕ(Z M) = 1 −
∫0
ZM
PΔ(z) dz
⎛ α′2 ⎞ ⎛ ⎞ β = B cdfsn⎜E′ − α′ − Z M⎟ exp⎜ − α′E′⎟ ⎝ α′ ⎠ ⎝ 2 ⎠ (19)
We will fix ZM as an initial parameter of the hybrid HD−MD algorithm in order to build a criterion to stop the HD simulation: when the magnitude of the bias goes over ZM, the HD simulation switches to the ordinary MD. In other words, ZM will be a threshold limit for the bias magnitude, providing a fuse device to stop the HD simulation. ϕ = ϕ(ZM) becomes a decay probability for the HD simulation, and the value of ZM can be fixed choosing ϕ and inverting eq 19 to yield ZM =
⎛ϕ ⎞⎞⎤ ⎛ α′2 α′ ⎡⎢ + α′E′⎟⎟⎥ E′ − α′ − cdf −sn1⎜ exp⎜ − β ⎢⎣ ⎠⎠⎥⎦ ⎝ 2 ⎝B (20)
If ϕ has a relatively low value, then the proposed criterion has the advantage of avoiding the small barrier problem.24 That is, if the system escapes to a neighboring trapping state with similar 1729
DOI: 10.1021/ct5009729 J. Chem. Theory Comput. 2015, 11, 1725−1734
Article
Journal of Chemical Theory and Computation
7. TESTING THE METHOD FOR A TWO-DIMENSIONAL MODEL POTENTIAL In order to illustrate some of the capabilities of the hybrid HD−MD method, we apply it to study the motion of a particle in the two-dimensional model potential given by U (x , y) = cos(2πx)(1 + 4y) + 2π 2y 2 − ax
(21)
Excluding the last term, this is the potential named as “type I” by Voter in his original publication of HD.11 The new term, ax, is intended to be a small perturbation that generates a tilt in the potential along the x direction (see Figure 8). Therefore, when a ≠ 0, this term introduces a constant drift in the motion of the particle. We use 500 trajectories from pure MD simulations in order to measure the drift and diffusion coefficient along the x direction for different values of a. In order to allow the particle to overcome the potential barriers, we choose kBT = 0.2, and following ref 11, we fix a time step of 0.01 and a friction coefficient of 0.5 for the Langevin dynamics. For each trajectory, the total simulation time was 106. The drift μ and diffusion coefficient D were computed through the respective equations μ≡
d ⟨x(t ) − x(0)⟩ dt
(22)
D≡
1 d ⟨(x(t ) − x(0) − μt )2 ⟩ 2 dt
(23)
Figure 6. Minimum-energy path along the x direction of the twodimensional model potential defined in eq 21. Dashed lines correspond to the biased PES obtained using the bias function 6 with E = −0.61 and α = 0.12.
not even possible to get μ and D values from this simulation, as can be seen from the nonlinear dependence of the mean displacement in Figure 7.
The results are reported in the columns headed with the label MD in Table 1. It should be noticed that for a = 0 the diffusion coefficient obtained is in good agreement with the value of (4.5 ± 0.4) 10−5 reported previously by Voter.11 Table 1. Comparison between the Drift μ and Diffusion Coefficient D Obtained by MD, HD, and Hybrid HD−MDa μ (10−5)
D (10−5)
a
MD
HD−MD
HD
MD
HD−MD
HD
0 0.02 0.04 0.06 0.1
−0.02 0.44 0.89 1.34 2.30
0.08 0.49 0.83 1.38 2.46
0.05 0.61 1.07 1.56 −
4.43 4.41 4.31 4.47 4.53
4.82 4.98 5.20 5.44 6.16
5.03 4.89 5.10 5.20 −
Figure 7. Mean displacement along the x direction for the model potential of eq 21 computed using 500 trajectories from pure MD, a direct application of HD, and the hybrid HD−MD method.
The simulation time was fixed to 106 per trajectory. The dashes in the last row indicate that it was not possible to assign a constant value. a
Finally, we computed the drift and diffusion coefficient from 500 trajectories through the hybrid HD−MD method. The parameters for these simulations were B = 4, w = 0.9, and ϕ = 10−3. The results are also shown in Table 1, where a good agreement can be observed with the MD results even when a is relatively large. This agreement arises due to the capability of the method to recalibrate E and α, ensuring a constant boost factor along the trajectory. As was mentioned above, the differences with MD could be explained from the basis of the limitations of HD, which assumes TST to be valid. It is expected that as this difference increases with a, the probability of observing multiple crossing events also increases. Nevertheless, a linear dependence of the mean displacement with time is obtained in all of the studied cases, as can be see in Figure 7 for a = 0.1.
Table 1 also reports the drift and diffusion coefficient computed from 500 trajectories simulated with HD using the bias a function of eq 6 with E = −0.61 and α = 0.12 (the minimum-energy path along the x direction of the twodimensional model potential defined in eq 21 is shown in Figure 6). It can be noticed that for a = 0 there is a good agreement between the values obtained from MD and HD. The difference between these values can be taken as a consequence of the TST assumption on the HD framework, as was demonstrated in ref 11. On the other hand, when a ≠ 0, the direct implementation of HD led to an unbounded increase of the boost factor in the trajectories, ending in the poor sampling of the basins, the increment of the number of multiple crossing events, and the persistent violation of the zero bias conditions at the transition states. This can be clearly noticed in the case of a = 0.1, where the simulation time per trajectory (fixed to 106) is enough to achieve the described regimen. Furthermore, it is
8. TESTING THE METHOD FOR THE COALESCENCE OF NANOPARTICLES We present here the application of the hybrid HD−MD method to study the coalescence process of two metal 1730
DOI: 10.1021/ct5009729 J. Chem. Theory Comput. 2015, 11, 1725−1734
Article
Journal of Chemical Theory and Computation
HD Therefore, it is expected that B ≈ tHD and tb/t ≤ B because b /t of the simulation time spent in regular MD. Figure 9 shows a
nanoparticles (NPs) of 42 Au atoms and 13 Co atoms, respectively. The problem of NPs coalescence is a hot research area36−44 as it is the study of bimetallic NPs and their remarkable features.45−50 For the coalescence process presented here, the simulation results can be directly compared with those obtained from straightforward MD simulations performed in our previous work.31 Figure 8a presents an example of the energy profile for a hybrid HD−MD trajectory under the same initial conditions as
Figure 9. Boosted time tb vs integration time t for the hybrid HD−MD simulation of the coalescence process, using B = 10. Dashed lines show the expected slope for a pure MD simulation (blue) and for a pure (hypothetical) HD with a boost factor of 10 (orange).
plot of tb vs t, where it is possible to differentiate the periods of HD and MD simulations. It can be observed that the global slope of the simulation is higher than the slope of each MD stage but that it is lower than the slope of each HD period, which presents the desired B = 10. Figure 9 suggests a way to measure the power of a hybrid HD−MD simulation. It is possible to compare the input B HD value with the measured ratio tHD b /t . Simultaneously, it is also possible to compare the input w value with the fraction of HD steps with a positive value of the bias. We performed this comparison for a certain set of B and w parameters, as presented in Table 2. Better agreements are found for w = 0.5, Figure 8. (a) Energy trace for the same phenomenon of coalescence as that analyzed in Figure 1 but resulting from the hybrid HD−MD method. (b) The corresponding values of the bias. The time axis corresponds to the integration time (without taking into account the boost).
Table 2. Comparison between B and w Input Parameters and the Measured Equivalent Quantities from the Performed Hybrid Simulationsa
those of the results presented in Figure 1. The parameters of this simulation were B = 10, w = 0.5, and ϕ = 4 × 10⁻⁶. Note that until the first 5 ns are run, the energy traces of Figures 1 and 6 are the same. After this time, the HD begins, in synchrony with the plateau found in the FPP (Figure 2b). The yellow traces correspond to the equilibration steps, and the black dashed line denotes the on-the-fly computed value for E. Note that E is located close to the center of the energy trace, as expected for the input w = 0.5. It is important to note that the x axis corresponds to the integration time t (without boost) and not to the boosted time. In the latter case, the energy values appear to be spaced with irregular, longer time steps. Figure 8b shows the profile of the bias observed, and the horizontal dashed line indicates the ZM value computed on-the-fly. When the bias overcomes this threshold (t ≈ 8.5 ns), the HD is stopped, and the MD starts again. It can be noticed in this figure that during the equilibration steps ZM is overcome (t ≈ 5.1 ns) without leading to the HD switching off. It should be pointed out that there is an important difference between the global boost factor obtained by the HD−MD hybrid method and the boost factor obtained in each HD stage. We will call the integration time spent only in the HD periods tHD and the corresponding boosted time tHD b . On the other hand, we will call the total integration time of the hybrid HD− MD simulation t and the corresponding boosted time tb.
a
HD HD The slope tHD is obtained through a linear fit of the tHD plot. b /t b /t
which is consistent with the discussions given above. On the HD other hand, there are larger deviations of the ratio tHD from b /t the preset value of B for simulations with w = 0.3 and B > 10, as highlighted in red. These deviations indicate a too aggressive acceleration, which could lead to several issues, for example, bad statistics over tHD b (see ref 11). In addition to the simple test of Table 2, a full comparison between predicted and obtained energy distributions P(x), Pb(y), and PΔ(z) was performed. The histograms of potential energy for a HD simulation period and the corresponding histogram for the immediately preceding MD simulation are plotted in Figure 10 for differents w and B input parameters. The respective approximated P(x) and predicted Pb(y) densities are also shown in the plot. In all cases, the Gaussian shaped P(x) fits the main part of the MD energy distribution very well. In the case of Pb(y), a better agreement is found for energies below E. This can be understood considering that this portion of Pb(y) is predicted using the Gaussian approximation 1731
DOI: 10.1021/ct5009729 J. Chem. Theory Comput. 2015, 11, 1725−1734
Article
Journal of Chemical Theory and Computation
Figure 10. Energy distribution P(x) and Pb(x) for some w and B, as is indicated in each frame. Continuous lines correspond to the Gaussian fit (blue) and the prediction according to eq 10 (yellow). The dashed lines correspond to the histograms measured during the MD (black) and the subsequent HD (red) simulations.
Figure 11. (a) Distribution of waiting times for the formation of the final core−shell structure built from pure MD, taken as reference from our recent work.31 (b, c) Same as panel (a) but using integration and boosted times, respectively, obtained from the hybrid HD−MD simulations.
of P(x) (eq 14) at energies closer to X̅ , where the approximation is better.35 Far away from the center of P(x), as is the case for energies above E, the Gaussian approximation may not be good and therefore the predicted Pb(y) for these energies is expected to show some deviations, as can be seen in the figure. When w is small and/or B is big, the computed E could be many σ(X) times far from X̅ , and the discrepancy of Pb(y) above E is expected to be larger. For the same reason, similar discrepancies can be observed on the predicted distribution of the bias PΔ(z) near zero (see the Supporting Information), the region of the distribution related to P(x) with energies close to E. Despite these details, Figure 10 shows that a good overall prediction of Pb(y) may be obtained if suitable w and B parameters are selected carefully. The time behavior of a NP coalescence process was studied by straightforward MD in our previous work.31 In that work, a histogram of waiting times for the formation of the final core− shell structure was constructed using 256 MD trajectories. A replica of this histogram is shown in Figure 11a. Two peaks (labeled I and II) can be seen in this figure. In the aforementioned work, we found that peak II arises from some particular set of trapped states that delay the process of core−shell formation. In order to study the predictive power of the present method, we constructed the same histogram by means of hybrid HD−MD simulations. Therefore, with w = 0.5, B = 50, and ϕ = 7 × 10⁻⁶ as input parameters, 256 hybrid HD− MD simulations were performed with different random seeds and orientations of the initial NP, as was done in the reference work. Two kind of histograms may be constructed with the results of the present simulations: a histogram using the integration time t and a histogram using the boosted time tb. These two histograms are shown in Figure 11b,c, respectively. In the former, only a broad peak around 30 ns is found, and
there is no evidence for peak II. This means that in the hybrid simulations the trajectories can quickly escape from the trapped states associated with this peak. Moreover, it can be observed in Figure 11c that peak II reappears, so the presence of the trapped system is reflected after taking the boosted time into account. The occurrence of this peak is an exciting result, since it is an indication that accelerated dynamics may recover features of a very complex process, involving a large number of degrees of freedom (165).
9. CONCLUSIONS We propose an on-the-fly algorithm to switch between ordinary and accelerated molecular dynamics during the course of a simulation. This automatic interchange requires a minimal computational cost and allows the bias parameters to be adapted to the different trapped states visited by the system. Furthermore, this method prevents the application of the hyperdynamics scheme in evolution periods that do not fulfill the pseudoequilibrium conditions required for the validity of transition state theory. An analytical treatment of the different criteria imposed to regulate the algorithm was achieved by using a simple bias function, approximating the unbiased energy distribution by a Gaussian function. Even with this approximation, the method successfully predicts the long-time characteristics of the coalescence process of two metallic nanoparticles (165 degrees of freedoms). As far as we know, this is the first time that a hyperdynamics scheme using a bias potential of the type given in eqs 5 and 6 has been used to recover relevant time information for such a complex process. 1732
DOI: 10.1021/ct5009729 J. Chem. Theory Comput. 2015, 11, 1725−1734
Article
Journal of Chemical Theory and Computation
it starts. As is shown in the present work, some conditions to achieve well-behaved acceleration or even the desired boost factor can be fixed in this way. Let us define Z as the random variable associated with the bias values observed during the HD simulation. The Z values arise by sampling Y through the function
The present results on nanoparticle coalescence heuristically show that it is possible to obtain sets of trajectories where the kinetics of particle coalescence is mostly preserved, even for this complex system. On the other hand, many hyperdynamic strategies that formally guarantee the conditions of bias nullity at the transition state are not sufficiently computationally efficient to take advantage of the acceleration obtained. Thus, although the present methodology is clearly not the optimal one concerning hyperdynamics, it opens the possibility of observing many relevant trajectories using a computationally efficient method, without the need to define a particular set of collective variables. Further research is desirable to analyze the applicability of the present methodology to other complex systems.
■
Z ≡ Y − f −1 (Y ) ≡ h(Y )
It is possible to use this function with the random variable transformation theorem51 to obtain the distribution function PΔ(z) of Z from Pb(y) ∞
PΔ(z) =
Prediction of the HD Energy Distribution
■
The density of states of the unbiased and biased systems are, respectively, given by
ω b(y) ≡
∫Ω δ(x − U(r)) dr ∫Ω δ(y − Ub(r)) dr
■
(25)
*E-mail:
[email protected]. Funding
(26)
We acknowledge financial support from CONICET PIP (11220110100992), Secyt Universidad Nacional de Córdoba, Program BID (PICT-2012-2324), and PME (2006-01581). Notes
The authors declare no competing financial interest.
■
(27)
∞
∫−∞ ∫Ω
=
∫Ω δ(y − f (U(r))) dr
δ(x − U (r)) δ(y − f (x)) dr dx
= ω b(y)
(29) (30)
Q Qb
∞
∫∞
P(x) e−β(y − x) δ(y − f (x)) dx (31)
which relates the probability distribution of variables X and Y. If the function f(x) is invertible, then a special case of eq 31 arises by changing the variable of integration through x = f−1(y′) Pb(y) =
−1 Q −β(y − f −1 (y)) df (y) e P(f −1 (y)) Qb dy
REFERENCES
(1) Free Energy Calculations: Theory and Applications in Chemistry and Biology; Chipot, C., Pohorille, A., Eds.; Springer: Berlin, 2007. (2) Chipot, C. Wiley Interdiscip. Rev.: Comput. Mol. Sci. 2014, 4, 71. (3) Hansen, N.; van Gunsteren, W. F. J. Chem. Theory Comput. 2014, 10, 2632. (4) Wales, D. J.; Bogdan, T. V. J. Phys. Chem. B 2006, 110, 20765. (5) Abrams, C. F.; Vanden-Eijnden, E. Chem. Phys. Lett. 2012, 547, 114. (6) Maragliano, L.; Vanden-Eijnden, E. J. Chem. Phys. 2008, 128, 184110. (7) Maragliano, L.; Fischer, A.; Vanden-Eijnden, E.; Ciccotti, G. J. Chem. Phys. 2006, 125, 24106. (8) Maragliano, L.; Vanden-Eijnden, E. Chem. Phys. Lett. 2006, 426, 168. (9) Laio, A.; Gervasio, F. L. Rep. Prog. Phys. 2006, 71, 126601. (10) Darve, E.; Rodríguez-Gómez, D.; Pohorille, A. J. Chem. Phys. 2008, 128, 144120. (11) Voter, A. F. J. Chem. Phys. 1996, 106, 4665. (12) Voter, A. F. Phys. Rev. Lett. 1997, 78, 3908. (13) Torrie, G.; Valleau, J. J. Comput. Phys. 1977, 23, 187. (14) Kim, S. Y.; Perez, D.; Voter, A. F. J. Chem. Phys. 2013, 139, 144110. (15) Tiwary, P.; van de Walle, A. Phys. Rev. B 2011, 84, 100301. (16) Xin, Y.; Doshi, U.; Hamelberg, D. J. Chem. Phys. 2010, 132, 224101. (17) Kim, W. K.; Falk, M. L. Modell. Simul. Mater. Sci. Eng. 2010, 18, 034003. (18) Fichthorn, K. A.; Miron, R. A.; Wang, Y.; Tiwary, Y. J. Phys.: Condens. Matter 2009, 21, 084212.
(28)
This equation sets the relationship between the density of states of the biased and unbiased systems and can be used together with eqs 8 and 9 to obtain Pb(y) =
AUTHOR INFORMATION
Corresponding Author
∞
=
ASSOCIATED CONTENT
Predicted and obtained PΔ(z) distribution of the magnitude of the bias for some w and B parameters. This material is available free of charge via the Internet at http://pubs.acs.org.
Then, the number of states with energy y = Ub(r) can be also recovered by taking into account all of the energies x = U(r) that satisfy eq 26. In other words
∫−∞ ω(x) δ(y − f (x)) dx
(34)
S Supporting Information *
(24)
where Ω denotes the configuration space. If the bias function used is an energy-based bias function (eq 4), then it is possible to write Ub(r) = U (r) + g (U (r)) ≡ f (U (r))
∫−∞ Pb(y) δ(z − h(y)) dy
Then, PΔ(z) can be predicted by computing Pb(y) from the MD simulation via eq 31 or, in the case of the bias function used in this work, replaced in eq 10 to obtain eq 18.
APPENDIX
ω(x) ≡
(33)
(32)
This is the case of the bias function presented in eq 6, used in this work. The use of this bias function in the above equation leads to eq 10. Equation 32, or even the more general case of eq 31, gives the possibility of predicting any property of the biased system that depends on its energy distribution. This could be used to improve the simulation parameters of the HD simulation before 1733
DOI: 10.1021/ct5009729 J. Chem. Theory Comput. 2015, 11, 1725−1734
Article
Journal of Chemical Theory and Computation (19) Perez, D.; Voter, A. F. Accelerating atomistic simulations through self-learning bond-boost hyperdynamics; Los Alamos National Laboratory: Los Alamos, NM, 2008; http://permalink.lanl.gov/object/ tr?what=info:lanl-repo/lareport/LA-UR-08-05519. (20) de Oliveira, C. A. F.; Hamelberg, D.; McCammon, J. A. J. Chem. Theory Comput. 2008, 4, 1516. (21) Becker, K. E.; Fichthorn, K. A. J. Chem. Phys. 2006, 125, 184706. (22) Hamelberg, D.; Shen, T.; McCammon, J. A. J. Chem. Phys. 2005, 122, 241103. (23) Hamelberg, D.; Mongan, J.; McCammon, J. A. J. Chem. Phys. 2004, 120, 11919. (24) Miron, R.; Fichthorn, K. Phys. Rev. Lett. 2004, 93, 128301. (25) Miron, R. A.; Fichthorn, K. A. J. Chem. Phys. 2003, 119, 6210. (26) Sminchisescu, C.; Triggs, B. Computer VisionECCV 2002: 7th European Conference on Computer Vision, Copenhagen, Denmark, May 28−31, 2002; Heyden, A., Ed.; Springer: Berlin, 2002; Vol. 2350, p769. (27) Wang, J.-C.; Pal, S.; Fichthorn, K. A. Phys. Rev. B 2001, 63, 085403. (28) Gong, X.; Wilkins, J. Phys. Rev. B 1999, 59, 54. (29) Pal, S.; Fichthorn, K. A. Chem. Eng. J. 1999, 74, 77. (30) Steiner, M.; Genilloud, P.-A.; Wilkins, J. Phys. Rev. B 1998, 57, 10236. (31) Paz, S. A.; Leiva, E. P. Chem. Phys. Lett. 2014, 595−596, 87. (32) Flyvbjerg, H.; Petersen, H. G. J. Chem. Phys. 1989, 91, 461. (33) Chen, F.; Curley, B. C.; Rossi, G.; Johnston, R. L. J. Phys. Chem. C 2007, 111, 9157. (34) Kent, I.; David, R.; Muller, R.; Anderson, A.; Goddard, W., III; Feldmann, M. J. Comput. Chem. 2007, 28, 2309. (35) Reif, F. Fundamentals of Statistical and Thermal Physics; McGraw-Hill: Tokyo, 1965. (36) Mariscal, M. M.; Mayoral, A.; Olmos-Asar, J. A.; Magen, C.; Mejía-Rosales, S.; Pérez-Tijerina, E.; Yacamán, M. J. Nanoscale 2011, 3, 5013. (37) Zheng, H.; Smith, R.; Jun, Y.-W.; Kisielowski, C.; Dahmen, U.; Alivisatos, A. P. Science 2009, 324, 1309. (38) Liu, H.; Yacamán, M. J.; Perez, R.; Ascencio, J. A. Appl. Phys. A: Mater. Sci. Process. 2003, 77, 63. (39) Yacamán, M. J.; Gutierrez-Wing, C.; Miki, M.; Yang, D.-Q.; Piyakis, K. N.; Sacher, E. J. Phys. Chem. B 2005, 109, 9703. (40) Paz, S. A.; Leiva, E. P. M.; Jellinek, J.; Mariscal, M. M. J. Chem. Phys. 2011, 134, 094701. (41) Mariscal, M. M.; Oldani, N. A.; Dassie, S. A.; Leiva, E. P. M Faraday Discuss. 2008, 138, 89. (42) Ferrando, R.; Jellinek, J.; Johnston, R. L. Chem. Rev. 2008, 108, 845. (43) Mariscal, M. M.; Dassie, S. A.; Leiva, E. P. M J. Chem. Phys. 2005, 123, 184505. (44) Baletto, F.; Ferrando, R. Rev. Mod. Phys. 2005, 77, 371. (45) Khanal, S.; Spitale, A.; Bhattarai, N.; Bahena, D.; VelazquezSalazar, J. J.; Mejía-Rosales, S.; M Mariscal, M.; José-Yacaman, M. Beilstein J. Nanotechnol. 2014, 5, 1371. (46) Bochicchio, D.; Ferrando, R. Phys. Rev. B 2013, 87, 165435. (47) Rapallo, A.; Olmos-Asar, J. A.; Oviedo, O. A.; Ludueña, M.; Ferrando, R.; Mariscal, M. M. J. Phys. Chem. C 2012, 116, 17210. (48) Parsina, I.; DiPaola, C.; Baletto, F. Nanoscale 2012, 4, 1160. (49) Parsina, I.; Baletto, F. J. Phys. Chem. C 2010, 114, 1504. (50) Langlois, C.; Li, Z. L.; Yuan, J.; Alloyeau, D.; Nelayah, J.; Bochicchio, D.; Ferrando, R.; Ricolleau, C. Nanoscale 2012, 4, 3381. (51) Gillespie, D. Am. J. Phys. 1983, 51, 520.
1734
DOI: 10.1021/ct5009729 J. Chem. Theory Comput. 2015, 11, 1725−1734