Tomographic observation of transparent objects under coherent illumination and reconstruction by filtered backprojection and. Fourier diffraction theorem.
Tomographic observation of transparent objects under coherent illumination and reconstruction by filtered backprojection and Fourier diffraction theorem Stanislas Vertu†, Ichiro Yamada†, Jean-Jacques Delaunay†, Olivier Haeberlé‡ †Department of Engineering Synthesis, School of Engineering, The University of Tokyo, 7-3-1 Hongo Bunkyo-ku, Tokyo 113-8656, Japan ‡Laboratory MIPS – University of Haute Alsace, IUT Mulhouse, 61 rue Albert Camus, 68093 Mulhouse Cedex, France
ABSTRACT We report first results in the comparison between filtered backprojection reconstruction and Fourier diffraction theorem reconstruction of transparent spherical samples using a diffractive optical microtomography instrument. A brightfield transmission microscope was modified to form a Mach-Zehnder interferometer that was used to generate phase-shifted holograms recorded in image plane. Transparent objects mixed with an index matching medium were inserted into a microcapillary and holograms of these objects were taken under different view angles by rotating the microcapillary. Precise rotation of the microcapillary was accomplished by clipping the microcapillary in a precisely machined Vgroove, a system that when combined with software correction of the object centre achieved a precision of object positioning on the order of a micrometer. Tomography of weakly diffracting objects was performed and the observed objects were reconstructed by two methods namely, the filtered backprojection method and the Fourier diffraction method. In the filtered backprojection reconstruction, the 3-D distribution of the refractive index was computed from the tomography of the object phase. In the Fourier diffraction reconstruction, the 3-D distribution of the scattering potential was computed by 3-D Fourier transform of the mapping of the object spatial frequencies. It was confirmed that the Fourier diffraction reconstruction based on the first order Born approximation is limited to small phase changes. In contrast, the backprojection performed well on large phase changes, but dramatically failed to reconstruct diffractive objects by generating reconstruction line artifacts that spread from the diffractive object to other nearby objects. Weakly diffractive polymer beads exhibiting small phase changes were correctly reconstructed by both methods, the Fourier diffraction method giving sharper edges than the filtered backprojection method. Keywords: Three-dimensional microscopy, coherent tomography, holography, filtered backprojection, phase-shifting, diffractive optical tomography, reconstruction algorithm
1. INTRODUCTION Microscopic techniques have rapidly evolved to meet new requirements of contemporary biomedical science for improved spatial resolution and accurate three-dimensional information. Particularly, super resolution microscopes such as 4Pi and stimulated emission depletion microscopes have offered tremendous improvements with regard to spatial resolution [1] and are now being used in research laboratories to image fluorescent samples. In the area of three dimensional imaging, diffractive tomographic microscopes have recently attracted interest because of their potential ability to deliver accurate three dimensional images of phase objects much needed in imaging transparent biological samples without staining and sectioning. Sample staining is commonly applied in the observation of biological specimen such as fixed/living cells and tissues because of the inherent low refractive index contrast in the structure of
these samples. Sample sectioning is useful in reducing the out-of-focus noise generated by thick samples and is commonly used in histology. Diffractive microtomography overcomes these two problems by the combination of phase detection and tomography that makes possible the measurement of scattered fields under various view angles. Diffractive tomography theoretically allows for the observation of complete cells as well as arrangement of cells in three dimensions. Although the theory of diffractive tomography was established long ago by Wolf [2, see also 3], only few attempts have been made up to now to realize such an instrument [4-7]. In this study, we report first results in the development of a diffractive optical microtomography instrument that uses sample rotation to measure the scattered fields from the observed transparent samples over a wider collecting angle than conventional transmission microscopes which are limited by the numerical aperture of their objectives. The observed transparent objects are treated as weakly diffracting and a preliminary comparison between filtered backprojection tomography reconstruction and Fourier diffraction theorem reconstruction is presented. In the first case, the reconstruction is done by backprojecting the measured phase of the scattered field. In the second case, the object is reconstructed by a three dimensional mapping of spherical caps of the object frequencies.
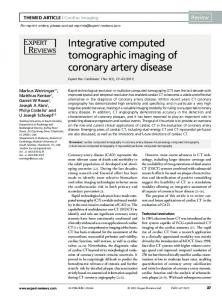
2. EXPERIMENTAL PROCEDURE The setup of our diffractive tomographic microscope using coherent illumination and a sample rotation stage is described in Fig. 1. Holograms of the same transparent object taken under different view angles were recorded using a Mach-Zehnder type interferometer. The object was illuminated by a polarized plane wave obtained by spatial filtering of a polarized He-Ne laser beam (_ = 632.8nm). The spatial filter consisted of an objective lens, a very small pinhole and a low f-number lens that were used to approximate a plane wave. An infinity-corrected microscope objective (20×, 0.4 NA) with its associated tube lens were used to form an image of the object in the plane of the CCD detector. The illumination plane wave was focused in the back focal plane of the microscope objective which was put at the focal point of the tube lens, forming a plane wave on the CCD detector. Holograms resulting from the interference between the wave scattered from the sample and the reference wave were recorded on the CCD detector. The black and white CCD had a sensor array of 2456 × 2058 pixels of which 601 × 601 were used, with a pixel size of 3.45 × 3.45 µm2. To improve the contrast of the fringes in the measured holograms, the intensity of the reference beam was adjusted so as to be of the same order with that of the scattered intensity. This was achieved by rotating a half-wavelength plate inserted in the reference beam before the polarizer P of Fig 1(a). The observed object was rotated by a 1.8° step covering a rotation of 180° for the backprojection reconstruction and 360° for the Fourier diffraction reconstruction, thus collecting holograms for 100 and 200 view angles, respectively. A computer controlled the rotation of the sample holder by using a stepper motor and collected the phase-shifted holograms. The phase and the amplitude of the scattered wave were retrieved from the measurement of four quadrature-reference hologram intensities I1 , I 2 , I 3 , I 4 taken by phase-shifting the reference beam by 0, !/2, ! and 3!/2 (e.g. [8]). The complex scattered wave A(x, y )exp(iϕ (x, y )) is given as a function of the four measured holograms I1 , I 2 , I 3 , I 4 and the reference beam amplitude R :
1 ∂ 3∂ RI1 + RI 2 exp i + RI 3 exp(i∂ )+ RI 4 exp i . (1) 2 2 4R 2 The phase of the reference wave was varied using a piezoelectric transducer that shifted mirror M3 of Fig. 1. The method ensures that the twin-image associated with in-line holography is cancelled. Further, averaging over five measurements of the intensity of the holograms I1 , I 2 , I 3 , I 4 was performed to reduce the noise. A(x, y )exp(iϕ (x, y ))=
(a)
(b)
Figure 1: Principle of diffractive optical coherent microtomography with specimen rotation: (a) Schematic of the experimental setup used to record holograms of the same object under different view angles and (b) Rotation stage using a microcapillary clipped in a V-groove. Legend: M1, M2 and M3, Mirrors; MO, Microscope Objective; SF, Spatial Filter; L1, Lens; B1 and B2, cube Beamsplitters; PZT, Piezoelectric Transducer; P, Polarizer; _/2, half wavelength plate. The sample holder, a schematic of which is shown in Fig. 1(b), consisted of a microcapillary fixed on a rotating stage (axis of rotation x). The sample to be observed was mixed with an optical gel with a refractive index of 1.46 and filled in the microcapillary tube. The refractive index of the gel was chosen to be close to that of specimen. The refractive index of the micro-capillary tube matched that of the gel, so that light refraction by the curved inner wall of the microcapillary was kept to a minimum. The same was achieved for the micro-capillary outer wall by dipping the microcapillary in a spectroscopic cuvette filled with an index matching fluid (glycerol). The refractive indices of the microcapillary tube, the spectroscopic cuvette, the gel, and the cuvette fluid were matched within 0.01. The rotation of the micro-capillary tube filled with the sample in a gel is accomplished with a stepper motor controlled by the computer. The stepper motor is fixed onto an xyz stage that was used to bring the sample in the field of view and into focus. The micro-capillary tube was inserted into a high-precision chuck which was attached on the axis of the stepper motor. Undesirable displacements of the micro-capillary during rotation were minimized by inserting the micro-capillary in a precisely machined V-groove which served as a guide for the microcapillary. The V-groove guide reduced the displacements of the microcapillary to a few micrometers. A numerical procedure that corrected for the undesirable displacements of the centre of the transparent object was further applied on the recorded holograms. After correction of the sample centre by the numerical procedure, the accuracy of the sample position on its rotation axis was estimated to be on the order of one micrometer. The objects investigated in this report, were transparent polymer beads (Sekisui Techpolymer MBX-30) having a broad size distribution centered on 27 µm with a standard deviation of 8 µm. Beads were mixed in an optical gel and filled in a microcapillary tube having an inner diameter of 140 µm and an outer diameter of 570 µm. An image of the fabricated sample consisting of a large bead with a diameter of about 30 µm and 3 smaller beads with diameters ranging from 3 to 8 µm is shown in Fig. 2. Around the large bead, a different object, referred to as satellite in the following, can be seen. This satellite object which was unintentionally introduced in the microcapillary brought a very interesting point to this study because it was found to be more diffractive than the polymer beads. This highly diffractive object emphasized the effect of diffraction in the two reconstruction methods and thus made the differences apparent between the two reconstruction results obtained with the filtered backprojection algorithm, which neglects diffraction, but is better adapted for larger objects, and the Fourier diffraction theorem, which takes diffraction into account, but is limited to small phase changes.
Figure 2: Real part of the measured complex scattered wave obtained by phase-shifting using Equation 1. The region of the recorded data used in the reconstructions is indicated by the white square in which the 5 studied objects can be recognized. The inner walls of the microcapillary are detected as vertical lines in the figure.
3. FILTERED BACKPROJECTION RECONSTRUCTION METHOD In this section, we briefly review the reconstruction method of the refractive index n(x, y, z ) of a transparent object from the measurement of the phases ϕ (x, y ) in the plane xy when the sample is rotated around x. For a weakly diffracting object, the optical path length of the illumination light across the specimen remains parallel to the optical axis z. Under such conditions, the phases obtained by phase-shifting can be taken to be directly proportional to the optical path length, which is related to the three dimensional refractive index distribution difference Δn(x, y, z ) between the observed object and its surrounding medium. The phase is given by [7]: 2π (2) ϕ (x, y ) = Δn(x, y, z )dz . λ For each rotation step of 1.8°, the complex scattered wave was computed from holograms recorded by phase-shifting holography. The phase unwrapping algorithm ΖπM [10] was applied to remove the phase jumps (modulo-2! variations) on the computed phases ϕ (x, y ). Finally, zero padding was applied on the unwrapped phase images to improve the resolution. The final size of the phase images was increased by a factor of two as a result of the zero padding. The three dimensional angular set of phases ϕ (x, y ) can then be backprojected to reconstruct the three dimensional distribution of the refractive index difference of the observed sample. The implementation of the filtered backprojection was realized in MATLAB using the inverse radon transform in a slice-by-slice implementation with a ramp filter modulated by a sinc function.
∫
4. FOURIER DIFFRACTION THEOREM RECONSTRUCTION METHOD In this section, we briefly review the theoretical reconstruction method of the complex refractive index n(x, y, z ) of a weakly scattering object from the measurement of its complex scattered waves in the plane xy when the sample is rotated around the x axis. Diffraction by weakly scatterers can be treated within the framework of the first-order Born approximation that gives an approximated solution to the inverse scattering problem. The situation is depicted in Figure (i )
(s )
3(a), where U is the incident field and U is the scattered field. The field incident on the weakly scattering object is taken as a monochromatic plane wave of unit amplitude and wavelength λ , propagating in the direction specified by the wave vector
r r r ki = k ⋅ si , where k = 2π / λ and si is a unit vector. The expression for the incident field is
r r r r r U (i ) (r ) = ei k i ⋅r . The scattered field propagating in the direction sd has a wave vector k d = k ⋅ sd . Born and Wolf [11]
have shown that within the first-order Born approximation and in the far zone approximation ( kr
r r expression for the scattering field f ( sd , si ) is: r r r r r r v f ( sd , si ) = ∫∫∫ F (r ' ) e − i k ( sd −si )⋅r ' d 3 r ' ,
→ ∞ ), the
(3)
V
r where F (r ′) = k 2 n(x′, y′, z′)2 − 1 is the scattering potential of the object which varies with the square of the complex
(
)r
r ' is a vector describing the volume V of the scatterer. r r r By introducing the vector K = k ( sd − si ) in Equation 3, the scattered field can be expressed as the Fourier transform r of the scattering potential evaluated at K : refractive index of the object and
r r ~ r f (sd , si )= F ( K ) =
∫∫∫
r r r r F ( r ' ) e − iK ⋅ r ' d 3 r ' .
(4)
V
r K describes the different subsets for which the scattering r potential frequency can be obtained from the scattered field. The region of the frequency domain described by the K -vectors forms a sphere called the Ewald sphere The vector
which is shown in Fig. 3(b). Equation 4 provides a very powerful relation between a quantity that can be determined by r r ~ r measurements f ( sd , si ) and a quantity that is related to the complex refractive index of the object F ( K ) . In other words, by illuminating a weakly scattering object by a plane wave having direction field in direction
r si , the knowledge of the scattered
r sd in the far field and the incident field allows to reconstruct a three-dimensional subset of the object
refractive index distribution in the frequency domain. The measure of the scattered field in all possible illumination directions and all possible diffraction directions make possible to completely cover the Ewald limiting sphere shown in Fig. 3(b) and therefore obtain an isotropic spatial resolution.
Figure 3: Representation of incident and diffused vectors in the object and frequency spaces. (a) Definition of the propagation vector of the scattered light from a medium of volume V . (b) Two dimensional representation of the Ewald limiting sphere Σ L and the support of the Ewald sphere Σ 0 , the radius of which is the wavenumber of the incident light. Σ 0 represents all possible directions of incidence and Σ L is the largest frequency domain covered by the scattered vectors when all possible incidence directions are mapped. A σ Ewald sphere represents all possible scattered directions for one illumination direction. Note that a transmission microscope collects at best half of the σ spheres. Considering now a microtomography setup in transmission, the relation between the measured scattered field and the Fourier transform of the projected data is shown in Fig. 4(a-b). The Fourier transform values in the diffractive case are
along an arc when a two dimensional representation is used. Experimentally, the wave scattered by a weakly scattering object can be recorded on the surface of an image sensor. Under the first-order Born approximation, this measured scattered field is interpreted as a two dimensional spherical subset of the Fourier transform of the sample scattering potential distribution. This spherical subset of the Fourier transform is limited by the NA of the detection system as illustrated in Fig. 4. By rotating the sample with a fixed illumination (constant vector
r ki ), different subsets of the three-
dimensional frequency distribution of the object scattering potential can be mapped (see Fig. 4(d)).
Figure 4: Mapping representation of the object frequencies in the case of scattered light collected in transmission and of an object rotation along the z -axis. (a) The object scattered frequencies collected through the objective numerical aperture for an incident plane wave of wave vector
r ki lie on the surface of a spherical cap. (b) The
Fourier transform of the object scattering potential are distributed over the surface of a spherical cap, the top of which coincides with the frequency origin. (c) Spherical caps of the object scattering frequencies mapped for θ = 0 and θ ≠ 0 . The extended support of the mapped frequencies is obtained by integrating over a large number of rotation angles. Slices of the extended supports are shown at (d). The regions of the frequency domain covered by rotating the object are shown in light gray. For each rotation step of 1.8°, the complex scattered wave was computed from holograms recorded by phase-shifting holography. Then a Fourier transform of the hologram is computed in order to obtain a 2-D set of spatial frequencies and the object spatial frequencies are mapped onto the corresponding cap of the Ewald sphere support. By repeating this process for each rotation, an extended support of the spatial frequencies of the object is obtained as illustrated in Fig. 4(c-d). A final 3-D inverse Fourier transform gives the 3-D distribution of the scattering potential of the object.
5. RECONSTRUCTION RESULTS The microtomographic reconstructions of the objects depicted in Fig. 2 are shown in Fig. 5 and Fig. 6, using the backprojection method and the Fourier diffraction method, respectively. The same dataset is used for both the backprojection and the diffraction reconstructions, except for the number of views used. 100 views recorded from 0 to 180° were used in the filtered backprojection method whereas 200 views recorded from 0 to 360° were used in the diffraction method. This is because in the backprojection method, the same information is supposed to be recorded if the object is rotated by 180°: the integration along the light path in Eq. 2 is identical by a 180° rotation. In the diffraction method, rotating the object by 180° yields a different subset of the 3-D Fourier transform of the object (see Fig. 4).
Figure 5: Tomography of polymer beads showing the 3-D distribution of the refractive index difference with the surrounding medium (optical gel). The filtered backprojection reconstruction was performed using the iradon function of the MATLAB environment. The main view (top view) shows a section along the yz plane in the middle of the large bead. The side views show sections at different positions in the bead along the xz plane. The front views show sections along the xy plane. In the backprojection method results shown in Fig. 5, it is seen that the 4 polymer beads were reconstructed with a correct spherical shape, but that the satellite could not be accurately reconstructed. Indeed, sharp reconstruction lines converging to the satellite position are observed in the top view, strongly suggesting that the satellite was too diffractive to apply a backprojection technique. It should be noted that the spherical shape of the beads was well reproduced although the beads were not centered within the microcapillary. This result is explained by the reconstruction procedure, which ensures that the measured data are properly re-adjusted with respect to the microcapillary, considered to be a perfect cylindrical object [12]. The resolution is estimated from Fig. 5, by measuring the transition between the surrounding medium and the bead, which gives a resolution of the order of 1 µm. The holographic acquisition combined with the inverse Radon reconstruction also allows for measurements of the refractive index distribution within the object, a physical quantity, which is not, or hardly available from conventional transmission microscopes. From the reconstructed data of Fig. 5, a difference in refractive index of 0.024 is measured between the large polymer bead and the microcapillary. This refractive index difference is in agreement to within ±0.006 with the difference obtained from the manufacturers’ reported refractive index values for the polymer bead index (1.49) and the optical gel index (1.46). Note that small variations (~0.004) in the refractive index of the large bead are seen in the form of a shallow concentric disk, which may be due either to small errors in the unwrapping of the phase, or to non accounted diffraction effects that mostly occurs at the edge of the bead.
Figure 6: Tomography of polymer beads showing the 3-D distribution of the real part of the scattering potential with the surrounding medium (optical gel). The Fourier diffraction theorem reconstruction method was used. The main view shows a section along the yz plane in the middle of the main bead. The side views show sections at different positions in this bead along the xz plane and the front views show sections along the xy plane. The sections in Fig. 5 and 6 are taken at the same planes. In the Fourier diffraction method results shown in Fig.6, it was found that the major morphological features of the objects were resolved by the diffraction reconstruction method except for the inner structure of the large bead and the shape of the satellite. These still imperfect results may have been caused by phase jumps and/or a lack of accuracy in the sample positioning due to undesirable displacements of the micro-capillary during rotation. The application of the Fourier diffraction theorem implies that the first order Born approximation is satisfied, for which a necessary condition is that the change in phase between the incident field and the wave propagating through the object should be less than ! in the case of cylindrical objects [13]. In the case of the large bead, the maximum phase difference we observed is actually slightly larger than 2π and therefore 1 phase jump occurs. However, the Fourier diffraction theorem reconstruction method is perfectly suitable for smaller weakly diffractive objects as one can conclude from Fig. 6 showing the three small beads. These beads not only are well reconstructed, but also exhibit sharper edges than those obtained in the filtered backprojection sections. This constitutes a strong indication that indeed the achievable resolution with the diffraction reconstruction method is better than with the backprojection method, which furthermore may also lead to shape artifacts in the reconstruction, as demonstrated by Gorski and Olsten [14]. As for the diffractive satellite object is concerned, the diffraction reconstruction method does not lead to reconstruction line artifacts as in the backprojection method. However the maximal size of the studied weakly diffracting objects used for the reconstruction should be decreased so that no phase jump occurs. In future work the relation between the object scattering potential and the object complex refractive index will be investigated. In both reconstruction methods, the region lying along the rotation axis is slightly blurred. This artifact apparently generated slight deformation of the shape of the large bead having an oblong shape instead of the expected spherical shape for sections containing the axis of rotation. The origin of this effect has not yet been clarified.
6. CONCLUSIONS Microtomography of phase objects under coherent illumination was performed using a Mach-Zehnder interferometer build from commercially available microscope components. Precise rotation of the sample was achieved by a specially developed rotation stage using a microcapillary clipped in a precisely machined V-groove. The observed objects were mixed with an optical gel and filled in a microcapillary that was optically matched to the gel index. For each view angle, phase-shifted holograms were recorded in image plane from which the complex scattered wave from the object was computed. Two tomographic reconstruction methods, namely the filtered backprojection method and the Fourier diffraction reconstruction method, were tested using the same measured dataset. For the filtered backprojection reconstruction method, the phases of the scattered waves were calculated and unwrapped. The set of phases obtained under different view angles was then backprojected using a standard inverse radon transform, the projection from which the three dimensional distribution of the refractive index difference between the sample and its surrounding was imaged. The difference between the refractive index of a polymer bead and the surrounding medium was found to be in good agreement with the reported index values, having an error of Δn = 0.006 . While the size of the beads did not affect the reconstruction results, small and strongly diffractive objects could not be accurately reconstructed by this method and generated sharp reconstruction lines interfering with the reconstruction of nearby objects. For the Fourier diffraction reconstruction method, a Fourier transform of the complex hologram was computed in order to obtain a 2-D set of the object spatial frequencies which was mapped onto the corresponding cap of the Ewald sphere support. By repeating this process for each rotation step, an extended support of the object spatial frequencies was obtained. A final 3-D Fourier transform gave the 3-D scattering potential of the object. The three small polymer beads were reconstructed with sharper borders than those of the backprojection reconstruction results. The large bead, however, was not properly reconstructed because of phase jumps that are not accounted for in the diffraction algorithm. Also the smallest diffractive object could not be resolved, but in contrast to the backprojection results no reconstruction line artifacts were generated. We now plan to improve the quality of the reconstructed images by decreasing the positioning error of the sample by using an active positioning technique and reducing the acquisition speed by using an electro-optical modulator to vary the reference beam phase.
REFERENCES 1. 2. 3. 4. 5. 6. 7. 8. 9. 10. 11. 12. 13. 14.
S. W. Hell “Far-field optical nanoscopy, ” Science 316, 1153-1158 (2007). E. Wolf, “Three-dimensional structure determination of semi-transparent objects from holographic data,” Opt. Commun. 1(4), 153-156 (1969). R. Dändliker, K. Weiss, “Reconstruction of the three-dimensional refractive index from scattered waves,” Opt. Commun. 1(7), 323-328 (1970). N. Streibl, “Three-dimensional imaging by a microscope,” J. Opt. Soc. Am. A 2, 121-127 (1985). S. Kawata, O. Nakamura, S. Minami, “Optical microscope tomography,” J. Opt. Soc. Am. A 4, 292-297 (1987). V. Lauer, “New approach to optical diffraction tomography yielding a vector equation of diffraction tomography and a novel tomographic microscope,” J. Microsc. 205, 165-176 (2002). B. Simon, M. Debailleul, V. Georges, O. Haeberle, V. Lauer, “Three dimensional reconstruction of transparent specimen using coherent optical diffraction tomography,” 5th Workshop on Physics in Signal and Image Processing, Mulhouse, France, January 31 – February 2, 2007, Proceedings of PSIP’07 - CD-ROM ISBN 2-912328-40-3. S. Lai, B. King, and M. A. Neifeld, “Wave front reconstruction by means of phase-shifting digital in-line holography,” Opt. Commun. 173, 155-160 (2000). F. Charriere, A. Marian, F. Montfort, J. Kuehn, T. Colomb, E. Cuche, P. Marquet, C. Depeursinge, “Cell refractive index tomography by digital holographic microscopy,” Opt. Lett. 31(2), 178-180 (2006). J. M. B. Dias and J. M. N. Leitão, “The ΖπM algorithm: A Method for interferometric image reconstruction in SAR/SAS,” IEEE Trans. Image Process. 11(4), 408-422 (2002). M. Born and E. Wolf, “Principles of Optics,” Chapter XIII, Pergamond Press, 1991. S. Vertu, M. Ochiai, M. Shuzo, I. Yamada, J.-J. Delaunay, O. Haeberle, Y. Okamoto, “Optical projection microtomography of transparent objects,” Proc. SPIE 6627, 66271A (2007). A.C. Kak and M. Slaney, “Principles of Computerized Tomography Imaging,” IEEE Press, New York, 1987. W. Gorski and W. Olsten “Tomographic imaging of photonic crystal fibers,” Opt. Lett. 32, 1977-1979 (2007).