amount almost equal to the Doppler shift in the echo. This maneuver, called Doppler- shift compensation (15, 22, 24), allows the bat to hold the frequencies of ...
AS J CONTENTS OF VOLUME 45
UniversitätsBSbÜüthek München
N O . 1, J A N U A R Y 1981 Electrotonic Structure and Specific Membrane Properties of Mouse Dorsal Root Ganglion Neurons T. H. Brown D. H. Perkel J. C. Norris J. H. Peacock
Characteristics of Neurons in Auditory Cortex of Monkeys Performing a Simple Auditory Task B. E. Pfingst T. A. O'Connor
16
Comparison of Response Properties of Inferior Colliculus Neurons of Two Inbred Mouse Strains Differing in Susceptibility to Audiogenic Seizures / . F. Willott
35
Responses of Single Neurons in Physiologically Defined Primary Auditory Cortex ( A I ) of the Cat: Frequency Tuning and Responses to Intensity D. P. Phillips D. R. F. Irvine
48
Thalamic Input to Areas 3a and 2 in Monkeys D. P. Friedman E. G. Jones
59
Afterpotential Generation in Hippocampal Pyramidal Cells R. K. S. Wong D. A. Prince
86
Comparative Aspects of Neural Circuits for Inking Behavior and Gill Withdrawal in Aplysia californica J. H. Byrne
98
Spatial Tuning of Cells In and Around Lateral Geniculate Nucleus of the Cat: X and Y Relay Cells and Perigeniculate Interneurons Y. T. So R. Shapley
107
Inhibition of Nociceptive and Nonnociceptive Responses of Primate Spinothalamic Cells by Stimulation in Medial Brain Stem K. D. Gerhart T. K. Wilcox J. M. Chung W. D. Willis
121
Somatotopic Organization of Hindlimb Cutaneous Dorsal Root Projections to Cat Dorsal Horn P. B. Brown J. L . Culberson
137
Taste Sensitivity of Hamster Parabrachial Pontine Neurons R. L . Van Buskirk D. V. Smith
144
N O . 2, F E B R U A R Y 1981 Functional Properties of Neurons in Cat Trigeminal Subnucleus Caudalis (Medullary Dorsal Horn). I . Responses to Oral-Facial Noxious and Nonnoxious Stimuli and Projections to Thalamus and Subnucleus Oralis J. W. Hu J. O. Dostrovsky B. J. Sessle Functional Properties of Neurons in Cat Trigeminal Subnucleus Caudalis (Medullary Dorsal Horn). I I . Modulation of Responses to Noxious and Nonnoxious Stimuli by Periaqueductal Gray, Nucleus Raphe Magnus, Cerebral Cortex, and Afferent Influences, and Effect of Naloxone B. J. Sessle J. W. Hu R. Dubner G. E. Lucier Tonotopic Organization and Encoding Features of Single Units in Inferior Colliculus of Horseshoe Bats: Functional Implications for Prey Identification G. D. Pollak G. Schuller Single Quickly Adapting Mechanoreceptive Afferents Innervating Monkey Glabrous Skin: Response to Two Vibrating Probes A. W. Goodwin B. D. Youl N. P. Zimmerman Population of Quickly Adapting Mechanoreceptive Afferents Innervating Monkey Glabrous Skin: Representation of Two Vibrating Probes A. W. Goodwin M. E. Pierce Cortical Recovery From Effects of Monocular Deprivation: Acceleration W i t h Norepinephrine and Suppression W i t h 6-Hydroxydopamine T. Kasamatsu J. D. Pettigrew M. Ary Regulation of Soleus Muscle Stiffness in Premammillary Cats: Intrinsic and Reflex Components /. A. Hoffer S. Andreassen Neuronal Activity in Cerebellar Cortex Related to Control of Prehensile Force A. M. Smith D, Bourbonnais Interneurons Involved in Mediation and Modulation of GillWithdrawal Reflex in Aplysia. I . Identification and Characterization R. D. Hawkins V. F, Castellucci E. R. Kandel Interneurons Involved in Mediation and Modulation of GillWithdrawal Reflex in Aplysia. I I . Identified Neurons Produce Heterosynaptic Facilitation Contributing to Behavioral Sensitization R. D. Hawkins V. F. Castellucci E. R. Kandel Interneurons Involved in Mediation and Modulation of GillWithdrawal Reflex in Aplysia. I I I . Identified Facilitating Neurons Increase C a Current in Sensory Neurons R. D. Hawkins Interneurons Involved in Mediation and Modulation of GillWithdrawal Reflex in Aplysia. I V . Morphological Basis of Presynaptic Facilitation C. H. Bailey R. D. Hawkins M. C Chen E. R. Kandel Announcements
173
193
208
227
243
254
267 286
304
315
2 +
321
340 3 61
N O . 3, M A R C H 1981 Center-Surround Antagonistic Organization in Small-Field Luminosity Horizontal Cells of Turtle Retina M. Piccolino J. Neyton H Gerschenfeld
363
Response Dynamics of Horizontal Canal Afferents in BarbiturateAnesthetized Cats D. L . Tomko R. J. Peterka R. H. Schor D. P. O'Leary
376
Visual Response Properties of Neurons in Four Extrastriate Visual Areas of the Owl Monkey (Aotus trivirgatus): a Quantitative Comparison of Medial, Dorsomedial, Dorsolateral, and Middle Temporal Areas J. F. Baker S. E. Petersen W. T. Newsome J. M. Allman
397
A Quantitative Analysis of Generation of Saccadic Eye Movements by Burst Neurons J. A. M. Van Gisbergen D. A. Robinson S. Gielen
417
Spinal and Medullary Lamina I Projection to Nucleus Submedius in Medial Thalamus: a Possible Pain Center A. D. Craig, Jr. H. Burton
443
Submodality Distribution in Sensorimotor Cortex of the Unanesthetized Monkey J. Tanji S. P. Wise
467
Neuronal Responses in Sensorimotor Cortex to Ramp Displacements and Maintained Positions Imposed on Hindlimb of the Unanesthetized Monkey S. P. Wise J. Tanji
482
Presynaptic Inhibition of Transmission From Identified Interneurons in Locust Central Nervous System K. G. Pearson C S. Goodman
501
Neurogenesis in Olfactory Epithelium: Loss and Recovery of Transepithelial Voltage Transients Following Olfactory Nerve Section P. A. Simmons T. V Getchell
516
Physiological Activity of Newly Differentiated Olfactory Receptor Neurons Correlated W i t h Morphological Recovery From Olfactory Nerve Section in the Salamander P. A. Simmons T. V Getchell
529
Interneurons Between Giant Axons and Motoneurons in Crayfish Escape Circuitry A. P. Kramer F. B. Krasne J. J. Wine
550
Stochastic Properties of Gustatory Impulse Discharges in Rat Chorda Tympani Fibers T. Nagai K Veda
574
Announcements
593 N O . 4, A P R I L 1981
Efferent Activity During Fictitious Scratch Reflex in the Cat T. G. Deliagina G. N. Orlovsky C Perret
595
G A B A Conductance of Chick Spinal Cord and Dorsal Root Ganglion Neurons in Cell Culture D. W. Choi G. D. Fischbach
605
Chlordiazepoxide Selectively Potentiates G A B A Conductance of Spinal Cord and Sensory Neurons in Cell Culture D. W. Choi D. H. Färb G. D. Fischbach
621
GABA-Mediated Synaptic Potentials in Chick Spinal Cord and Sensory Neurons D. W. Choi D. H. Färb G. D. Fischbach
632
Effect of Vertical Linear Acceleration on H-Reflex in Decerebrate Cat. I . Transient Stimuli D. G. D. Watt
644
Effect of Vertical Linear Acceleration on H-Reflex in Decerebrate Cat. I I . Sinusoidal Stimuli D. G. Z). Watt
656
Organization of Cat Anterior Parietal Cortex: Relations Among Cytoarchitecture, Single Neuron Functional Properties, and Interhemispheric Connectivity T. M. McKenna B. L . Whitsel D. A. Dreyer C B. Metz
667
Neuronal Basis of Leech Swimming: Separation of Swim Initiation, Pattern Generation, and Intersegmental Coordination by Selective Lesions J. C Weeks
698
Regeneration of Earthworm Giant Axons Following Transection or Ablation S. C. Birse G. D. Bittner
724
Physiological and Pharmacological Basis of G A B A and Glycine Action on Neurons of Mudpuppy Retina. I . Receptors, Horizontal Cells, Bipolars, and G-Cells R. F. Miller T. E. Frumkes M. Slaughter R. F. Dacheux
743
Physiological and Pharmacological Basis of G A B A and Glycine Action on Neurons of Mudpuppy Retina. I I . Amacrine and Ganglion Cells R. F. Miller T. E. Frumkes M. Slaughter R. F. Dacheux
764
Physiological and Pharmacological Basis of G A B A and Glycine Action on Neurons of Mudpuppy Retina. I I I . Amacrine-Mediated Inhibitory Influences on Ganglion Cell Receptive-Field Organization: a Model T. E. Frumkes R. F. Miller M. Slaughter R. F. Dacheux
783
Announcements
805
N O . 5, M A Y 1981 Phase of Responses to Moving Sinusoidal Gratings in Cells of Cat Retina and Lateral Geniculate Nucleus B. B. Lee A. Elepfandt V Virsu
807
Phase of Responses to Sinusoidal Gratings of Simple Cells in Cat Striate Cortex B. B. Lee A. Elepfandt V. Virsu
818
Simultaneous Optical Monitoring of Activity of Many Neurons in Invertebrate Ganglia Using a 124-Element Photodiode Array A. Grinvald L . B. Cohen S. Lesher M. B. Boyle
829
Processing of Somatosensory Information in Striatum of Behaving Cats J. S. Schneider T. I. Lidsky
841
Convergence and Interaction of Neck and Macular Vestibular Inputs on Vestibulospinal Neurons R. Boyle O. Pompeiano
852
Optokinetic Response in Monkey: Underlying Mechanisms and Their Sensitivity to Long-Term Adaptive Changes in Vestibuloocular Reflex S. G. Lisberger F. A. Miles L . M. Optican B. B. Eighmy
869
Spectral-Response Properties of Optic-Nerve Fibers in the Ground Squirrel G. H. Jacobs R. B. H. Tootell
891
Color-Discrimination Tests on Fibers in Ground Squirrel Optic Nerve G. H. Jacobs B. Blakeslee R. B. H. Tootell
903
Laminar Organization of Superior Colliculus in the Rabbit: a Study of Receptive-Field Properties of Single Units J. Graham H. E. Pearson N. Berman E. H. Murphy
915
Temporal Patterning in Simple Spike Discharge of Purkinje Cells and Its Relationship to Climbing Fiber Activity T J. Ebner J. R. Bloedel
933
Correlation Between Activity of Purkinje Cells and Its Modification by Natural Peripheral Stimuli T J. Ebner J. R. Bloedel
948
Role of Climbing Fiber Afferent Input in Determining Responsiveness of Purkinje Cells to Mossy Fiber Inputs T J Ebner J. R. Bloedel
962
N O . 6, J U N E 1981 Two Types of Muscle Spindles in Cat Neck Muscles: a Histochemical Study of Intrafusal Fiber Composition G. J. Bakker F. J. R. Richmond
973
Dependence of Auditory Cortex Evoked Unit Activity on Interstimulus Interval in the Cat S. Hocherman
987
E. Gilat
Potassium Ion Homeostasis in Amphibian Brain: Contribution of Active Transport and Oxidative Metabolism T J Sick TV. R. Kreis man Auditory Representation W i t h i n Principal Division of Cat Medial Geniculate Body: an Electrophysiological Study M. B. Calf ord W. R. Webster
998
1013
Descending Inhibition From Medial and Lateral Midbrain of Spinal Dorsal Horn Neuronal Responses to Noxious and Nonnoxious Cutaneous Stimuli in the Cat E. Carstens H. Bihl D. R. F. Irvine M. Zimmerman
1029
Response to Movement of Neurons in Areas 17 and 18 of the Cat: Velocity Sensitivity G. A. Orban H. Kennedy H. Maes
1043
Response to Movement of Neurons in Areas 17 and 18 of the Cat: Direction Selectivity G. A. Orban H. Kennedy H. Maes
1059
Responsivity of Normal Kitten Striate Cortex Deteriorates After Brief Binocular Deprivation R. D. Freeman R. Mallach S. Hartley
1074
Static Characteristics of Muscle Afferents From Gluteus Medius Muscle: Comparison W i t h Joint Afferents of H i p in Cats G. Carli G. Fontani M. Meucci
1085
Interaction of Activity in Frog Skin Touch Afferent Units M. D. Goldfinger Y. Fukami
1096
Rhythmical Synaptic Control of Axonal Conduction in a^Lobster Motor Neuron F. Nagy P. S. Dickinson M. Moulins
1109
Interganglionic Communication by Spiking and Nonspiking Fibers in Same Neuron P. S. Dickinson F. Nagy M. Moulins
1125
Focal Activtions of Human Cerebral Cortex During Auditory Discrimination P. E. Roland E. Skinhöj TV. A. Lassen
1139
Indexes
1152
JOURNAL OF NEUROPHYSIOLOGY
Vol. 45, No. 2, February 1981. Printed in U.S.A.
Tonotopic Organization and Encoding Features of Single Units in Inferior Colliculus of Horseshoe Bats: Functional Implications for Prey Identification GEORGE D. POLLAK AND GERD SCHULLER Arbeitsgruppe Neuro- und Rezeptorphysiologie Fachbereich Biologie, Universität D-6000 Frankfurt, West Germany
SUMMARY AND CONCLUSION
1. Current ideas hold that the specializations in the auditory systems of horseshoe bats are important for the detection and recognition of prey. To evaluate this hypothesis more thoroughly, the response patterns of neurons in the inferior colliculus of horseshoe bats were investigated with tone bursts and sinusoidally frequency-modulated ( S F M ) signals. The S F M signals represent approximations to the frequencymodulation patterns in the constant-frequency ( C F ) component of the echoes that are created when the long C F component first strikes and is then reflected from the beating wings of a small insect. 2. The best frequencies ( B F ) of collicular neurons were divided into three frequency bands: a) the filter frequencies, which correspond to the frequencies of the C F component of the emitted cries and echoes (i.e., 78-88 k H z ) ; b) the frequencies of the final F M portion of the biosonar cries (i.e., 65-77 kHz); and c) the nonecholocation frequencies (i.e., frequencies below 65 k H z ) . The probability that a neuron would fire in registry with the modulation waveform of an SFM signal was highly correlated with the unit's BF. Eighty-one percent of the neurons tuned to the filter frequencies (i.e., 78-88 kHz) showed time-locked responses to S F M signals, whereas only 35% of the neurons tuned to the final F M portion of the cries and 34% of neurons having BFs below 65 kHz exhibited time-locked discharges. 208
Frankfurt,
3. The tonotopic organization of neurons tuned to the filter frequencies is different from that of the rest of the inferior colliculus ( I C ) . The tonotopy in the central, filter region is highly unusual and is characterized by a quasi-cortical appearance where almost all neurons along a particular vertical axis have the same BFs. 4. The influence of signal intensity on the discharge registration evoked by S F M signals was examined in 42 units. Two general types of neurons were found. The first type had discharge registrations that were about equally secure at all intensities above threshold and had firing rates that increased monotonically or slightly nonmonotonically with intensity. The second type of neuron exhibited the most vigorous responding and sharpest locking only at low or moderately low intensities and had a significant decline or complete absence of locking at higher intensities. 5. M a n y collicular neurons also exhibited preferences for certain ranges of modulation rates but other neurons would respond with discharges synchronized to the modulation waveform over a very wide range of modulation rates. Similar characteristics were observed for neurons when the depth of modulation was systematically varied. The lowest modulation depths that would evoke timelocked discharges were ± 10-40 H z . 6. The locking behavior of 34 units was investigated when the carrier frequency was systematically moved in and around the unit's tuning curve. I n about a third of the
0022-3077/81/0000-0000$01.25 Copyright © 1981 The American Physiological Society
209
INFERIOR COLLICULUS O F BATS
units, there were sharp changes i n discharges that were symmetric around the BF and agreed closely with the extent to which the S F M signal encroached on the tuning curve; the greater the encroachment, the more vigorous the response. I n the remainder of the neurons the vigor with which the neurons would discharge to the S F M signal was asymmetrically related to the BF. I n these units the amplitudes of the peaks in the histograms were superior for carrier frequencies below or, in other units, for carrier frequencies above the BF of the neuron. 7. The tonotopic organization and the S F M excitatory properties suggest that the spatial extent of neural activity evoked by an echo reflected from an insect should be sharply confined within the anterior-posterior axis of neural space. W i t h i n the active region, the frequency-modulation pattern in the echo CF component is coded by the temporal sequence of discharges. Moreover, due to changes i n position, orientation, and speed of either the bat or its target, each echo will differ more or less in carrier frequency, modulation pattern, and intensity from the previous echoes. The preferences of many filter neurons for selective ranges of intensity as well as modulation depth and rate seem i m portant in this regard. These features should endow the system with the ability to encode the perturbations imposed on the echo CF component with the sum total of spatiotemporal activity being a dynamic pattern, which differs from echo to echo. INTRODUCTION
Several species of bats emit echolocation cries where the most prominent feature is a long constant-frequency ( C F ) component followed by a less conspicuous brief, downward sweeping, terminal frequency-modulated ( F M ) portion. The greater horseshoe bat, Rhinolophus ferrumequinum, is one of these so called long C F - F M bats and emits an 80- to 84-kHz CF component having a duration of 10-100 ms ( 1 1 , 15, 16, 22). Each horseshoe bat has its own private emission frequency, which is regulated with remarkable precision (15, 18, 22). When no echoes are heard or when the echo has the same frequency as the cry, these bats emit successive CF components that vary by only
± 1 0 0 H z from pulse to pulse. However, under most conditions echoes reflected from an object w i l l be Doppler shifted upward due to the approach of the bat toward its target. I n response to the upward shift in echo frequency the horseshoe bats lower the frequency of their emitted C F signals by an amount almost equal to the Doppler shift in the echo. This maneuver, called Dopplershift compensation (15, 22, 24), allows the bat to hold the frequencies of the subsequent echoes to within a narrow frequency band only 50-100 H z wide. The auditory system of the horseshoe bat has a number of impressive specializations for processing the C F component. I n the cochlea, the portion of the basilar membrane devoted to the frequencies of the C F portion of the emitted cries and Doppler-shifted echoes is greatly elongated (2-4, 9). Furthermore, the elongated region is demarcated from the more apical regions of the basilar membrane by a number of pronounced structural adaptations. The structural features create a highly resonant hydromechanical system, which is responsible for producing the high degree of frequency selectivity seen in many auditory neurons (2, 3, 8, 9, 19, 29). The population of auditory neurons can be divided into two categories on the basis of tuning. Neurons in the first category have best frequencies ( B F ) between 78 and 88 kHz and are referred to as "filter neurons" (8, 10, 30) because of their sharp tuning curves. The degree of tuning is indicated by the Qio dB value, which is defined as the unit's BF divided by the bandwidth of the tuning curve at 10 dB above the minimum threshold (i.e., threshold above the B F ) . The Q dB values of filter neurons are typically 50-200, with some as high as 300-400, and are the most sharply tuned neurons observed in the auditory systems of any animal studied so far. Neurons in the second category have BFs below 78 k H z and have much broader tuning curves. The QiodB values of these nonfilter neurons rarely exceed 20 and in this respect they are similar to the tuning curves seen in auditory neurons of other animals. The specialized features of both the emitter and receiver of horseshoe bats have considerable functional significance. The system is exquisitely sensitive to motion that is 1 0
210
G . D. P O L L A K A N D G . S C H U L L E R
thought to be important for the detection and recognition of prey (5, 17, 18, 20, 21, 23). The emission of a long C F component together with neurons having high Q values are both seemingly well suited for these purposes. Even very small Doppler shifts in the echo CF component are easily detected by the sharply tuned filter neurons and the perception of a Doppler shift alerts the bat to a target in its acoustic environment. I f the target is a flying insect the echo CF component will also have amplitude and frequency modulations ( A M and F M ) , which are produced as the long C F component first strikes and is then reflected from wings having a more or less high rate of periodic motion. Furthermore, since insects differ in size, wingspread, and wingbeat frequency, the profile of modulations in the echo CF component contains considerable information about the target. I f the auditory system can encode the profile of modulations in the echo CF component, the bat should be able to resolve a number of target features and utilize that information for target identification. Preliminary information concerned with response features of peripheral auditory neurons in the long C F - F M bats, reported by Suga and his co-workers (28, 30), suggests that both A M and F M are encoded with precision. A more recent and comprehensive study by Schuller (21), of single neurons in the inferior colliculus ( I C ) of the horseshoe bat, confirmed and greatly extended Suga's original observations. Schüller simulated the variety of frequency-modulation patterns that occur in echoes reflected from insects. He accomplished this by utilizing acoustic signals that had sinusoidal frequency modulation ( S F M ) patterns and he found that many neurons respond with firings tightly locked to the modulating waveform. Here we present data that compliment Schuller's earlier study. I n this report particular attention is directed toward an analysis of the differences existing among the population of filter neurons with regard to their response features when the depth or the rate of the frequency-modulation patterns was varied. We also examined the influence of stimulus intensity and variations in carrier frequency on the coding security for these signals. F i nally, we obtained data concerning the ton-
otopic organization of the horseshoe bat's I C . The tonotopy proved to be considerably different from that of other mammals and has an important bearing on the functional organization of the horseshoe bat's I C . METHODS
Surgical
Procedures
Eleven greater horseshoe bats, Rhinolophus ferrumequinum, were prepared under Metofane anesthesia (Pitman-Moore, Washington Crossing, N.J.). In each animal, a long incision was made along the midline of the skull and the underlying musculature was reflected. The skull was dried and dental cement applied to the anterior and posterior portions of the cranium. Small wisps of cotton soaked in procaine were placed on all open wounds. An indifferent tungsten electrode was placed in the skull overlaying the cerebellum or cortex and cemented in place. A small screw was mounted on the anterior portion of the cranium with dental cement. Each animal was then placed in a Plexiglas holder that restricted gross movements and the screw was locked onto a rigid metal bar above the head. This procedure immobilized the bat's head and allowed a clear sound field to the animal's ear. Small holes, approximately 200300 pm in diameter, were drilled over the inferior colliculus with a Narishige stereotaxic drill (model SD-101). Holes were systematically placed to permit us to sample much of the rostrocaudal extent as well as the mediolateral extent of the colliculus. The Metofane was then removed and the animals were allowed to recover. The animals appeared to be comfortable in that they remained calm and quiet throughout the experiment sessions. As a precautionary measure, the local anesthetic was reapplied to the wound margins once every 3-4 h. Under these conditions the bats occasionally exhibited spontaneous movements of the shoulders, wings, or feet but rarely was there any intense struggling indicative of pain. In such cases, refreshing the cotton wisps with additional procaine resulted in a cessation of struggling movements. Prior to being placed in the holder, three bats were given injections of a neuroleptic agent (4 mg/kg droperidol). The other eight bats were not given any drugs other than the Metofane and topically applied local anesthetic. A l l animals were fully awake during the experiment and no differences in response properties could be detected between the bats given neuroleptic agents and those given no drugs.
Stimulation Acoustic stimuli were presented under freefield conditions by a condenser loudspeaker lo-
211
INFERIOR C O L L I C U L U S O F BATS
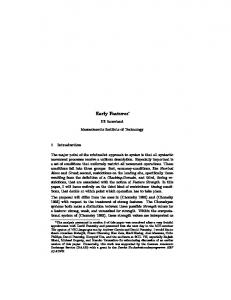
cated 10 cm from the ear contralateral to the colliculus from which we monitored activity. The loudspeaker was calibrated with a 0.25-inch Bruel and Kjaer microphone that had a flat free-field response ( ± 2 dB) from 50 to 100 kHz. The acoustic signals consisted of tone bursts and sinusoidally frequency-modulated ( S F M ) signals having durations of 60-100 ms and rise-fall times of 2.0 ms. Tone bursts were produced by shaping the output of a Wavetek oscillator (model 136), hereafter called the tone-burst oscillator. The S F M signal that was presented to the bat was generated in the following way. An S F M waveform was obtained from a phase-locked Wavetek oscillator (model 112), which was triggered by the same sync pulse that initiated tone bursts. Consequently, the S F M waveform was phase-locked to the beginning of each stimulus and always started with a precise phase angle relative to the envelope of the tone burst. The S F M waveform was then sent to a set of calibrated attenuators, which determined the amplitude of the waveform. The waveform was then fed to the V C G input of the tone burst oscillator. When an S F M waveform was at the input of the tone burst oscillator, the output was an S F M signal. Three parameters of the S F M signal were of interest and were under our control: / ) the carrier or center frequency, 2) the modulation frequency or the frequency at which the F M pattern was repeated within each signal, and 3) the modulation depth or the amount by which the frequency of the signal oscillated around the carrier frequency (Fig. 1). The carrier or center frequency of the S F M signal was set by the Wavetek 136 tone-burst oscillator, whereas the modulation frequency was controlled by the frequency setting of the phase-locked oscillator. All frequencies were measured with an electronic frequency counter (Eldorado 325B). The modulation depth was determined by the calibrated attenuators. We used modulation frequencies that varied from 30 to 500 Hz and modulation depths that ranged from ± 10 Hz to ± 5 kHz. The spectrum of a frequency-modulated signal contains an infinite series of side frequencies (f ± kf ;k= 1, 2 , 3 , . . .), where f is the carrier frequency and f is the modulating frequency. The distribution of energy to the side frequencies depends on the modulation index, which is defined as the ratio of the maximum instantaneous frequency deviation, d/, of the signal to the modulating frequency, f . If the frequency modulation depth is small compared to the modulating frequency, f (i.e., the modulation index is much smaller than 1), only the first two side frequencies contain considerable energy. Whenever the modulation index is greater than 1, p spectral components (f ± kf \k = 1, 2, 3, . . .) contribute significant energy to the frequency-modulated sig0
m
0
m
m
IM
\
/
^
50
o
100
Time (ms)
2
F I G . 1. Relation of the signal enveiope to the S F M waveform. The carrier frequency in this case would be 80.6 kHz and would be frequency modulated by ±Af at the rate of 100 Hz. The value of A / i s determined by the amplitude of the S F M waveform that is fed to the V C G input of the tone-burst oscillator. The S F M waveform always has the same phase relationship to the signal envelope.
nal, where p = 1 + df/dm. For example, a frequency modulation of ± 200 Hz at a modulation frequency of 100 Hz yields 13 spectral components on each side of the carrier frequency whose relative amplitudes are above 0.1 of the amplitude of the unmodulated carrier frequency. Most energy, however, is distributed to the frequencies around f ± df. Q
Recording and histological
procedures
Single units were recorded with micropipettes filled with 3 M K C l and 3% alcian blue dye ( 8 20 Mfi), which allowed electrophoretic marking in each penetration (6). Prior to recording, the tips of the electrodes were positioned within about ± 2 0 0 Aim of the collicular surface with the aid of a Zeiss operating microscope. The electrodes were attached to a Wells microdrive unit having a stepping motor and digital display. The micropipettes were advanced in steps of 1 pm and when a unit was encountered, the depth was recorded. In general, the electrodes were driven to a depth of 2,000-2,500 jum, which corresponds to the ventral extent of the horseshoe bats' I C . On completing a penetration we deposited a small amount of alcian blue dye by passing 1 ^A of current for 3 min at one or two electrode locations along the electrode tract. The depths of the dye depositions were recorded and carefully chosen to facilitate tract identification and to, avoid any confusion with penetrations made earlier or subsequently in different parts of the bat's I C . At the end of each experiment the animals were killed with an overdose of anesthesia and the brains fixed in Formalin. Frozen sections, 40-60 pm thick, were then prepared and stained with cresyl violet. Each electrode tract was identified and the appropriate position of each unit along the tract was determined.
m
0
m
Data analysis Spikes were amplified and processed with conventional methods and fed on-line to a P D P 11 / 40 laboratory computer that generated poststimulus time ( P S T ) histograms. The spikes were
212
G. D. P O L L A K A N D G.
timed relative to the stimulus onset, and all histograms had a bin width of 0.1 ms. The computer programs for acquisition and processing spike information were written by H . Zöller. In addition, the tone-burst frequency for which the lowest sound pressure was needed to evoke a just noticeable change in firing rate from the background activity was determined audio-visually. We shall refer to this frequency as the unit's best frequency (BF). Since the majority of units had very low rates of spontaneous activity, or no spontaneous activity at all, we were able to determine the B F s with considerable accuracy. We routinely evaluated the B F s of filter units to an accuracy of ± 5 0 Hz and, when necessary, we increased the accuracy to ± 10 Hz. Tuning curves of 87 units were determined audio-visually by raising the signal level in steps of 10 dB above threshold at the B F and carefully assessing the upper and lower frequency limits to which the neuron would respond. In experiments where we needed to relate the S F M carrier frequency to the limits of the tuning curve (see R E S U L T S ) , P S T histograms generated by tone bursts at a particular frequency and S F M signals having the same carrier frequency and intensity were obtained and compared.
RESULTS
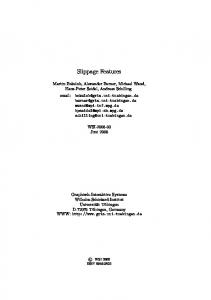
General response features evoked by tone bursts and SFM stimulation In this section we first describe the response patterns elicited by tone bursts. We then consider whether any relation exists between the firing pattern evoked by a tone burst and the ability of a unit to follow S F M signals with spike trains in registry with the phase of the modulation waveform (i.e., locked or synchronized firings). Unless otherwise stated, the tone-burst frequency and the carrier or center frequency of the S F M stimulus were set at the unit's BF. Activity evoked by tone bursts was evaluated in 444 neurons. I n 378 of the units tone bursts evoked one of three types of firing patterns (Fig. 2): 7) a phasic response pattern where the neuron fired only to the onset, only to the offset, or to both the onset and offset of the signal (154 units, 35%); 2) a tonic or sustained pattern where firings occurred throughout the duration of the signal presentation (160 units, 36%); 3) an i n hibitory pattern where the response was a prominent inhibition of the spontaneous activity, which lasted for the duration of the
SCHULLER
signal (64 neurons, 14%). The remaining 66 neurons (14%) failed to respond to tone bursts at any frequency-intensity combination. Of the 444 neurons encountered, 282 units were tested with both tone bursts and S F M signals having modulation depths of from ± 500 H z to ± 2,000 Hz at intensities ranging from 40 to 70 dB SPL. About half of the neurons tested with S F M stimulation responded with discharges tightly locked to the modulation waveform. I n general, there was a relationship between a unit's discharge pattern evoked by tone bursts and its ability to fire i n registry with the S F M envelope. Neurons having a tonic pattern to tone bursts were more likely to lock to the S F M waveform than were phasic units. Inhibitory neurons and neurons that were unresponsive to tone bursts were least likely to fire i n synchrony with S F M envelope; 73% of the tonic units, 50% of the phasic units, and 25% of the inhibitory neurons had locked firing,patterns to the S F M signals. Examples of each type are shown i n Fig. 2. I n addition, only 23% of the neurons that were unresponsive to tone bursts responded with brisk, synchronized firings to S F M stimulation. Filter neurons compared to nonfilter neurons RESPONSE PROPERTIES.
The probability that
a neuron would fire in registry w i t h the modulation waveform of an S F M signal was highly correlated with the unit's BF. The collicular neurons were grouped into neurons with BFs equal to: / ) the filter frequencies (i.e., 78-88 k H z ) , 2) the frequencies of the final F M portion of the biosonar cries (i.e., 65-77 kHz), and 3) the nonecholocation frequencies (i.e., frequencies below 65 k H z ) . A much larger percentage (81%) of neurons tuned to the filter frequencies showed timelocked responses to S F M signals than did neurons tuned to the frequencies of the F M portion of the cries (35%) or to frequencies below 65 k H z (34%). The tendency for a much higher proportion of filter neurons to lock to S F M was also found within the populations of phasic units, tonic units, as well as units that were unresponsive to tone bursts but that responded to SFM. O f the 50 phasic units that had firings in registration w i t h the S F M
INFERIOR C O L L I C U L U S O F BATS PHASIC-ON-OFF 84.0 KHz 60 dB SPL
PHASIC-ON 84.75 KHz 30 dB SPL
213 PHASIC-OFF 82.9 KHz 50 dB SPL
TONE BURST.
SFM I I I I I I I I I I 1 I
i i i i i i
40n 1
TONE BURST
oo 20-
0
J
SFM
ülL I
I
T
1
i i i i i i i i i i i i
INHIBITORY 85.0 KHz 50 dB SPL
TONIC 83.9 KHz 40 d8 SPL
1 I
I
I
1 I
I
I
80 msec
i i i i i r i i i i i
Time-MSxlO
F I G . 2 Firing patterns elicited by S F M signals in three types of phasic neurons (top), a tonic neuron, and an inhibitory neuron. The B F of each neuron is shown above each of the histograms generated by tone bursts. The tone bursts and S F M carrier frequencies were always set at the B F for each neuron. The signal duration was 80 ms, as indicated by the bar in the lower left.
waveform, 41 were filter units, 7 were F M units, and 2 were tuned to nonecholocation frequencies (Fig. 3), a finding in agreement with Schuller's (21) earlier report. A similar distribution was found for tonic neurons although a larger number of nonfilter neurons locked to S F M in this population than were found for the population of phasic neurons (Fig. 3). Another striking result was obtained for the neurons that were unresponsive to tone bursts but that locked to S F M . Of the 15 neurons in this category, 12 had their best S F M frequencies between 78-86 kHz (the best S F M is the carrier evoking the highest number of discharges per S F M cycle at 10-20 dB above threshold). The three other neurons had best SFMs of from 76.0 to 76.5 k H z while none of the cells had best SFMs in the nonecholocating frequency range (Fig. 3). The trend for neurons responding with an inhibitory pattern to tone bursts was different from the trend of the other neuronal types described above. The feature to note is the lack of any pronounced tendency for the inhibitory filter neurons to lock to S F M stimulation (Fig. 3), although some units of this type did show locking (Fig. 2). Furthermore, there seemed to be a paucity of
neurons tuned to the filter frequencies within this population. Although the sample size was small (e.g., 26 inhibitory neurons were tested with S F M signals), only 23% (six units) were tuned to the filter frequencies. TONOTOPIC ORGANIZATION.
The
finding
that filter neurons have characteristics that distinguish them from nonfilter neurons is also reflected in the tonotopic organization of the I C . The tonotopy reveals that the filter neurons are both segregated from and are arranged in a manner different from the neurons tuned to the F M portion of the orientation sounds and neurons tuned to the lower, nonecholocation frequencies. These features are especially evident in the middle or central portion of the I C . This region of the colliculus is functionally divided into a dorsal region, where the BFs of neurons range from 9 to 76-77 k H z , and a ventral region, where the filter frequencies are represented (Fig. 4). The tonotopic arrangement in the dorsal, nonfilter region is, in principle, similar to the tonotopy found in all other mammals that have been studied (1). Proceeding from the dorsal aspect of the I C to a depth of approximately 800-1,200 /xm, the BFs of the neurons encountered increased progressively
214
G . D. P O L L A K A N D G . S C H U L L E R
50
Phosic Units Locking to SFM
Tonic Units Locking to SFM Inhibitory Units Locking to SFM
40-1 30-
Phosic Units Not Locking to SFM
Tonic Units Not Locking to SFM
Inhibitory Units Not Locking to SFM
Units Unresponsive to Tone Bursts but Locking to SFM
S Filter DFM B Non-echotocotmg
20 10 0 F I G . 3. Bar histograms showing the number of neurons that had time-locked discharges to S F M signals (above) and the number of units that would not lock to S F M signals (below). Each set of histograms is divided up according to the response pattern evoked by tone bursts (e.g., phasic, tonic, or inhibitory) and further subdivided into filter units (crosshatched), F M neurons (white), and nonecholocation neurons (stippled). Notice the large number of filter units that locked to S F M in both the phasic and tonic categories. See text for further explanation.
from about 10 k H z or below to the mid to upper 70-kHz range (Figs. 4 and 5). A t that point there was an abrupt change in the topographic mapping of the cochlea on the I C . For the final 1,000-1,200 fim of depth the tonotopy assumed a quasi-cortical appearance where almost all neurons along a particular vertical axis had the same or nearly the same BFs (Figs. 4 and 5). It is important to note that only the filter frequencies are represented in the ventral region of the I C . We, therefore, refer to this area as the filter region of the I C . Furthermore, the tonotopic organization of the filter region is in the anterior-posterior axis. I n this part of the I C , vertical arrays of neurons tuned to the low filter frequencies (i.e., 7 7 80 k H z ) are represented in the anterior portion while arrays of neurons having progressively higher BFs (i.e., 81-86 or 87 k H z ) are represented in the more posterior regions (Fig. 4). .The tonotopic arrangement described above holds true only for the central portion of the I C . A very different organization is found in both the medial and lateral margins of the I C . The tonotopy in the most medial
edge of the colliculus is somewhat of a compromise between the dorsal and filter regions. The BFs of neurons in this region proceed from low to high with increasing depth but, with few exceptions, only the filter frequencies are represented. Here the range of BFs extends only from 78 to 91 k H z and the lower, nonfilter, frequencies are noticeably absent (Fig. 6). The most lateral region of the I C has yet a different organization. I n this margin there is also a systematic progression of BFs with depth, from low to high, but the filter frequencies are only sparsely represented (Fig. 6). Typically, the neurons in the most dosal portion have BFs around 20 k H z , or lower, and the BFs systematically increase with depth to a maximum of about 77 k H z , the highest B F we have recorded in this part of the colliculus. However, the distinguishing feature of the lateral margin is the large number of inhibitory neurons, which are by far the most prevalent variety. Responses to SFM
stimuli
In the above analyses neurons were treated in a categorical manner in that they were
INFERIOR C O L L I C U L U S O F BATS
215
F I G . 4. Sagittal sections through the inferior colliculus of a horseshoe bat showing B F s of neurons encountered in two electrode penetrations. The position of each neuron encountered and its B F are shown. T h e depth in micrometers within the colliculus is also shown next to each penetration. Regions in the anterior-posterior axis from which these sections were obtained can be seen in the lower sagittal section from one entire brain. Note the progressive increase in BFs from the dorsal surface to a depth of 700-900 pm and the relatively constant B F s for neurons at lower depths. Also note that B F s in the filter region were all 77-79.5 k H z in the anterior electrode tract, whereas in the posterior tract BFs were 83.4—83.9 k H z . All electrode tracts were retraced from alcian blue dye marks deposited from the electrode. Neurons that could not be driven with any acoustic stimulation are labeled N D .
classified either as filter, F M , or nonecholocation neurons, which either locked or did not lock to S F M stimulation. Such analyses showed that the probability of having neuron respond with locked firings to S F M signals is much greater i f the neuron is tuned to the filter frequencies than i f i t is tuned to other frequencies. Moreover, the filter neurons are spatially segregated from other neurons and occupy a disproportionate amount of neural space. The filter neurons are of particular interest because they constitute the neuronal population that processes the modulation
patterns in the CF portion of the echo. However, a categorical assessment tells little about how.filter neurons process these signals; specifically, how discharge synchrony and vigor are affected by variations i n signal intensity or by variations in modulation depth and rate. These features are important because during echolocation bats receive echoes reflected from targets having a variety of shapes and sizes situated at various distances and at various angles w i t h respect to the bat. Each of these factors has an i m portant influence on the echo intensity as
216
G. D. P O L L A K A N D G . S C H U L L E R
BEST FREQUENCY-KHZ F I G . 5. Change in best frequencies with depth for three penetrations made in the inferior colliculi of two horseshoe bats. The three curves represent penetrations made in the anterior (filled circles) and progressively more posterior portions (open circles and crosses) of the colliculus. Note how similar the best frequencies in the filter region are within a given electrode tract.
well as on the modulation profile. Below we present data that provide some insights into how neurons respond to variations of S F M parameters. We shall first consider the i n fluence of signal intensity on discharge registration and then present data pertaining to the effects of modulation rate and depth, with special attention devoted to filter neurons. INFLUENCE O F INTENSITY
O N F I R I N G PAT-
TERNS EVOKED BY SFM SIGNALS.
The signal
intensity was varied systematically in 42 units. Two general types of neurons were found based on the way in which intensity influenced the discharges synchronized to the S F M waveform. The first type of neuron had discharge registrations that were about equally secure at all intensities above threshold. Furthermore, the height of the histogram peaks evoked by S F M signals i n creased monotonically or slightly nonmonotonically with intensity. The neuron shown in Fig. 7 and one of the neurons shown in Fig. 8 (unit 17-4-17 on the far right) i l lustrate locking behavior of the first type. For the second type of neuron the peaks of the PST histograms were highest only at
low or moderately low intensities and there was a significant decline or complete absence of locked discharges at higher intensities. Curiously, we never observed any unit that locked only at high intensities and not at lower intensities. I f a neuron exhibited synchronized firings to S F M , that synchronization was always apparent within 20 dB of the unit's threshold. The preference for a small intensity range is illustrated by three neurons in Fig. 8. As an example of such behavior consider unit 15-5-16 (Fig. 8). This neuron responded to 10-dB SPL signals with a firing registration that was, at best, poorly locked to the modulation waveform but at 20 and 30 dB SPL the peaks were well synchronized. Locking was still present at 40 and 50 dB SPL, although i t was much reduced, and i t almost disappeared completely at higher intensities (60 dB SPL). O f particular importance, two of the other cells shown in Fig. 8 also displayed a deterioration of locked responses at higher intensities but the preferred intensity range differed slightly from cell to cell. This was due in part to the differences in threshold to the S F M signals. The popula-
INFERIOR C O L L I C U L U S O F BATS
217
SFM 20
30
1. i
CL CO
3
40
c
0> 50
F I G . 6. Frontal sections through the inferior colliculus of a horseshoe bat showing the arrangement of B F s in the lateral and medial margins of the colliculus. In the two top sections, the B F of each neuron and the neuron's depth are shown. Note the orderly increase in filter frequencies, from 79.1 to 91.0 kHz, for the penetration made in the medial margin of the colliculus. This tonotopy contrasts with that seen in the lateral margin where BFs increased from 4.9 kHz to only 71.8 kHz. I N H indicates that the neuron had an inhibitory firing pattern and neurons labeled N D could not be driven with any of the acoustic signals at our disposal.
tion of locking neurons, then, apparently forms a continuum where some cells are selective and encode the modulation pattern "best" when the signal falls within a narrowintensity slot (neurons of the second type) whereas other neurons are less selective and encode the modulation pattern about equally well over a wide range of intensities (neurons of the first type). An important feature of many, but not all, units having a preferred intensity range for locked firings is that their spike-count functions to tone bursts at the BF were monotonic. This is shown in Fig. 9 where the responses to tone bursts and S F M signals that had various intensities are displayed, side by side, for unit 43-5-18 (the histograms for this unit are also shown in Fig. 8). Notice that the discharges evoked by S F M signals were well locked to the modulating waveform at signal intensities of from 10 to 40 dB SPL but that the locking, as well as the number of discharges per stimulus, deteriorated markedly at 50 dB SPL. The responses to tone bursts at the BF shows, however, that the spike-count function was
60 20n a. CO
10-
*o
6 z
70 0-
I
l
1 liii i
i i
llii ill
1 1 1 I I I I I 1
Time-MSxIO
MOD DEPTH ±500Hz MOD RATE 50Hz C E N T E R FREQ 84.5KHz(BF) F I G . 7. A n example of the effect of intensity on the response patterns of neurons of the first type. Notice that the discharges were well synchronized to the modulation waveform at all intensities. Signal duration is indicated by bars under each histogram. Unit 15-5-17.
monotonic and did not decrease with intensity. EFFECTS OF MODULATION RATE.
As was
the
case for intensity, many units exhibited preferences for certain ranges of modulation rates while other neurons responded with discharges synchronized to the modulation waveform over a wide range of modulation rates. Figure 10 illustrates the differences in the ability to encode progressively higher modulation rates in four neurons. One neuron (unit 36-5-16) could accurately encode modulation rates up to, and probably beyond, 500 Hz. However, most other neurons reached their limitations at lower modulation rates. For example, each of the three other neurons in Fig. 10 had an upper rate limit that i t could follow; unit 13-3-13 could follow rates up to 400-450 Hz, while unit
G . D. P O L L A K A N D G . S C H U L L E R
218 Intensity OdB
lOdB
J • I nil
i i L1
„,
i 1. L1
liiuiti
k
1.
i m
20dB
30dB
40dB
L
I. L
L
20-, 6 0 d B
80 msec
k
o
10 o
J
70dB
BF-85.0kHz Mod Depth ± 5 0 0 H z Mod. R a t e - 5 0 H z Unit 43-5-18
l
.liiiLl.j.ii Im llilIII
Ii
,I,i,i.[il.L
i ii •
EL 0 0
l
In, ill iLii.
.L.
50dB
BF-81.65 kHz Mod. Depth tlOOOHz lntensity-50dB Unit-28-3-22
80 msec F I G . 10. Effect of different modulation rates on the locked discharges evoked by S F M signals in four collicular units. Unit 36-5-16 (left) followed rates as high as 500 H z with well-synchronized firings while unit 28-3-22 (right) could only follow rates below 100 Hz. The two other units could follow rates up to 200 H z (unit 15-5-17) and 300-400 Hz (unit 13-3-13). A l l signals were 80 ms in duration, as indicated by the bar at lower left.
S F M signals having carrier frequencies of 85 k H z and below. This unit illustrates, once again, the large discrepency that can exist between the encoding features for tone bursts and more complex stimuli. Effects of intensity on SFM excitatory area S F M excitatory areas were obtained at two or more intensities above the B F threshold in 10 units. Although the sample size is small, some of the results are quite interesting and are worth recounting. I n general, the S F M excitatory areas become wider with intensity and the increase in width followed directly from the changes in the unit's E A . I f the unit were very sharply tuned, as was the case for most of the filter units, there was little broadening of the S F M excitatory area whereas the broadening was considerably greater in most nonfilter units due to the widening of the E A at higher intensities. The interaction of intensity and carrier frequency often led to complex changes in the S F M tuning properties. The complexity
was evident in gaps in the S F M excitatory area, where certain carriers that evoked little or no locked firings were sandwiched between carriers that evoked brisk, well-synchronized responses. This feature is illustrated by unit 16-3-13 ( F i g . 13), which had a typical asymmetric S F M excitatory area at an intensity of 30 dB SPL. When the i n tensity was increased to 40 dB SPL, the first notable gap appeared for the 85.0-kHz carrier. When the intensity was 70 dB SPL, the gap widened to include carriers ranging from 84.0 to 85.0 k H z that were surrounded by well-developed discharge peaks at carriers of 83.5 and 85.5 k H z . The appearance of this S F M excitatory area is due to the fact that both monotonic (82.5 and 85.5 k H z ) as well as strongly nonmonotonic input-output functions were generated by S F M signals having different carrier frequencies. DISCUSSION
The C F portion of the biosonar signals is clearly of considerable importance to the
221
INFERIOR C O L L I C U L U S O F BATS
Asymmetric SFM Response Area
Symmetric SFM Response Area
IP-
r
_L_L
SFM
84.S0 84 43
I -J_Ll_L
Tone Bursts '
—
-84.00
-85.40
I P - II l l .1 IP'' i l l
-85.30 -85.20 :n -85.10 •§ 85.00 84.92
IP"
2
20
oo
io-
o
0
a.
1
i
1
i
83 30
/ \ 83 58 8 3 9 5 KHz
— 0
83.10
i i i i i i i i i i i i i i i i i i 30 6 0 9 0 120 150 180
83 00
-
Time(ms)
1 ^
x 84.75
11
83 20
al ai
86.00
85.50
83.70 o