Special Issue Article
Tools for machine-learning-based empirical autotuning and specialization
The International Journal of High Performance Computing Applications 27(4) 403–411 ª The Author(s) 2013 Reprints and permissions: sagepub.co.uk/journalsPermissions.nav DOI: 10.1177/1094342013493124 hpc.sagepub.com
Nicholas Chaimov, Scott Biersdorff and Allen D Malony
Abstract The process of empirical autotuning results in the generation of many code variants which are tested, found to be suboptimal, and discarded. By retaining annotated performance profiles of each variant tested over the course of many autotuning runs of the same code across different hardware environments and different input datasets, we can apply machine learning algorithms to generate classifiers for runtime selection of code variants from a library, generate specialized variants, and potentially speed the process of autotuning by starting the search from a point predicted to be close to optimal. In this paper, we show how the TAU Performance System suite of tools can be applied to autotuning to enable reuse of performance data generated through autotuning. Keywords autotuning, specialization, TAU, machine learning, decision trees
1. Introduction Scientific codes are often written by scientists who are experts in their particular domain but for whom low-level optimizations taking advantage of architectural features of particular systems is not a priority, yet this is essential for attaining good performance. Experts in computer architecture can help make these optimizations, but the process is time-consuming and yields code which can be difficult to read, difficult to debug, and tied to a particular system or class of systems. The process is further complicated by code with performance characteristics which additionally depend upon properties of the input dataset. Hence, efforts have been undertaken to automate the process of tuning code through empirical autotuning, a process wherein many optimizations are carried out and their effects on performance measured in order to select the best optimizations. Autotuning has been employed with success in various libraries, such as the linear algebra library ATLAS (Whaley and Dongarra, 1998; Whaley et al., 2000) and the Fourier transform library FFTW (Frigo et al., 2005) In both of these cases, the autotuning system is specific to the domain and self-contained. Just as it is non-ideal to burden application developers with the task of carrying out low-level optimizations, it is non-ideal to burden them with the design and implementation of a library-specific autotuning system. For this reason, general-purpose autotuning systems, such as Active Harmony (Hollingsworth and Tiwari, 2010) and Orio (Hartono et al., 2009) have been developed.
The output of an autotuning system is a set of optimizations, or a code variant, which was measured to yield the highest performance. During the autotuning process, however, a large number of optimizations or variants are tested. We propose that performance data for each variant tested over the course of autotuning should be preserved, annotated with provenance metadata specifying the execution environment, input data, and optimizations applied. Moreover, by retaining the complete information, we can analyze the performance characteristics of the optimized variants in order to generate understanding of the effects of the various optimizations. By preserving such data in a centralized database across multiple runs on multiple machines and with multiple input data, we can analyze how optimizations, machine, and input data characteristics interact. Interoperability between tools used within the autotuning framework, including performance analysis tools, can be enabled by a well-defined data format accessible through open application programming interfaces (APIs).
Department of Computer and Information Science, University of Oregon, Eugene, OR, USA Corresponding author: Nicholas Chaimov, Department of Computer and Information Science, University of Oregon, 207B Deschutes Hall, 1202 University of Oregon, Eugene, OR 97403, USA. Email:
[email protected]
404
The International Journal of High Performance Computing Applications 27(4)
There are other benefits of capturing and managing rich performance information generated during empirical autotuning. By applying machine learning algorithms to such data, we can generate classifiers which enable runtimeadaptive code without requiring autotuning at runtime, and we can potentially speed up the process of autotuning by using learned classifiers to select good starting points for search. In the former case, we may want to create a classifier which, given past performance measures, properties of the machine on which the code is currently executing, and properties of the input data, selects a variant predicted to be the best-performing from those in a library of variants generated by earlier autotuning sessions. In the latter case, given the same information, we may want to select a set of parameters specifying a starting point in the search space of potential variants. Here, we show how performance measurement, autotuning, performance database and machine learning tools can be integrated to attain these goals.
2. Related Work Machine learning techniques have been used previously for the prediction of beneficial optimizations. Monsifrot et al. (2002) used decision tree learning to select optimal unroll factors for loops extracted from the SPEC benchmarks. Their approach was to perform static analysis of the code to extract various descriptors of the code: number of statements, number of operations, number of array accesses, etc. For each loop, the space of possible unroll factors was enumerated exhaustively and the performance of each was measured. By using decision tree learning over that dataset, a tree was produced which could, given a loop from the overall dataset omitted from the training dataset, identify the empirically determined optimal unroll factor in 85.2% of cases tested. This approach was also used by unroll: code properties obtained by Stephenson and Amarasinghe (2005): code properties selection by static analysis were used train nearest-neighbor classifiers and support vector machines for selection of unroll factors, with accuracies of 62% and 79%, respectively. Cavazos et al. (2007) use machine learning to selecting compiler flags based upon measurement of hardware performance counters. Their approach involves first testing a around 500 randomly selected combinations of compiler flags and recording execution time along with the values stored in various hardware counters. Logistic regression is then used to assign to each compiler optimization a probability indicating whether it should be evaluated given the performance counter data, which are used to guide future autotuning sessions. Optimization flags selected by this method improved the performance of the SPEC benchmarks by 17%. Decision trees and artificial neural networks have also been used to predict optimal MPI runtime parameters based on static code analysis (Pellegrini et al., 2009), while kernel canonical correlation analysis has been used to predict code transformations to improve performance and energy efficiency (Ganapathi et al., 2009).
This work expands on the above by combining the use of runtime performance counter data with metadata about the execution environment and input dataset to generate classifiers for prediction of optimal values for multiple optimization types.
3. TAU and TAUdb In this work, we apply the TAU Performance System (Shende), a performance measurement, instrumentation, analysis and visualization framework, to the problem of autotuning by integrating TAU with existing code transformation and optimization frameworks. TAU has several important features which are useful in empirical autotuning. For example, TAU can gather execution time data and also access hardware performance counters in CPUs through PAPI (Browne et al., 2000) and in GPUs through CUPTI (Malony et al., 2010). Thus, an autotuning system that depends on multiple performance metrics to reach optimization decisions, or is interested in evaluating multiple objective functions, can use TAU to measured multiple parameters simultaneously. Along with performance metrics, TAU automatically captures metadata describing the execution environment, to allow an autotuning system to understand the measurements in context: data on the CPU type, number of cores, cache sizes, system memory size, operating system, and compiler used are collected, along with other information. Application-specific metadata can also be captured. One example of this is TAU’s support for parameterized profiling, in which performance data is captured separately according to the input parameters to a function, allowing for variation in performance resulting from differences in input to be seen. By capturing both types of metadata, we can analyze not only both the effect of the execution environment and the effect of the input data on performance, we can also examine the interaction between execution environment and input data, as we might expect in the interaction between the size of an input and the size of the available data cache. TAU also includes the TAUdb performance database, based on the earlier PerfDMF database (Huck et al., 2005). It is a performance measurement database designed to store performance profiles of sequential and parallel applications over the course of multiple experiments. It provides for multiple clients to submit performance data to a central repository, for analysis in aggregate. It also features robust support for the storage of metadata. It can import performance data from TAU as well as from many other tools, and provides Java and C APIs for querying and data storage with which autotuning tools can retrieve performance measurements from TAU and store annotated measurements into the database. Data stored in TAUdb can be easily used in the ParaProf visualization system (Bell et al., 2003) and the PerfExplorer data mining framework (Huck and Malony, 2005). PerfExplorer provides an interface through which data stored in TAUdb can be subjected to various analyses, such
Chaimov et al. as clustering and principal component analysis. PerfExplorer is integrated with the Weka library (Hall et al., 2009) to allow access to a large package of data mining and machine learning algorithms, which can be scripted in Python via a Jython interface.
405
CHiLL Recipes
parameters from TauDB
Outlined Function
Active Harmony
4. Integrating TAU 4.1. Active Harmony and CHiLL To achieve the goals set out in the introduction, we integrated TAU, TAUdb and PerfExplorer with two autotuning systems. The first utilized ROSE, CHiLL and Active Harmony as described in Tiwari et al. (2011). The basic workflow of this system is shown in Figure 1. The procedure carried out is as follows: TAU, with PDT (Lindlan et al., 2000), is used to carry out source-based instrumentation of the target application at the function level, which is then run to gather baseline performance information, including wallclock time and any user-specified metrics. These performance measurements and associated metadata are saved into the TAUdb database. 2. A PerfExplorer script is run to carry out triage, evaluating performance data from the initial run to identify potential targets for autotuning. 3. Source-level instrumentation with TAU is repeated, this time instrumenting potential targets at the loop level. In addition, parameterized profiling is used, so that performance data is recorded separately according to input parameters. 4. Target loops are extracted into their own functions for ease of analysis and transformation using the ROSE outliner (Liao et al., 2010). The ROSE outliner is based on the ROSE compiler system (Quinlan, 2000), a compiler framework designed for source-to-source transformation. ROSE parses C, Cþþ and FORTRAN code into a common abstract syntax tree representation which can be traversed, analyzed and modified. The outliner allows the user to specify a section of code to be extracted into a separate function either using compiler pragmas or by ‘‘abstract handles’’ which allow position-independent references to nodes in the AST. During outlining, side-effect and liveness analyses are performed to determine whether it is possible to pass variables by value rather than by reference. By avoiding repeated pointer dereferences inside the outlined function wherever possible, the performance characteristics of the original code are maintained. 5. Active Harmony (Tiwari and Hollingsworth, 2011) and CHiLL (Chen et al., 2008) are used to carry out autotuning of the extracted kernel. Active Harmony is a search engine capable of rapidly exploring the parameter search space by testing multiple hypotheses in parallel, using the Parallel Rank Ordering algorithm to evaluate potential parameters (Tiwari, 2011).
CHiLL
code variant
Selective Instrumentation File (specifying parameters to capture)
1.
tau_instrumentor Instrumented Variant
execute
Parameterized Performance Profile
TAUdb
Figure 1. Workflow of the integrated TAU–CHiLL–Active Harmony system.
The user can specify parameters, ranges for the parameters, and constraints restricting the values parameters can take on. Active Harmony runs using a client–server architecture, in which a centralized Harmony server communicates with, and provides parameters to, multiple clients running on different, identically configured nodes of a cluster. Additional servers can be configured as code servers, which perform compilation of code variants and distribute compiled object files to the execution nodes. CHiLL is a code variant generator which allows the user to specify a series of high-level loop transformations to be applied together. The version of CHiLL used in this integrated system uses ROSE internally to parse code and applies transformations by making modifications to the ROSE AST. It uses a polyhedral model of loop transformations. CHiLL recipes can be parameterized, and autotuning can be performed by searching the space of parameters to available recipes. CHiLL recipes also allow for specialization by indicating known loop bounds. This can enable optimizations which otherwise would not be available. A version of CHiLL known as CUDA-CHiLL (Rudy et al., 2011) can generate CUDA code for execution on GPUs from standard C code. Active Harmony proposes CHiLL-recipe parameters which are used to generate a code variant, which is
406
The International Journal of High Performance Computing Applications 27(4)
Orio Code Generator
Links at Runtime Experiment
CUPTI callback measurement library
Writes TAU Metadata Entries Transformations Writes
TAU Profiles
Execution Time Uploaded
TAUdb
Figure 2. Workflow of the integrated TAU and Orio system.
# of Blocks
Unroll factor
Preferred L1 Size
CFLAG
Warps Per SM
Kernel Execution Time
Threads Per Block
Figure 3. PerfExplorer-generated component analysis of parameters used in the generation of optimized CUDA matrix multiply kernels by Orio.
instrumented using TAU. The application is run using the generated variant, with the gathered performance data being saved into TAUdb. The database entries are annotated with the name of the CHiLL script used and its parameters. In Section 4, we show how the TAU-integrated Active Harmony-CHiLL workflow is used in automatic specialization.
4.2. Orio We also integrated TAU with the Orio performance tuning framework orio. Orio differs from CHiLL in that it integrates its own search engine, rather than relying on an external search engine such as Active Harmony, and operates not on original source files written in general-purpose languages such as C or Fortran, but rather on domainspecific languages, such as a restricted subset of C which disallows pointer arithmetic.
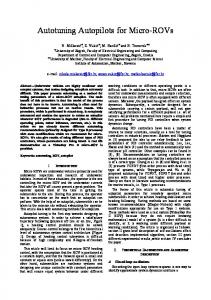
Orio is highly extensible, allowing for new input and output languages to be defined. It also provides support for user-specified skeleton functions used to test the performance of generated variants; as such, a skeleton function using TAU timers can be used in place of the defaults packaged with Orio. Orio was also modified to save parameterized performance data into TAUdb, as with the Active Harmony–CHiLL workflow described above. The Orio workflow is depicted in Figure 2. Since TAUdb provides a common representation for parameterized performance data, autotuning experiments from both the Active Harmony–CHiLL and the Orio-based workflows can be processed using the same tools. As an example of the Orio workflow, Orio was used to autotune a matrix multiplication kernel, generating CUDA code for execution on a GPU. Over the course of the autotuning process, 2,048 different code variants were generated and evaluated, with annotated performance data for each
Chaimov et al.
407
Figure 4. Kernel execution time and GPU occupancy as a function of the number of threads across generated optimized CUDA matrix multiply kernels by Orio.
being saved into TAUdb. Once in TAUdb, PerfExplorer was used to do component analysis to reveal the effects of different tuned parameters on the overall execution time of the generated kernels; see Figure 3. That analysis shows that threads per block, number of blocks, and number of warps per streaming multiprocessor are more highly correlated with minimum achievable runtime, while other factors were less correlated with runtime. Individual parameters can be investigated in more depth, as in Figure 4.
5. Automatic specialization Once metadata-annotated performance measurements are loaded into TAUdb, we can process the data with machine learning algorithms to generate classifiers for purposes of selecting high-performance code variants. We use decision tree learning (Quinlan, 1993) to generate such a classifier, using metadata about system and input data to make a selection. Decision tree learning is used in preference to other types of classifiers because they are simple and straightforward to evaluate and can be examined by the user, who can see the relationships between features in the tree. In contrast, other classifier types, notably neural networks, are difficult for a human to interpret in any meaningful way. The workflow is shown in Figure 5. A decision tree is generated from data in TAUdb using Weka’s J48 algorithm invoked from a PerfExplorer script; an example is shown in Figure 6. Once a decision tree has been generated, it is read by a ROSE-based tool which constructs the AST of a wrapper function and unparses it to C or Cþþ code. The wrapper function is then inserted into the original source code in place of the call to the outlined function. The wrapper function represents the tree as a series of if-then-else statements (for binary decision trees) or switch statements (for n-ary decision trees where n > 2). Code to evaluate each decision node is provided for each of the default types of metadata generated by the framework. If application-
TAUdb
profile data and metadata
WEKA Code Variants
decision tree induction algorithm ROSE-based Code Generation Tool
Wrapper Function
Figure 5. Wrapper-generation workflow for automatic specialization and runtime-adaptive code.
specific metadata is used as a feature in constructing the decision tree, the user must provide a function for runtime evaluation.
408
The International Journal of High Performance Computing Applications 27(4)
PARAM_k =10
=2
PARAM_m =10 PARAM_n =10 MM_v1
? MM_v0
MM_v7
PARAM_n
? MM_v0 =100 MM_v2
=10
=2
? MM_v6
PARAM_m =2 MM_v3
PARAM_m
=8
?
=10
MM_v0
MM_v4
MM_v5
?
=100
MM_v0
MM_v6
Figure 6. A decision tree for selecting an optimized variant of a matrix multiply kernel specialized for the most frequently encountered dimensions. Table 1. Performance improvements in a matrix multiply kernel from autotuning and specialization.
Speedup
Original
Autotuned
Specialized
1.000
1.341
1.712
5 Default starting configuration Predicted starting configuration
4 Time (s)
This decision-tree-based wrapper function can be used for automatic specialization. In specialization, function variants are generated which take advantage of known properties of their inputs. Since TAU can capture input parameters to functions along with performance measurements, we can automatically identify the most frequently encountered parameters and generate specialized variants during autotuning. Input parameters can then be used as features during decision tree learning, so that the wrapper function will select a function variant based on input parameters. Specialization was used by Shin et al., (2010) to generate variants of a matrix multiply routine optimized for particular matrix sizes, which generated a wrapper function to select a variant based upon a custom-designed algorithm which evaluates matrix dimensions in an order designed to minimize the number of comparisons needed. Decision tree learning achieves this objective automatically, since J48 is biased towards small trees, places highly informative nodes near the root, and trims the tree, replacing interior nodes with leaf nodes, when the resulting information loss is small. To evaluate the ability of the decision tree learning methodology to assist in specialization based on input, we used the Active Harmony–CHiLL-based workflow to generate specialized variants of a naı¨ve dense matrix multiply kernel. The matrix multiply kernel was called with a test set of randomly generated matrices of different dimensions containing both ‘‘small’’ (fits entirely in cache) and ‘‘large’’ (does not fit entirely in cache) matrices, with some small matrix sizes being more common than others, providing an opportunity for improving performance by specializing for common matrix sizes. Parameterized transformation scripts allowed for varying levels of loop unrolling and loop tiling, and for permutation and splitting of loops. Two autotuning rounds were run: in the first, specialization and wrapper-function generation was disabled; one autotuned kernel was output and was used for all matrices in the test set. In the second, specialization was used, using matrix
3 2 1 0
0
10
20
30
40
50 60 70 Evaluations
80
90
100
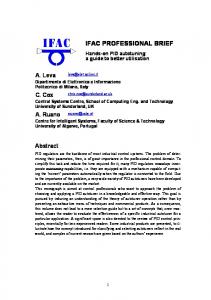
Figure 7. Evolution of the search process for a matrix multiply kernel on an NVIDIA GTX 480 GPU when the default starting configuration is used (red) and when a starting configuration based on runs in different execution environments is used (green).
dimensions as parameters for runtime selection of a variant. By taking advantage of opportunities, overall performance was increased, as shown in Table 1. Learning a classifier for selecting optimal unrolling factors and tile sizes allowed these to be predicted without an architectural expert manually producing a model directly incorporating architectural features, which is an alternate approach (Murthy et al., 2010). Another use for machine learning in autotuning is in the selection of a good starting point in the search space; in this case, we learn a decision tree the leaves of which represent not code variants themselves but the parameters which
Chaimov et al.
409
10 Default starting configuration
9
Predicted starting configuration 8
Time (s)
7 6 5 4 3 2 1 0 0
2
4
6
8 10 12 14 16 18 20 22 24 26 28 30 32 34 36 38 40 42 44 46 48 50 Evaluations
Figure 8. Evolution of the search process for a matrix multiply kernel on an Knights Corner Intel MIC card when the default starting configuration is used (red) and when a starting configuration based on runs on four NVIDIA GPU models is used (green).
generate the code variant. When we run another round of autotuning in a new execution environment or on a new dataset, we first measure the performance of the unoptimized code to gather baseline parameterized performance information. The baseline profile is used as input to the classifier, yielding a set of parameters which are given to the search engine as the starting point. To test this, we used the matrix multiply kernel described above, but used CUDA–CHiLL to generate CUDA kernels. The test set contained only large matrices, as the cost of copying small matrices to device memory would eliminate any performance increase from faster computation. Autotuning was performed using the same test set on different GPUs: NVIDIA C2050, C2070, S1070 and GTX 480 GPUs were used. For each card, autotuning was performed for the other three to generate a dataset used to build a decision tree which was used to predict a starting point for the card under consideration. The configuration with the best performance varied with the targeted GPU. Figure 7 shows the evolution of the search process on the GTX 480 for the default configuration and for the predicted configuration based upon trials on the other three GPU models. The predicted initial configuration had better performance than the default configuration, regardless of whether prior information was used, the search on each individual GPU eventually converged to the same best configuration for that GPU model . However, the use of prior information could increase search time when the tested architecture is sufficiently different from those the classifiers were trained on. In the above example, all cards were NVIDIA GPUs of varying specifications. If this classifier is used to predict initial search configurations for an unrelated architecture, the performance of the chosen initial configuration can be worse than that of the default configuration. Figure 8 shows
that search performance is degraded when the GPU-trained classifier is used in autotuning the same code on an Intel MIC card. Hence, some degree of architectural similarity is required to benefit from initial configuration prediction. Another use of the ability to select a variant at runtime arises because the conversion to CUDA code is, like unrolling or tiling, a step in a transformation recipe. By providing transformation recipes with and without the cudaize step, the generated wrapper function is able to select whether or not to use the GPU. This allows the wrapper function to invoke a CPU-based variant for datasets small enough that the increased performance of the GPU does not overcome the additional latency required to transfer data between the host and GPU, and to invoke a GPU-based function otherwise.
6. Conclusion In this paper, we have shown how the TAU suite of tools, including the TAU instrumentor, TAUdb and PerfExplorer can be integrated with autotuning tools such as Active Harmony, CHiLL and Orio to automate collection of performance data annotated with metadata identifying properties of the execution environment and the input data. We then showed how annotated performance data can be used to learn classifiers which can be used for runtime selection of specialized function variants and for reducing the number of evaluations necessary for autotuning. Funding The research at the University of Oregon was supported by a grant from the U.S. Department of Energy, Office of Science (contract number DE-SC0006723).
410
The International Journal of High Performance Computing Applications 27(4)
References Bell R, Malony A and Shende S (2003) Paraprof: A portable, extensible, and scalable tool for parallel performance profile analysis. In: Euro-Par 2003 Parallel Processing, pp. 17–26. Browne S, Dongarra J, Garner N, Ho G and Mucci P (2000) A portable programming interface for performance evaluation on modern processors. International Journal of High Performance Computing Application 14(3): 189–204. DOI: 10. 1177/109434200001400303. Cavazos J, Fursin G, Agakov F, Bonilla E, O’Boyle MFP and Temam O (2007) Rapidly selecting good compiler optimizations using performance counters. In: Proceedings of the International Symposium on Code Generation and Optimization (CGO ‘07). Washington, DC: IEEE Computer Society, pp. 185–197. DOI: 10.1109/CGO.2007.32. Chen C, Chame J and Hall M (2008) CHiLL: A framework for composing high-level loop transformations. Technical report, University of Utah. Frigo M, Steven and Johnson G (2005) The design and implementation of FFTW3. Proceedings of the IEEE 93(2): 216–231. Ganapathi A, Datta K, Fox A and Patterson D (2009) A case for machine learning to optimize multicore performance. In: Proceedings of the First USENIX conference on Hot topics in parallelism (HotPar ‘09). Berkeley, CA, USA: USENIX Association. Hall M, Frank E, Holmes G, Pfahringer B, Reutemann P and Witten IH (2009) The WEKA data mining software: an update. SIGKDD Explorations Newsletter 11(1): 10–18. DOI: 10. 1145/1656274.1656278. Hartono A, Norris B and Sadayappan P (2009) Annotation-based empirical performance tuning using Orio. In: Proceedings of the 23rd IEEE International Parallel & Distributed Processing Symposium, Rome, Italy. Also available as Preprint ANL/ MCS-P1556-1008, http://www.mcs.anl.gov/uploads/cels/papers/ P1556.pdf. Hollingsworth J and Tiwari A (2010) End-to-End Auto-Tuning with Active Harmony, chapter 10. Boca Raton, FL: CRC Press, pp. 217–238. DOI: 10.1201/b10509-11. Huck KA and Malony AD (2005) PerfExplorer: A performance data mining framework for large-scale parallel computing. In: Proceedings of the 2005 ACM/IEEE conference on Supercomputing (SC ‘05). Washington, DC, USA: IEEE Computer Society, pp. 41–53. DOI: 10.1109/SC.2005.55. Huck KA, Malony AD, Bell R and Morris A (2005) Design and implementation of a parallel performance data management framework. In: Proceedings of the International Conference on Parallel Computing, pp. 473–482. Liao C, Quinlan DJ, Vuduc R and Panas T (2010) Effective source-to-source outlining to support whole program empirical optimization. In: Proceedings of the 22nd international conference on Languages and Compilers for Parallel Computing (LCPC ‘09). Berlin: Springer-Verlag, pp. 308–322. DOI: 10. 1007/978-3-642-13374-9_21. Lindlan KA, Cuny J, Malony AD, et al. (2000) A tool framework for static and dynamic analysis of object-oriented software
with templates. In: Proceedings of the 2000 ACM/IEEE conference on Supercomputing (Supercomputing ‘00). Washington, DC, USA: IEEE Computer Society (CDROM). Malony AD, Biersdorff S, Spear W and Mayanglambam S (2010) An experimental approach to performance measurement of heterogeneous parallel applications using cuda. In: Proceedings of the 24th ACM International Conference on Supercomputing (ICS ‘10). New York: ACM Press, pp. 127–136. DOI: 10.1145/1810085.1810105. Monsifrot A, Bodin F and Quiniou R (2002) A machine learning approach to automatic production of compiler heuristics. In: Proceedings of the 10th International Conference on Artificial Intelligence: Methodology, Systems, and Applications (AIMSA ‘02). London: Springer-Verlag, pp. 41–50. Murthy G, Ravishankar M, Baskaran M and Sadayappan P (2010) Optimal loop unrolling for GPGPU programs. In: 2010 IEEE International Symposium on Parallel Distributed Processing (IPDPS), pp. 1–11. DOI: 10.1109/IPDPS.2010.5470423. Pellegrini S, Wang J, Fahringer T and Moritsch H (2009) Optimizing MPI runtime parameter settings by using machine learning. In: Proceedings of the 16th European PVM/MPI Users’ Group Meeting on Recent Advances in Parallel Virtual Machine and Message Passing Interface. Berlin: SpringerVerlag, pp. 196–206. DOI: 10.1007/978-3-642-03770-2_26. Quinlan DJ (2000) ROSE: Compiler support for object-oriented frameworks. Parallel Processing Letters 10(2/3): 215–226. Quinlan JR (1993) C4.5: Programs for Machine Learning. San Francisco, CA: Morgan Kaufmann Publishers Inc. Rudy G, Khan MM, Hall M, Chen C and Chame J (2011) A programming language interface to describe transformations and code generation. In: Proceedings of the 23rd international conference on Languages and compilers for parallel computing (LCPC ‘10). Berlin: Springer-Verlag, pp. 136–150. Shende SS and Malony AD (2006) The TAU parallel performance system. International Journal of High Performance Computing Application 20(2): 287–311. DOI: 10.1177/1094342006 064482. Shin J, Hall MW, Chame J, Chen C, Fischer PF and Hovland PD (2010) Speeding up nek5000 with autotuning and specialization. In: Proceedings of the 24th ACM International Conference on Supercomputing (ICS ‘10). New York: ACM Press, pp. 253–262. DOI: 10.1145/1810085.1810120. Stephenson M and Amarasinghe S (2005) Predicting unroll factors using supervised classification. In: Proceedings of the International Symposium on Code Generation and Optimization (CGO ‘05). Washington, DC: IEEE Computer Society, pp. 123–134. DOI: 10.1109/CGO.2005.29. Tiwari A (2011) Tuning Parallel Applications in Parallel. Ph.D. thesis, University of Maryland, College Park. Tiwari A and Hollingsworth JK (2011) Online adaptive code generation and tuning. In: Proceedings of the 2011 IEEE International Parallel and Distributed Processing Symposium (IPDPS ‘11). Washington, DC: IEEE Computer Society, pp. 879–892. DOI: 10.1109/IPDPS.2011.86. Tiwari A, Hollingsworth JK, Chen C, et al. (2011) Auto-tuning full applications: A case study. International Journal of High
Chaimov et al. Performance Computing Application 25(3): 286–294. DOI: 10.1177/1094342011414744. Whaley C, Petitet A and Dongarra JJ (2000) Automated empirical optimization of software and the ATLAS project. Parallel Computing 27: 2001. Whaley RC and Dongarra JJ (1998) Automatically tuned linear algebra software. In: Proceedings of the 1998 ACM/IEEE conference on Supercomputing (Supercomputing ‘98). Washington, DC: IEEE Computer Society, pp. 1–27 (CDROM).
Author biographies Nicholas Chaimov is a Ph.D. student in the Department of Computer and Information Science at the University of Oregon (UO). He is a graduate research assistant in the Performance Research Lab at the University of Oregon. His research concerns optimization of code for highperformance computing and data mining of performance profiles. Scott Biersdorff is a software engineer in the TAU group at the University of Oregon (UO). He received his B.S. degree in the Department of Computer and Information Science at the University of Oregon. He is interested in the use of parallel tools for studying application performance behavior on large-scale systems, in particular, heterogeneous platform that deploy application accelerators, such as GPUs.
411 He led the development effort to integrate GPU performance measurement and analysis in the TAU Performance System. Allen D Malony is a Professor in the Department of Computer and Information Science at the University of Oregon (UO). He has extensive experience in performance benchmarking and characterization of high-performance computing (HPC) systems, and has developed performance evaluation tools for a variety of parallel machines in the last 20 years. In particular, his research group has created the TAU Performance System, a leading open-source parallel performance tool suite in use by many academic, governmental and industrial projects around the world. He was awarded the NSF National Young Investigator award, was a Fulbright Research Scholar to The Netherlands and Austria, and received the prestigious Alexander von Humboldt Research Award for Senior U.S. Scientists by the Alexander von Humboldt Foundation. His research interests are in parallel computing, performance analysis, supercomputing, scientific software environments and neuroinformatics. His work is funded by the National Science Foundation, the Department of Energy, the National Institutes of Health, and the Department of Defense. He is CEO of ParaTools, Inc. which he founded with Dr Sameer Shende in 2004.