TopRecs: Top-k Algorithms for Item-based Collaborative Filtering Mohammad Khabbaz
Laks V.S. Lakshmanan
University of British Columbia Department of Computer Science
University of British Columbia Department of Computer Science
[email protected]
[email protected]
ABSTRACT
General Terms
Recommender systems help users find their items of interest from large data collections with little effort. Collaborative filtering (CF) is one of the most popular approaches for making recommendations. While significant work has been done on improving accuracy of CF methods, some of the most popular CF approaches are limited in terms of scalability and efficiency. The size of data in modern recommender systems is growing rapidly in terms of both new users and items and new ratings. Item-based recommendation is one of the CF approaches used widely in practice. It computes and uses an item-item similarity matrix in order to predict unknown ratings. Previous works on item-based CF method confirm its usefulness in providing high quality top-𝑘 results. In this paper, we design a scalable algorithm for top-𝑘 recommendations using this method. We achieve this by probabilistic modeling of the similarity matrix. A unique challenge here is that the ratings that are aggregated to produce the aggregate predicted score for a user should be obtained from different lists for different candidate items and the aggregate function is non-monotone. We propose a layered architecture for CF systems that facilitates computation of the most relevant items for a given user. We design efficient top-𝑘 algorithms and data structures in order to achieve high scalability. Our algorithm is based on abstracting the key computation of a CF algorithm in terms of two operations – probe and explore. The algorithm uses a cost-based optimization whereby we express the overall cost as a function of a similarity threshold and determine its optimal value for minimizing the cost. We empirically evaluate our theoretical results on a large real world dataset. Our experiments show our exact top-k algorithm achieves better scalability compared to solid baseline algorithms.
Algorithms, Performance, Reliability
1.
INTRODUCTION
The number of items offered by modern information systems is growing rapidly. Browsing large collections and finding the right item of interest is not a trivial task for typical users. Recommender systems help users find their items of interest with little effort, through personalized recommendations. They take advantage of ratings by users on items they have previously experienced and make predictions. Collaborative filtering (CF) has gained significant attention as the most popular recommendation paradigm [1]. CF approaches take as input a huge sparse matrix, consisting of ratings of users on items. They output the most relevant (top-𝑘) items to the current or active user by predicting her unknown ratings on candidate items. Most of the previous research on collaborative filtering has been concerned with improving the accuracy of predictions. Clearly, besides accuracy, scalability is an important concern, given the ever growing number of users and items in today’s recommender systems. An example of such a system is Google News which has millions of visitors every day and a growing number of news feeds every second [4]. Other examples include Netflix1 and Amazon2 , with large collections of items and users. New ratings, items and users are being added to the ratings matrix constantly and need to be reflected in the top-𝑘 recommendations. Computing the list of top-𝑘 items repeatedly for all users or at login time for the active user can be costly, calling for efficient top-𝑘 algorithms. One of the standard and most popular approaches for collaborative filtering is item-based collaborative filtering (CF). It is known to provide high quality top-𝑘 results [5,12]. The main idea behind this approach is to calculate a similarCategories and Subject Descriptors ity matrix whose entries correspond to pairwise item similarities, Pearson Correlation [11] being one of the popular H.3.3 [Information Storage and Retrieval]: Information Search and Retrieval—Information Filtering; I.1.2 [Computing choices. Computing recommendations from scratch for active users can be prohibitively expensive so CF-based recMethodologies]: Algorithms—Analysis of Algorithms ommender systems typically precompute item-wise similarities and store them in a manner that facilitates quick retrieval [5]. Following this approach, the task of predicting the score of the active user (𝑢𝑖 ) on an item (𝑣𝑗 ) consists of Permission to make digital or hard copies of all or part of this work for the following steps: personal or classroom use is granted without fee provided that copies are not made or distributed for profit or commercial advantage and that copies bear this notice and the full citation on the first page. To copy otherwise, to republish, to post on servers or to redistribute to lists, requires prior specific permission and/or a fee. EDBT 2011, March 22–24, 2011, Uppsala, Sweden. Copyright 2011 ACM 978-1-4503-0528-0/11/0003 ...$10.00
∙ Find the 𝑁 most similar items to 𝑣𝑗 that 𝑢𝑖 has rated, referred to as 𝑣𝑗 ’s 𝑁 nearest neighbors in 𝑢𝑖 ’s profile. 1 2
http://www.netflix.com/ http://www.amazon.com
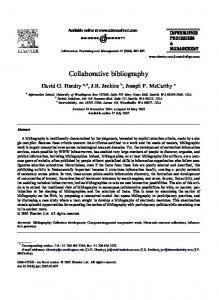
∙ Compute a weighted average of 𝑢𝑖 ’s ratings on the 𝑁 items weighted by similarities, as the predicted rating or score of 𝑣𝑗 by 𝑢𝑖 . Once item scores are predicted, those with highest predicted scores are served to the user. There has been a great deal of work on efficient algorithms for finding top-𝑘 items in various settings. In classic top-𝑘 settings, the scores of items on each of 𝑚 features are available from 𝑚 score-sorted lists. The challenge is to devise top-𝑘 algorithms that access the least number of items. This challenge is met by the TA and NRA family of algorithms [6] and their numerous descendants [3, 10, 15, 16, 19]. Compared with the classic settings, finding top-𝑘 in item-based CF raises two unique major challenges: (1) Unlike in previous work, we need to deal with the fact that the aggregate score of every candidate item must be determined based on entries from a different set of lists. This is because the 𝑁 most similar items for every candidate item may be different in a given user profile. (2) Weighted average is not a monotone aggregate function, a property leveraged by classic top-𝑘 algorithms. While there has been some recent work on top-𝑘 algorithms with non-monotone aggregate functions [10, 16, 19], to our knowledge, no previous work on top-𝑘 addresses the combination of variable set of lists to aggregate from and non-monotone aggregate functions. Our goal in this paper is to devise an approach for itembased CF3 that is scalable while retaining the accuracy of known CF algorithms. We show that a direct approach based on extending TA/NRA-like ideas to the framework of CF either calls for unrealistic preprocessing and storage requirements or leads to algorithms which end up accessing as many entries as certain naive algorithms to be discussed later. Thus, we propose an alternative approach based on abstracting the key computation in CF by means of two operations that we call probe and explore. Probe is the process of identifying which (𝑁 ) lists must be aggregated for a given candidate item and explore is the process of finding top-𝑘 items to be recommended, having found the lists to be aggregated. In Sec. 3, We show probe is the dominant component in execution cost. Our approach is based on using a similarity threshold value to make the probe step more efficient. We propose a probabilistic cost-based approach whereby we can express the overall expected cost of the probe step as a function of the similarity threshold and determine the best value of the threshold that minimizes the cost. We propose a scalable recommender system based on the core item-based CF method described above, with an acrhitecture consisting of the following layers (see Fig. 1): (i) Data layer, consisting of the user/item ratings matrix; (ii) Intermediate layer, consisting of the item-item similarity matrix, sufficient statistics and required routines for efficiently keeping the similarity matrix up-to-date. This layer also maintains the data structures used by top-𝑘 algorithms, and keeps them current; (iii) Application layer, including efficient top-𝑘 algorithms running on the top of the intermediate layer data. This layer invokes the probe operation using the similarity threshold determined through cost-based optimization, and finds top-𝑘 items via the explore operation. Top-𝑘 algorithms can work independently from the intermediate layer and access up to date data structures from 3 Henceforth, unless specified otherwise, by CF we mean item-based CF.
Application Layer Similarity threshold
Input parameters
Cost‐based optimization
Top‐k Algorithm Two Phase Algorithm h l h (Probe)
Explore
Exact top k Exact top‐k
I Intermediate Layer di L Similarity Distribution(s) (Distribution parameters)
Sufficient statistics and routines for updating p g
Data structures
SSimilarity a y matrix
Data Layer Ratings Matrix
Figure 1: Layered architecture and its components
that layer. We explore the design space by considering two straightforward top-𝑘 algorithms and then propose our algorithm based on probe and explore operations. We show probe cost dominates explore cost. Thus, we propose a two phase algorithm for performing probe efficiently. In the first phase, we calculate a threshold on similarity values. The similarity threshold is found in such a way as to maximize (resp., minimize) the probability that items with similarity values larger (smaller) than the threshold are among the 𝑁 nearest neighbors of items. Efficiency and scalability come from the fact that after the first phase, as a result of using similarity threshold, a huge portion of the similarity matrix is filtered and the size of the problem is reduced significantly. The second phase completes probe by finding missing neighbors and removing irrelevant entries retrieved in the first phase. We define an objective function which is an upper bound on the expected cost of both phases put together and find the optimal value of the threshold that minimizes the cost. We model the similarity matrix with probability distribution(s) in order to facilitate probabilistic analysis. We propose an efficient algorithm for finding top-𝑘 recommendations. We make the following contributions: ∙ We propose (Fig. 1) a layered system for item-based collaborative filtering. Our system is highly scalable and efficient while returning the same exact top-k as item-based CF. It also keeps the similarity matrix upto-date with respect to new users and items added to data, as well as new ratings. This makes our system suitable for requirements of modern recommender systems. ∙ We propose two naive algorithms that serve as a baseline for calibrating the performance of the algorithms we consider. This naturally leads to a hybrid algorithm that combines their strengths (Sec. 3). ∙ We show that an approach based on extending TA/NRA style algorithms either requires an unreasonable amount of preprocessing and storage or leads to algorithms which can access as many entries as naive algorithms introduced in Sec. 3 (Sec. 4).
∙ We design a novel top-𝑘 algorithm for item-based collaborative filtering. The algorithm is based on finding a similarity threshold value that optimizes the expected cost (Sec. 5). ∙ We evaluate the algorithms theoretically and empirically in terms of their running time and scalability. We empirically show our top-𝑘 algorithm is superior to the baseline methods in providing exact top-𝑘 recommendations in a more scalable way (Sec. 5 and Sec. 6). Sec. 2 discusses the related work on scalable item-based CF methods and top-𝑘 algorithms. Sec. 7 concludes the paper.
2.
RELATED WORK
Item-based CF and Scalability: There has been extensive work on collaborative filtering. The prevalent approaches fall into the categories of user-based, item-based, modelbased CF or fusion approaches. We refer the reader to [1,7,8] for excellent surveys. User-based methods predict unknown ratings based on ratings of 𝑁 nearest users who have rated the item. This requires computing and maintaining an 𝑛 × 𝑛 user-user similarity matrix. The number of users 𝑛 is typically much larger than the number of items 𝑚. Item-based CF was first proposed in [5, 12] to overcome these limitations. In addition to improving scalability, it has been found that pairwise item similarities are usually more reliable than pairwise user similarities and result in better accuracy [12]. In item-based CF, the rating of an active user on a candidate item is predicted based on her ratings on 𝑁 items most similar to the candidate item. Sarvar et al. [12] propose a scalable approach which relies on storing only 𝑁 (between 10 and 30) most similar items to every item rather than the whole matrix. A general drawback of this method arises when the active users rated fewer than 𝑁 items among items they have stored, resulting in loss of accuracy. In extreme cases, it may be impossible to make reasonable prediction of rating for some (user, item) combinations. Model-based methods [4] assume the ratings matrix has been generated from a model and use the observed data to learn optimal parameter values of the model. Despite their efficiency they suffer from lack of explainability. Besides, since they find model parameters through optimization, they have a training phase. Changing parameters incrementally and adapting to changes in data is not a trivial problem. In sum, item-based CF is one of the popular approaches for collaborative filtering and devising scalable and efficient algorithms for its computation is of great importance. Indeed, there have been several works in the literature that aim at improving scalability of item-based methods [13, 17, 18]. In [13], singular value decomposition (SVD) is applied first in order to represent users and items in a lower dimensional space. Neighborhood formation is based on this compact representation of the original set of ratings. Our main focus is on top-𝑘 algorithms that run on top of the original and up to date similarity matrix. Another line of work has focused on instance selection for improving scalability [13, 17, 18]. Rather than considering the set of all users and items for finding nearest neighbors, they find a small subset that results in better accuracy compared to other subsets. Instance selection can indeed improve scalability albeit at the expense of accuracy. Besides, our approach is orthogonal to instance selection and one could use both instance selection together
with our efficient top-𝑘 algorithms for improving scalability. There are other recent research directions relevant to scalability [21, 22]. In [21], the focus is making recommendations to groups of people and [22] deals with the problem of using DBMS engine for making flexible recommendations. None of these works focus on the issue of making standard existing recommendation approaches more scalable. Top-𝐾 Algorithms: Top-𝑘 algorithms have been studied extensively. Most of the related work builds on top of classic TA and NRA algorithms [6]. These algorithms assume a monotone aggregate function and the set of lists from which the aggregation is performed is known beforehand. Compared to these algorithms, in our problem we face two major challenges: (i) our aggregation function is not monotone; (ii) the set of lists from which values are to be aggregated is not fixed and could change from item to item. Several recent works address the issue of non-monotone aggregation functions [10, 16, 19] although the issue of dealing with different sets of lists to aggregate scores from has not been addressed before, to our knowledge. The main idea leveraged in all cases is defining an upper bound on the score of unseen objects and a lower bound on the score of top-𝑘 items. The algorithm stops when the former becomes no greater than the latter. As we show in the paper, an adaptation of TA/NRA-like approaches to deal with changing set of lists for aggregating scores from leads to an algorithm which can be arbitrarily worse than the optimal algorithm on some instances. In contrast, we propose a significantly different algorithm for computing top-𝑘 items. It is based on organizing top-𝑘 computation in terms of probes and explores and choosing an optimal similarity threshold using cost-based optimization.
3.
PRELIMINARIES AND NAIVE ALGORITHMS
In collaborative filtering, data is represented as a sparse 𝑛 × 𝑚 matrix 𝑅, with entry 𝑟𝑖𝑗 , the rating of 𝑖𝑡ℎ user on 𝑗 𝑡ℎ item, taking on integer values from the set {1, 2, ..., 𝐶}, for some 𝐶 > 1. The main challenge is to predict the missing ratings in 𝑅. Henceforth, we use 𝑟𝑖𝑗 to refer to the existing ratings of 𝑖𝑡ℎ user on 𝑗 𝑡ℎ item. We refer to 𝑖𝑡ℎ user (row) as 𝑢𝑖 and to 𝑗 𝑡ℎ item (column) as 𝑣𝑗 . Notice that from a behavioral perspective, we can identify the 𝑖𝑡ℎ user (resp., 𝑗 𝑡ℎ item) with row 𝑢𝑖 (resp., column 𝑣𝑗 ). When we refer to 𝑢𝑖 (resp., 𝑣𝑗 ) below, we mean either user 𝑖 (resp., item 𝑗) or row 𝑖 (resp., column 𝑗). We use 𝑟 ∈ 𝑢𝑖 (resp., 𝑟 ∈ 𝑣𝑗 ) to denote an existing rating in user 𝑢𝑖 ’s row (item 𝑣𝑗 ’s column). We use ⌢ 𝑟 𝑖𝑗 for the predicted value of the active user 𝑢𝑖 ’s unknown rating on a candidate item 𝑣𝑗 . In the rest of this paper we use 𝜇𝑖 to refer to the number of items rated by 𝑢𝑖 and 𝜇 to denote the average number of items rated by any user. We use 𝑠𝑖𝑗 to denote the similarity between items 𝑣𝑖 and 𝑣𝑗 . ⌢ Prediction of 𝑟 𝑖𝑗 in item-based collaborative filtering is done typically by taking the weighted average of ratings of 𝑢𝑖 on 𝑁 most similar items to 𝑣𝑗 . More formally, we can use the following equation, where N(𝑣𝑗 , 𝑢𝑖 ) denotes the set of 𝑁 items that are most similar to 𝑣𝑗 and are rated by 𝑢𝑖 :
⌢
𝑟 𝑖𝑗 = (
𝑁 ∑ 𝑥=1
𝑠𝑥𝑗 × 𝑟𝑖𝑥 ) / (
∑
𝑣𝑦 ∈N(𝑣𝑗 ,𝑢𝑖 )
𝑠𝑦𝑗 )
(1)
Problem Studied: Given an active user 𝑢𝑖 , the problem is to efficiently find the top-𝑘 items with the highest predicted rating. We call this the problem of finding top-𝑘 recommendations. Predicting the rating of a candidate item 𝑣𝑗 requires identifying the 𝑁 items that are most similar to 𝑣𝑗 and are rated by 𝑢𝑖 , and then aggregating their ratings using Eq. 1. It is worth mentioning that user-based CF is another method for making predictions that uses the weighted average of ratings of 𝑁 most similar users to 𝑢𝑖 for prediction. All of our ideas in this paper can be easily extended to be used in user-based CF as well. We have chosen item-based CF since it provides better accuracy and requires less storage [12]. The first natural question, given the body of work on the TA/NRA family of top-𝑘 algorithms, is whether we can adapt those algorithms and design efficient top-𝑘 algorithms for finding top-𝑘 recommendations. We address this question in Section 4. In the next subsections, we present two naive algorithms that will serve as baselines for the top-𝑘 algorithms considered in this paper. For convenience, for a given item 𝑣𝑗 , by the 𝑁 nearest neighbors of 𝑣𝑗 we mean the 𝑁 most similar items to 𝑣𝑗 .
3.1
Algorithm Naive-1
For both Algorithms Naive-1 and Naive-2, we assume pairwise item similarities are materialized. A straightforward procedure for finding top-𝑘 items with respect to 𝑢𝑖 is as follows: 1. Predict the score4 of each individual candidate item, 𝑣𝑗 , using Eq. 1. This involves finding 𝑁 most similar items to 𝑣𝑗 in 𝑢𝑖 ’s profile, i.e., the set N(𝑣𝑗 , 𝑢𝑖 ). Finding 𝐾 items with highest values in a list of 𝑚 items has been studied extensively in the literature as the 𝐾-𝑆𝑒𝑙𝑒𝑐𝑡 problem [9]. Here, since values of 𝑁 are in the range 10-30 in practice, we can perform this task by a simple scan of the list and maintain a priority queue. This is doable in 𝑂(𝑚𝑙𝑜𝑔𝑁 ). Since 𝑁 is typically a small number, this approach is typically more efficient than the best deterministic algorithm for the general 𝐾-Select problem which takes Θ(10𝑚) using the median of medians approach [9] and we prefer to use it. After finding 𝑁 nearest neighbors of each item (rated ⌢ by 𝑢𝑖 ), aggregating their ratings and calculating 𝑟 𝑖𝑗 takes 𝑂(𝑁 ) time. Thus, the total cost of predicting the score of an individual candidate item is 𝑂(𝑚𝑙𝑜𝑔𝑁 +𝑁 ) and the cost of predicting scores of all candidate items is 𝑂(𝑚2 𝑙𝑜𝑔𝑁 + 𝑚𝑁 ). In practice, it is possible to improve this by searching for 𝑁 nearest neighbors of 𝑣𝑗 only within the list of items rated by the user, which will result in 𝑂(𝑚𝜇𝑖 𝑙𝑜𝑔𝑁 + 𝑚𝑁 ) cost where 𝜇𝑖 is the number of items rated by user 𝑢𝑖 . This improvement is possible provided the list of items rated by any given user is stored separately in addition to the ratings matrix. Storing such information adds a cost of 𝑂(𝑛𝜇) to the storage, where 𝜇 is the average number of items rated by a user. This is of the same order as the cost of efficiently storing the sparse ratings matrix and we can assume access to this information. 2. Once the score of every item is calculated in previous 4
We use score and rating interchangeably.
step, find 𝑘 items with highest scores in 𝑂(𝑚𝑙𝑜𝑔𝑘). The total running time of the above algorithm is 𝑂([𝜇𝑖 𝑙𝑜𝑔𝑁 + 𝑁 + 𝑙𝑜𝑔𝑘] × 𝑚). We can see that finding the top-𝑘 items to recommend to a given user involves two steps: (i) Probe every candidate item in order to find the 𝑁 items in the user’s profile that are most similar to it. (ii) Explore the list of candidate items and calculate their scores and then find the top-𝑘 items that have the highest scores. Step (ii) is necessary in order to find the best scoring 𝑘 items. For any item, determining its score requires that we know the 𝑁 most similar items to it, which is addressed by step (i). The probe step involves 𝑂(𝑚𝜇𝑖 𝑙𝑜𝑔𝑁 ) operations while explore requires 𝑂(𝑚(𝑙𝑜𝑔𝑘 + 𝑁 )) operations. In practice, values of 𝑁 are typically 30 or smaller. Also, 𝑙𝑜𝑔𝑘 does not typically exceed 5, the main reason being we don’t want to overwhelm users with too many recommendations5 . Existence of a 𝜇𝑖 factor in the probe cost suggests that the probe component in the cost of Algorithm Naive-1 dominates the explore cost. To put this in perspective, for instance, in the MovieLens dataset6 with 1 Million ratings the average value of 𝜇𝑖 is around 165. Also in Netflix dataset with 100𝑀 ratings and 500𝑘 users, the average number of ratings per user is 200.
3.2
Algorithm Naive-2
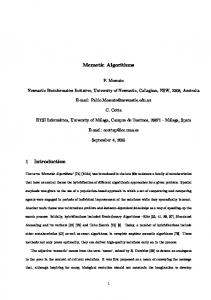
We define a data structure, 𝐿, besides similarity matrix which is a collection of sorted lists, one for each item. A schematic of 𝐿 is illustrated in Fig. 2 where every column corresponds to a sorted list. Denote by 𝐿𝑖 ∈ 𝐿 the list associated with item 𝑣𝑖 . Elements of 𝐿𝑖 are pairs of the form (𝑖𝑡𝑒𝑚 𝑝𝑜𝑖𝑛𝑡𝑒𝑟, 𝑠𝑖𝑚𝑖𝑙𝑎𝑟𝑖𝑡𝑦) and lists are sorted in nonincreasing similarity w.r.t. 𝑣𝑖 ; 𝑖𝑡𝑒𝑚 𝑝𝑜𝑖𝑛𝑡𝑒𝑟 is a pointer to the actual memory location where item resides or simply the item id. Pointers are used to have a unified representation of items between the ratings matrix 𝑅 and the similarity lists 𝐿. We use 𝐿𝑖𝑗 to denote the 𝑗 𝑡ℎ entry of list 𝐿𝑖 . 𝐿𝑖𝑗 .𝑠𝑖𝑚𝑖𝑙𝑎𝑟𝑖𝑡𝑦 denotes the similarity of 𝑗 𝑡ℎ most similar item to 𝑣𝑖 . Each of the sorted lists in 𝐿 is maintained as a priority queue to facilitate efficient updates as item similarities change over time. It is worth noting that 𝐿 is a global data structure, stored once for all users. The fact that Fig. 2 separates columns corresponding to rated and candidate items is only for simplicity of presentation. In implementation, this reordering is not required since we maintain the list of items rated by the user. Algorithm Naive-2 works as follows: 1. Mark all 𝜇𝑖 items rated by 𝑢𝑖 which takes time 𝑂(𝜇𝑖 ). 2. For every candidate item 𝑣𝑗 , read 𝐿𝑗 from the head of the list until 𝑁 marked items are found. 3. Calculate the aggregate scores and find 𝑘 items with highest scores in time 𝑂(𝑚𝑙𝑜𝑔𝑘). There is a total of 𝑚 items out of which 𝜇𝑖 are marked. Thus, a randomly chosen item has equal probability of being at any position of the list. Therefore, we can assume 𝜇𝑖 marked items divide the list into 𝜇𝑖 + 1 buckets. The expected number of unmarked items in each bucket is (𝑚 − 5 Netflix (www.netflix.com) recommends a list of 25 items to users 6 http://movielens.umn.edu
𝜇𝑖 )/(𝜇𝑖 + 1) and the expected number of items to visit un𝑖) til 𝑁 marked items are observed is 𝑁 + 𝑁 × (𝑚−𝜇 or (𝜇𝑖 +1) 𝑂(𝑁 𝑚/𝜇𝑖 ) which makes the expected running time of algorithm 𝑂(𝑚𝑁 (𝑚/𝜇𝑖 ) + 𝑚𝑙𝑜𝑔𝑘). It is easy to verify Algorithm Naive-2 is expected √ to be more efficient than Algorithm Naive-1 when 𝜇𝑖 > 𝑁 𝑚/𝑙𝑜𝑔𝑁 . Combining the two algorithms, using √ Naive-1 when 𝜇𝑖 ≤ √ 𝑁 𝑚/𝑙𝑜𝑔𝑁 and Naive-2 when 𝜇𝑖 > 𝑁 𝑚/𝑙𝑜𝑔𝑁 , results in a procedure with expected running time 𝑂(𝑚𝑙𝑜𝑔𝑘+ 𝑚 × min(𝜇𝑖 𝑙𝑜𝑔𝑁, 𝑁 𝑚/𝜇𝑖 )). We call this Algorithm Hybrid. A point worth √ making is that the theoretical “switchover” value of 𝜇𝑖 > 𝑁 𝑚/𝑙𝑜𝑔𝑁 was obtained based on the worst case cost of Naive-1 and expected cost of Naive-2. In practice, performance of Naive-1 can be better than its worst case. In our experiments, we empirically explore the best switchover value on the Netflix data set.
4.
CLASSIC TOP-𝐾 ALGORITHMS
Since TA/NRA style algorithms rely on the aggregation function being monotone, a straightforward approach for leveraging those algorithms is to turn the problem into one where the aggregate function is monotone. In Eq. 1, define the contribution of item 𝑣𝑥 rated∑ by user 𝑢𝑖 to the predicted rating of item 𝑣𝑗 as 𝑒𝑥𝑗 = 𝑠𝑥𝑗 𝑟𝑖𝑥 / 𝑣𝑦 ∈N(𝑣𝑗 ,𝑢𝑖 ) 𝑠𝑦𝑗 . It is easy ∑ ⌢ to see the predicted rating is 𝑟 𝑖𝑗 = 𝑣𝑥 ∈N(𝑣𝑗 ,𝑢𝑖 ) 𝑒𝑥𝑗 . The TA/NRA family of algorithms can now be applied since sum is a monotone aggregation function. However, in order to realize this, we need to maintain 𝑁 lists storing similarities of each candidate item 𝑣𝑗 to each of its 𝑁 nearest neighbors that are rated by 𝑢𝑖 , for each user 𝑢𝑖 . This requires finding the 𝑁 most similar items for every candidate item that are rated by each user and it requires an 𝑂(𝑛𝑚𝑁 ) storage, which is prohibitive. Besides storage, it requires keeping the list of 𝑁 nearest neighbors of every item up to date for every user which is also computationally expensive. In practice, we only need to find top-𝑘 recommendations for every user when they enter the system.
Items rated by u_i
Candidate items
L_11
L_1
L_mm L_m
Figure 2: Schematic of data structure 𝐿 storing item-wise similarities in non-increasing order. We assume active user 𝑢𝑖 has rated first 𝜇𝑖 items. In this paper, we seek efficient top-𝑘 algorithms with efficient storage requirements. More specifically, the minimum storage requirement is the ratings matrix and the materialized pairwise item similarities. Since we do not want to store this information on a per user basis, we need to materialize
all pairwise similarities in general. A data structure consisting of lists corresponding to every item, storing similarities to other items in non-increasing order, is an efficient implementation of the similarity information and we will assume the top-𝑘 algorithms have access to this information. This data structure, called 𝐿, is schematically depicted in Fig. 2 where we assume active user 𝑢𝑖 has rated the first 𝜇𝑖 items. We discuss two different possible realizations of TA/NRA style algorithms using the above idea and show there are instances where adaptations of TA/NRA algorithms will access all the entries accessed by one of the naive algorithms discussed earlier. This will set the stage for developing more efficient algorithms. More specifically, we consider algorithms that access entries in columns of 𝐿 in sorted similarity order. Once they read a similarity value between a candidate item and one of the 𝜇𝑖 items rated by the user, they wait until they can decide whether the rated item is among the 𝑁 nearest neighbors of candidate item or not.7 After finding a new neighbor for a candidate item, they update the necessary upper and lower bounds. Finally they terminate once the lower bound on the score of top-𝑘 items becomes no less than the upper bound on the score of partially observed objects. In the rest, we call such algorithms ”classic algorithms”. We consider two types of classic algorithms: (i) those which access columns of 𝐿 corresponding to items rated by 𝑢𝑖 in sorted order; (ii) those which access columns of 𝐿 corresponding to candidate items. We make no assumptions about the order on which lists are chosen for probing and the depth until which each of them is probed. We prove in both cases for any classic algorithm as mentioned above, there exists an instance on which the algorithm will access as many instances as one of the naive algorithms. THEOREM 1. Let CA be any classic algorithm that reads similarity values from those columns of 𝐿 that correspond to items rated by 𝑢𝑖 . There is an instance on which CA will access as many entries as Algorithm Naive-1. Proof. Consider an instance where there are 𝑁 items rated 𝐶 (maximum score) by user 𝑢𝑖 . Call them (𝑢𝑖 ’s) favorite items. Assume there is at least one item among the top-𝑘 whose aggregate score is less than 𝐶. Let 𝑆𝑚𝑖𝑛 = 𝑚𝑖𝑛({𝐿𝑗𝑚 .𝑠𝑖𝑚𝑖𝑙𝑎𝑟𝑖𝑡𝑦∣𝑣𝑗 ∈ 𝑢𝑖 }) which is the minimum similarity value in the bottom row of 𝐿, among columns corresponding to items rated by 𝑢𝑖 . Choose 𝑆1 and 𝑆2 such that 𝑆2 < 𝑆1 < 𝑆𝑚𝑖𝑛 . Add a new candidate item to 𝐿, 𝑣𝑛𝑒𝑤 , such that the last entry of every list corresponds to 𝑣𝑛𝑒𝑤 . Set similarities of 𝑣𝑛𝑒𝑤 with the 𝑁 favorite items to 𝑆1 , and with the rest of items to 𝑆2 . We will show any classic algorithm needs to access all of the entries of the 𝜇𝑖 columns in order to find the top-(𝑘 + 1) items. Any classic algorithm will access entries in the 𝜇𝑖 columns in sorted order. Finding the top-(𝑘 + 1) items is not possible unless all the 𝑁 nearest neighbors of 𝑣𝑛𝑒𝑤 are found. This is because: (i) 𝑣𝑛𝑒𝑤 is among the top-(𝑘 + 1) items, since its aggregated score is 𝐶; (ii) The lower bound on the score of the top-(𝑘 + 1) items remains less than the upper bound on the the score of partially observed items until all the 𝑁 nearest neighbors of 𝑣𝑛𝑒𝑤 are seen. This is because there is at least one item among the top-(𝑘 + 1), whose score is less than maximum possible score 𝐶. 7
In some situations decision can be made immediately
Finding all of the 𝑁 nearest neighbors of 𝑣𝑛𝑒𝑤 requires reading all of the entries at the bottom of the 𝜇𝑖 lists. This is due to the fact that the maximum similarity of 𝑣𝑛𝑒𝑤 to items rated by 𝑢𝑖 is less than 𝑆𝑚𝑖𝑛 . Therefore, CA can’t use other similarity values in order to find 𝑁 nearest neighbors of 𝑣𝑛𝑒𝑤 . But then reading all of the similarities between 𝑣𝑛𝑒𝑤 and the 𝜇𝑖 items rated by the user forces CA to read all of the entries in all the 𝜇𝑖 lists since it reads entries of 𝐿 in sorted order. THEOREM 2. Let CA be any classic algorithm that reads similarity values from those columns of 𝐿 that correspond to candidate items. There is an instance on which CA will access as many entries as Algorithm Naive-2. Proof. Consider an instance where there are no items rated 𝐶 (maximum score) by user 𝑢𝑖 . Assume the instance is such that there are no two candidate items whose 𝑁 nearest neighbors are exactly the same. Consider the sequence of similarity values accessed by CA and let’s call it 𝑆𝑒𝑞𝑠 . Notice that the order in which similarity values appear in 𝑆𝑒𝑞𝑠 does not depend on ratings of 𝑢𝑖 since these are similarities w.r.t. candidate items (not rated by 𝑢𝑖 ). It only depends on the order in which candidate lists are probed and until which depth. Also note that no list will be probed beyond the point where the 𝑁 𝑡ℎ most similar item is observed. CA will terminate at some point when the lower bound on the score of top-𝑘 items becomes no less than the upper bound on the score of partially observed objects. Assume this termination criterion is removed from the algorithm and 𝑆𝑒𝑞𝑠 is continued until the last 𝑁 𝑡ℎ nearest neighbor is observed. Call the item whose 𝑁 𝑡ℎ nearest neighbor is observed last 𝑣𝑙𝑎𝑠𝑡 . We create a new instance by changing ratings of 𝑢𝑖 on 𝑁 nearest neighbors of 𝑣𝑙𝑎𝑠𝑡 to 𝐶. Obviously, 𝑣𝑙𝑎𝑠𝑡 will be the top item in the new instance. Now, the upper bound on the score of partially observed items will remain greater than the lower bound on the score of top-𝑘 items, unless the 𝑁 nearest neighbors of 𝑣𝑙𝑎𝑠𝑡 (and thus of all items) are accessed. Therefore any classic algorithm will access as many entries of 𝐿 as Algorithm Naive-2. The above two theorems highlight the fact that in theory the performance of classic algorithms can be as bad as the two naive algorithms in terms of the number of entries of 𝐿 they access. It is worth noting however that an efficient implementation of the classic algorithms needs to maintain the lower and upper bounds, which requires careful bookkeeping and may lead to additional storage and computational cost. Besides, getting good lower and upper bounds with non-monotone aggregate functions is an additional challenge. Motivated by these issues, we propose an alternative two-phase approach to the top-𝑘 recommendations problem based on the operations probe and explore. The details are described in the following section. As a preview, we will show (Sec. 5.2) that for various choices of values for the parameters 𝜇𝑖 and 𝑁 , the expected cost of our twophase algorithm in terms of entries accessed rarely exceeds that of the two naive algorithms and is most of the time much less. A point worth noting is unlike our two-phase algorithm, the performance of classic algorithms cannot be predicted based on the values of these parameters alone, since for any choice, we can always find an instance where the classic algorithms access as many entries as one or the other naive algorithm.
5.
A TWO-PHASE ALGORITHM
Recall, between the steps probe and explore (Sec. 3), probe is much more expensive. To facilitate efficient implementation of probe, in this section, we describe a two-phase process which is the basis for our efficient top-𝑘 algorithm.
5.1
Two-Phase Algorithm
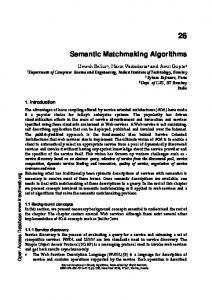
We start with the data structure 𝐿 described in Sec. 3 and extend it by adding a third element to every entry. We call the new data structure 𝐿𝑃 . Specifically, in 𝐿𝑃 , an entry 𝐿𝑃𝑖𝑗 is a triple where 𝐿𝑃𝑖𝑗 .𝑖𝑡𝑒𝑚 𝑝𝑜𝑖𝑛𝑡𝑒𝑟 and 𝐿𝑃𝑖𝑗 .𝑠𝑖𝑚𝑖𝑙𝑎𝑟𝑖𝑡𝑦 are the same as the corresponding elements in 𝐿. The third element 𝐿𝑃𝑖𝑗 .𝑝𝑟𝑜𝑏, represents the probability that any other similarity value in 𝐿𝑃 is larger than 𝐿𝑃𝑖𝑗 .𝑠𝑖𝑚𝑖𝑙𝑎𝑟𝑖𝑡𝑦. Although all of the similarities are available in the similarity matrix, reading all of the relevant similarities is costly. We use these probabilities to make probabilistic decisions during execution. Making such decisions, we seek to avoid accessing all similarity values for rated items (unlike Algorithm Naive1) or accessing all similarity values of candidate items until, for each of them, the 𝑁 nearest neighbors are found (unlike Algorithm Naive-2). So we first read only values that have a high probability of being among the 𝑁 most similar items of the candidate items. We do this by finding a threshold and filtering all entries with prob values above it. Then, we search for 𝑁 nearest neighbors of candidate items among the surviving values. It is possible that for some items we have missed some or all of the nearest neighbors. In such cases, we probe for the remaining neighbors only for those items. Obviously, choosing the right threshold value is of great importance. We do this through cost based optimization. 𝐿𝑃𝑖𝑗 .𝑝𝑟𝑜𝑏 values are estimated through modeling of similarity matrix with an appropriate distribution, the details of which we will explain later. As we will show later, when we model similarity matrix with a distribution, there is no need to materialize prob values. Instead, the probability threshold can be directly translated into a similarity threshold. For simplicity of presentation, here let us assume these probabilities are given. Notice that elements of 𝐿𝑃 that contain higher similarity values, have lower 𝑝𝑟𝑜𝑏 values. Therefore, keeping columns of 𝐿𝑃 sorted in non-increasing order of similarities is identical to keeping them sorted in non-decreasing order of 𝑝𝑟𝑜𝑏 values. Fig. 3 illustrates the two-phase process as well as naive algorithms for an active user (𝑢𝑖 ), who has rated 3 out of 7 items. In Fig. 3, on the left side of the top row, the three columns of 𝐿𝑃 corresponding to items rated by 𝑢𝑖 are shown and all entries with 𝑝𝑟𝑜𝑏 values below an example threshold value of 𝜃 = 0.19 are highlighted. On the right side, inverted lists of candidate items are shown. These lists contain only the surviving similarity values. Assuming 𝑁 = 2, we are done with finding neighbors of 𝑣4 and 𝑣7 . We have found the nearest neighbor of 𝑣5 as well and only need to find the second nearest neighbor among the remaining items rated by 𝑢𝑖 (i.e., 𝑣1 and 𝑣2 ). This reduces the execution time for three out of four candidate items compared to Algorithm Naive-1, which needs to search for the nearest neighbors of all items among all 𝜇𝑖 items rated by 𝑢𝑖 (see Fig. 3, bottom right). However, note that the two-phase approach still needs to pay the cost of reading some irrelevant similarity values such as 𝑠13 . In addition, finding the remaining neighbors of 𝑣5 requires at least a scan of the 𝜇𝑖 items rated by the user. All of this underscores the importance of choosing the right
Two Phase Algorithm Columns of LP corresponding to items rated by ui
v1
v2
(v , s = 0.9, p = 0.05) (v , s = 0.85, p = 0.08) (v , s = 0.82, p = 0.11) (v , s = 0.73, p = 0.18) (v , s = 0.3, p = 0.49) (v s = 0.1, p = 0.6)
v3
(v , s = 0.95, p = 0.03) (v , s = 0.79, p = 0.12) (v , s = 0.75, p = 0.15) (v , s = 0.71, p = 0.2) (v , s = 0.19, p = 0.54) (v , s = 0.05, p = 0.91)
3
4
7
6
4
7
6
1
5
5
2,
3
(v , s = 0.98, p = 0.02) (v , s = 0.91, p = 0.04) (v , s = 0.88, p = 0.07) (v , s = 0.77, p = 0.14) (v , s = 0.32, p = 0.48) (v , s = 0.1, p = 0.88) 2 5 6
(v , s = 0.82) , (v , s = 0.95)
V4 V5 V6 V7
1
2
(v , s = 0.91) 3
(v , s = 0.73) , (v , s = 0.79) , (v , s = 0.88) 1
2
3
(v , s = 0.85) , (v , s = 0.75) 1
2
1
u = {v , v , v }, candidate items = {v , v , v , v }
7
ϴ = 0.19
4
i
1
2
3
4
5
6
7
Remaining similarities after filtering entries using probability threshold ϴ = 0.19 (prob values are
dropped)
Naïve Algorithms Naive2 Algorithm
Naive1 Algorithm
Columns of L corresponding to candidate items V (v , s = 0.99) X (v , s = 0.95) X (v , s = 0.82) (v , s = 0.80) (v , s = 0.78) X (v , s = 0.1) 4
5
2 1
6
7
3
V (v , s = 0.99) X (v , s = 0.91) (v , s = 0.77) (v , s = 0.65) X (v , s = 0.3) X (v , s = 0.19) 5
4
3
6 7
1 2
V (v , s = 0.95) X (v , s = 0.88) (v , s = 0.80) X (v , s = 0.79) (v , s = 0.77) X(v , s = 0.73) 6
7
3
4
2
5
1
V (v , s = 0.95) X (v , s = 0.85) (v , s = 0.78) X (v , s = 0.75) (v , s = 0.65) X (v , s = 0.32)
(v , s = 0.82) , (v , s = 0.95), (v , s = 0.1)
V4 V5 V6 V7
7
6
1
4
2
1
2
3
(v , s = 0.3) , (v , s = 0.19), (v , s = 0.91) 1
2
3
(v , s = 0.73) , (v , s = 0.79), (v , s = 0.88) 1
2
3
(v , s = 0.85) , (v , s = 0.75), (v , s = 0.32) 1
2
3
u = {v , v , v }, candidate items = {v , v , v , v }
5
i
1
2
3
4
5
6
7
3
Figure 3: An example of running the two phase probe step using a prob threshold of 𝜃 = 0.19 and comparing it to naive algorithms threshold for purpose of pruning. Fig. 3 (bottom left) also illustrates how Algorithm Naive2 works. In this specific example, almost half of the items are rated and the scenario is in favor of this algorithm.8 However, the two-phase process accesses only 11 entries as opposed to 16 by Naive-2 and 12 by Naive-1. Our purpose in this example is just to illustrate how the two-phase process works and the need for cost-based optimization in choosing the probabilistic threshold. Toward the end of Sec. 5.2, we compare the expected cost of the two-phase algorithm with the cost of Algorithms Naive-1 and Naive-2. Following the two phases of probe, the explore step is applied in order to find the top-𝑘 items. In order to compare the two phase process to classic top-𝑘 algorithms, in Fig. 3, assume 𝑣5 is one of the top-k items. Also assume 𝑢𝑖 has provided the maximum rating (𝐶) to both of the nearest neighbors of 𝑣5 . In this case, the upper bound on the score of partially observed items (in the sense of the classic top-𝑘 algorithms) won’t drop until we have found both of the nearest neighbors of 𝑣5 . Furthermore, we need to make sure there is no other similarity value between 𝑣5 and other items rated by the user which are larger than the ones we have read. It is easy to verify that doing so either requires reading 5 more entries or it requires reading 3 more entries and performing rigorous book keeping to keep track of under which lists we have observed every item, an
expensive step in itself. In the worst case, this could be as bad as reading all entries which is even worse than Algorithm Naive-1 because of the additional bookkeeping required.
5.2
Choosing Threshold Prob Value 𝜃 We already illustrated with an example how given a threshold on 𝑝𝑟𝑜𝑏 values, the probe step is performed in two phases. We choose this threshold value in such a way as to minimize an upper bound on the expected overall cost of the algorithm. In this section we introduce the necessary functions that serve as components of the cost function. DEFINITION 1. Let 𝑣 be an item in a user’s profile, 𝑣𝑐 be a candidate item, 𝑠 be the similarity of 𝑣 w.r.t. 𝑣𝑐 , and 𝑝 be the corresponding 𝑝𝑟𝑜𝑏 value. We use 𝑄(𝑝) to denote the probability that 𝑣 is among the 𝑁 nearest neighbors of 𝑣𝑐 . Assume 𝜇𝑖 is the number of items rated by user 𝑢𝑖 . Let 𝑣𝑗 be one of the items rated by 𝑢𝑖 and let 𝑣𝑐 be a candidate item (and thus unrated by 𝑢𝑖 ) with similarity 𝑠 to item 𝑣𝑗 . Let 𝑝 be the corresponding 𝑝𝑟𝑜𝑏 value, i.e., the probability that any other given similarity value in 𝐿𝑃 is larger than 𝑠. We define a Bernoulli random variable 𝑋ℓ , where 𝑋ℓ = 1 if 𝑣𝑗 is the ℓ𝑡ℎ most similar item to 𝑣𝑐 among items rated by 𝑢𝑖 and 𝑋ℓ = 0 otherwise. We have: ( 𝑃 (𝑋ℓ = 1) =
𝜇𝑖 − 1 ℓ−1
) 𝑝ℓ−1 (1 − 𝑝)𝜇𝑖 −ℓ
(2)
8
In practice, e.g., in Netflix, the number of items rated by a user on an average is a small fraction of the number of all items, which makes Algorithm Naive-2 perform even worse.
In Equation 2, 𝑃 (𝑋ℓ = 1) is equivalent to ℓ − 1 successful trials out of 𝜇𝑖 − 1 where 𝑝 is the probability of success,
i.e., that some other similarity value in 𝐿𝑃 is higher than 𝑠. Now let’s define another random variable, 𝑌 , which takes on value 1 if 𝑣𝑗 is one of the 𝑁 nearest neighbors of 𝑣𝑐 among items rated by 𝑢𝑖 and 0 otherwise. Equation 3 defines 𝑄(𝑝) in terms of 𝑌 : 𝑄(𝑝) = 𝑃 (𝑌 = 1) 𝑁 ∑ = 𝑃 (𝑋ℓ = 1) ℓ=1 ( ) 𝑁∑ −1 𝜇𝑖 − 1 𝑝ℓ (1 − 𝑝)𝜇−ℓ−1 = ℓ ℓ=0
number of items for which the probe step needs to be done from scratch is 𝑄(𝜃𝑎 )𝑚𝜇𝑖 .10 We also know that 𝑚𝜇𝑖 𝜃𝑎 is an upper bound on the number of irrelevant similarity values (similarities between items rated by the user). Taking all these factors into account, an upper bound on the expected overall cost of both phases, given a threshold value 𝜃𝑎 on 𝑝𝑟𝑜𝑏 values is provided in Equation 4. 𝐶(𝜃𝑎 ) = 𝑄(𝜃𝑎 )𝑚𝜇𝑖 2 log(𝑁 ) +(𝑚 − 𝑄(𝜃𝑎 )𝑚𝜇𝑖 ) log(𝑁 )𝜇𝑖 𝜃𝑎
(3)
(4)
+𝑚𝜇𝑖 𝜃𝑎 𝑚𝜇𝑖 ×
DEFINITION 2. For a given user 𝑢𝑖 , define the core set of 𝑢𝑖 to consist of all of the similarity entries that contribute to the scores of all candidate items, i.e., similarity values between all candidate items and their 𝑁 nearest neighbors in 𝑢𝑖 ’s profile.9 Assuming there are 𝑚 items and 𝑚 >> 𝜇𝑖 for any given 𝑢𝑖 , there are 𝑂(𝑚) candidate items. Thus the core set consists of 𝑂(𝑁 𝑚) similarity values. For any given entry 𝑙 of 𝐿𝑃 , 𝑃 (𝑙.𝑠𝑖𝑚𝑖𝑙𝑎𝑟𝑖𝑡𝑦 ∈ 𝐶𝑜𝑟𝑒) = 𝑄(𝑙.𝑝𝑟𝑜𝑏). This means in order for a similarity value to be in the core set, it has to be among the 𝑁 nearest neighbors of the candidate item corresponding to 𝑙.𝑖𝑡𝑒𝑚 𝑝𝑜𝑖𝑛𝑡𝑒𝑟. DEFINITION 3. We use 𝑆𝜃 to denote the set of surviving similarity values in phase 1, after filtering out all entries from 𝐿𝑃 whose 𝑝𝑟𝑜𝑏 values are no less than the threshold value 𝜃, as described earlier and illustrated with Fig. 3. Notice, 𝐶𝑜𝑟𝑒 − 𝑆𝜃𝑎 is the set of all similarity values in the core set that are not obtained in phase 1 and hence would need to be processed in the second phase. We have the following result, establishing an upper bound on the expected size of this set. PROPOSITION 1. For any threshold value 𝜃𝑎 , 𝑄(𝜃𝑎 )𝑚𝜇𝑖 is an upper bound on the expected size of ∣𝐶𝑜𝑟𝑒 − 𝑆𝜃𝑎 ∣. Proof. Let 𝐴 = {𝐿𝑃𝑗𝜅 ∣ 𝐿𝑃𝑗𝜅 .𝑝𝑟𝑜𝑏 > 𝜃𝑎 and 𝑣𝑗 ∈ 𝑢𝑖 }. Notice, ∀𝑙 ∈ 𝐴, 𝑄(𝑙.𝑝) < 𝑄(𝜃𝑎 ). We already know 𝑃 (𝑙.𝑠 ∈ 𝐶𝑜𝑟𝑒) = 𝑄(𝑙.𝑝). → 𝐸(∣𝐴 ∩ 𝐶𝑜𝑟𝑒∣) = ∣𝐴∣ × 𝑄(𝑙.𝑝) → 𝐸(∣𝐴∩𝐶𝑜𝑟𝑒∣) < 𝑄(𝜃𝑎 )𝑚𝜇𝑖 . Since ∣𝐴∩𝐶𝑜𝑟𝑒∣ = ∣𝐶𝑜𝑟𝑒− 𝑆𝜃𝑎 ∣, the proof is complete. Given a threshold value 𝜃𝑎 , in the first phase all entries with 𝑝𝑟𝑜𝑏 value below 𝜃𝑎 are read resulting in an expected number of at most 𝑚𝜇𝑖 𝜃𝑎 values that are carried forward to the next phase. This is due to the fact that the expected number of entries with pointers to candidate item 𝑣𝑐 , are 𝜇𝑖 𝜃𝑎 and there are at most 𝑚 candidate items. Finding 𝑁 highest values in list of length 𝜇𝑖 𝜃𝑎 results in the expected cost of 𝜇𝑖 𝑙𝑜𝑔(𝑁 )𝜃𝑎 for a single candidate item. We know the expected number of missing entries from 𝐶𝑜𝑟𝑒 in 𝑆𝜃𝑎 is at most 𝑄(𝜃𝑎 )𝑚𝜇𝑖 . Here, we consider a worst case scenario. Let’s assume all of the missing entries belong to different items. Also assume for all of these items we perform the task of finding 𝑁 nearest neighbors from scratch on a list of 𝜇𝑖 items. Therefore, an upper bound on the expected 9
Note, two different pairs of items having the same exact similarity value, are counted as two different member entries of the core set.
= 𝑄(𝜃𝑎 )𝜇𝑖 log(𝑁 )(1 − 𝜃𝑎 ) + 𝜃𝑎 (1 + log(𝑁 ))
Since the variable of the function is 𝜃𝑎 , we drop the 𝑚𝜇𝑖 which is factored out in the rest. The optimal value of threshold (𝜃) given the cost function can be found as follows: 𝜃 = arg min(𝐶(𝜃𝑎 ))
(5)
𝜃𝑎
As can be seen in Equation 4, there are two competing components. On one hand, the expected number of missing entries from 𝐶𝑜𝑟𝑒 set decreases if we use a larger threshold. On the other hand, using a large threshold results in a weak pruning in the first phase and it won’t be effective enough to improve the efficiency of the second phase. Finding optimal threshold value requires optimization of the cost function. We will first show the cost function in Equation 4, has only one minimum as long as 𝜇𝑖 ≥ 2 and 𝑁 ≥ 2, and then explain how to perform the optimization. Before that, we need the following two important lemmas. For lack of space, we suppress their proof and refer the reader to [14]. LEMMA 1. The cost function 𝐶(𝜃𝑎 ) has at least one minimum as long as 0 < 𝜃𝑎 < 1, 𝜇𝑖 ≥ 2 and 𝑁 ≥ 2. In the expression for 𝐶 ′ (𝜃𝑎 ), the derivative of 𝐶(𝜃𝑎 ) w.r.t. 𝜃𝑎 , the sub-expression that depends on 𝜃𝑎 is given by: 𝐵(𝜃𝑎 ) = log(𝑁 )𝜇𝑖 [𝑄′ (𝜃𝑎 )(1 − 𝜃𝑎 ) − 𝑄(𝜃𝑎 )]
(6)
′
where 𝑄 (𝜃𝑎 ) is the derivative of 𝑄(𝜃𝑎 ). We have: LEMMA 2. The function 𝐵(𝜃𝑎 ) has only one minimum if 0 < 𝜃𝑎 < 1. We now have: THEOREM 3. The cost function 𝐶(𝜃𝑎 ) given in Equation 4 has only one minimum under the following assumptions 0 < 𝜃𝑎 < 1, 𝜇𝑖 ≥ 2, 𝑁 ≥ 2. Proof. Using Lemma 2, we know that 𝐶 ′ (𝜃𝑎 ) has only one minimum. Let’s call the value of 𝜃𝑎 at this point 𝜃𝑚𝑖𝑛 . This means 𝐶 ′ (𝜃𝑎 ) is monotonically decreasing for 0 < 𝜃𝑎 < 𝜃𝑚𝑖𝑛 and monotonically increasing for 𝜃𝑚𝑖𝑛 ≤ 𝜃𝑎 < 1. Therefore, there are at most two possible points at which 𝐶 ′ (𝜃𝑎 ) could cross the x-axis. We know 10
We consider this worst case scenario only in our optimization. Our implementation takes advantage of the partial list of neighbors already found and performs the task more efficiently.
′
lim (𝐶 (𝜃𝑎 )) = −𝜇𝑖 log(𝑁 ) + log(𝑁 ) + 1
𝜃𝑎 →0
which is negative given 𝜇𝑖 ≥ 2 and 𝑁 ≥ 2. Since the value of 𝐶 ′ (𝜃𝑎 ) is monotonically decreasing until 𝜃𝑚𝑖𝑛 , it can’t cross the x-axis in this range. Therefore, given the fact that 𝐶 ′ (𝜃𝑎 ) is monotonically increasing after 𝜃𝑚𝑖𝑛 , there could be at most one point at which it crosses the x-axis. Using Lemma 1 we know 𝐶(𝜃𝑎 ) has at least one minimum. Therefore, the function 𝐶(𝜃𝑎 ) has exactly one minimum under the given assumptions. Notice the assumptions are quite reasonable in practice. Finding the only zero of 𝐶 ′ (𝜃) in closed form is intractable since it’s a high degree polynomial. Instead, we use a numerical approach for doing this. In practice it takes only a few milliseconds to closely approximate the only zero of 𝐶 ′ (𝜃𝑎 ) using binary search. A few milliseconds are quite affordable since we found the amount of time required to provide top-𝑘 items is typically less than the delay before a web page is loaded. Using the optimal threshold value obtained from our optimization step, we compare the theoretical upper bound on expected cost of the two-phase algorithm with cost of Algorithm Naive-1 and the expected cost of Algorithm Naive-2, for different values of 𝜇𝑖 and 𝑁 . Since Naive-1 needs to process all of the 𝜇𝑖 items rated by the user, its exact cost can be calculated as described in Sec. 3.
Figure 4: Comparison of our theoretical upper bound on the cost of probe step to Naive1(𝑁 1) and Naive2(𝑁 2) algorithms for 𝑚 = 17000 and different values of 𝜇𝑖 = 50, 100, 200, 500. Y-axis represents the cost of probe step in terms of the expected number or required operations for the given parameters. Fig. 4 compares our theoretical upper bound on the expected cost of the probe step with the same cost for Algorithms Naive-1 and Naive-2. We fix 𝑚 = 17000, number of movies in the Netflix dataset. We use four different values of
𝜇𝑖 and change 𝑁 from 2 to 20. We use Equation 4 to calculate an upper bound on the expected number of operations for the two-phase algorithm. We use the cost of 𝑙𝑜𝑔(𝑁 )𝑚𝜇𝑖 for Algorithm Naive-1 and 𝑁 𝑚2 /𝜇𝑖 for Naive-2 (which are the dominant terms of their cost expressions). The average number of ratings in the Netflix dataset for a user is around 200. Fig. 4 shows for even very small values of 𝜇𝑖 , the two-phase algorithm works slightly better than Naive-1 while Naive-2 has the worst performance. The performance of Naive-1 gets worse for larger 𝜇𝑖 and the two-phase algorithm performs much better than Naive-1. As discussed earlier, for larger values of 𝜇𝑖 , 𝑁 𝑎𝑖𝑣𝑒2 has a relatively smaller expected cost (see Fig. 4). The majority of the users in the Netflix dataset (≈ 430, 000), have less than 500 ratings each and more than half (≈ 270, 000) have between 50 and 500 ratings. In our experimental results, we compare all of the algorithms Naive-1, Naive-2, Hybrid and, the two-phase algorithm.
5.3
Estimating 𝑝𝑟𝑜𝑏 values
We described our two-phase process using an extension 𝐿𝑃 of the data structure 𝐿 by adding the so-called 𝑝𝑟𝑜𝑏 values. Corresponding to every similarity value 𝑠, there is a 𝑝𝑟𝑜𝑏 value 𝑝 which is an estimate of the probability of any other similarity value in 𝐿𝑃 being greater than 𝑠. In practice, since a descending ordering of entries in columns of 𝐿 by similarity is equivalent to an ascending ordering of entries by 𝑝𝑟𝑜𝑏 values, there is no reason to store the 𝑝𝑟𝑜𝑏 values, and we can just use the data structure 𝐿. Alternatively, the threshold 𝜃 on 𝑝𝑟𝑜𝑏 values could be converted to a similarity threshold. We estimate 𝑝𝑟𝑜𝑏 values through fitting a probability distribution to all existing similarity values in 𝐿. Therefore, given the probability distribution and a similarity value, the corresponding 𝑝𝑟𝑜𝑏 value can be easily computed. We consider three different distributions – uniform, Gaussian and Gamma. In the case of Gamma distribution since input values must be positive, we add a constant integer to all similarity values in order to make sure they are all positive.11 However, in the final weighted sum, we use the original values. Since these are all parametric distributions, we can use similarity values and maximum likelihood estimation (MLE) to find optimal parameters. In the case of uniform distribution, parameter estimation is trivial. We only need to keep minimum and maximum similarity values and no MLE is required. Since the ratings data keeps changing, update is an important issue. Updating the parameters for uniform distribution with respect to the changes in data is straight forward. We just need to keep the minimum and maximum similarity values refreshed. In the case of the other two distributions, sufficient statistics need to be maintained. For instance in the case of Gaussian distribution we need to keep track of mean and standard deviation of similarity values with respect to changes. We refer the reader to [20] for details of parameter estimation through MLE for Gamma distribution. Our experiments in Sec. 6 show Gamma is the worst choice among these three for our problem. In our experiments, we compare the three distributions against each other and also compare the two-phase algorithm with other algorithms. Once we find the optimal threshold 𝜃, we can solve 𝜃 = 1 − 𝐶𝐷𝐹 (𝑠) for 𝑠 in order to find the similarity threshold. Here, 𝐶𝐷𝐹 refers to the cumulative density func11
Recall, Pearson correlation coefficient lies in [−1, 1].
tion of any of the above distributions. For lack of space, we omit the details of the methods for efficiently updating the similarity matrix when new ratings become available and refer the reader to [14] for details.
6. 6.1
EXPERIMENTS Data Set and Experimental Setup
In this section, we report the performance of our algorithm as well as the two naive algorithms with respect to several parameters. We use the Netflix dataset with 100M ratings from approximately 500K users on 17,770 movies. The rating values range from 1 to 5. All of the experiments were done on a Linux machine with 64GB of main memory and 2.93GHZ-8MB Cache CPU. All algorithms were implemented in C. As discussed earlier, we use Pearson correlation coefficient as our similarity measure. We calculate all similarities resulting in a full similarity matrix. We further normalize every row of the similarity matrix before constructing the data structure 𝐿, as follows. We first subtract the mean value of the row. Then we do a simple normalization using 𝑠 := (𝑠 − 𝑚𝑖𝑛)/(𝑚𝑎𝑥 − 𝑚𝑖𝑛), where 𝑚𝑎𝑥 and 𝑚𝑖𝑛 represent the maximum and minimum similarities in the row. We do this in order to make sure higher similarity values in some rows do not affect the whole distribution. It is important to note that this operation does not change the order of nearest neighbors in the columns of 𝐿, for this property is crucial for our two phase algorithm. Finally, we use the original similarity values rather than the normalized ones for predicting unknown scores.
6.2
Choosing the Best Distribution
Recall, 𝑝𝑟𝑜𝑏 values associated with entries in 𝐿 are not physically materialized but are meant to be inferred by fitting the existing similarities in 𝐿 to an appropriate distribution. As mentioned in Section 5.3, we use MLE to fit a probability distribution to the similarity matrix. In order to choose the best distribution, we experimented with uniform, Gaussian, and Gamma distributions. To measure their effectiveness, we randomly chose 100 users and measured the average performance of the two phase algorithm, with each of the three different distributions used for estimating the 𝑝𝑟𝑜𝑏 values. According to our empirical results, and as Fig. 5 shows, we found Gaussian distribution to be the most suitable according to its performance. Uniform distribution provided competitive results. However, we found Gamma distribution completely uncompetitive. Thus, in the rest of our experiments, we only report our results for the two-phase algorithm, based on estimating 𝑝𝑟𝑜𝑏 values using Gaussian distribution.
6.3
Algorithms Compared
Next, we ran tests to compare the two-phase algorithm with Algorithms Naive-1, Naive-2, and Hybrid. Using the same random set of users as used above for gauging the distributions’ effectiveness, we measured the average performance of all algorithms. We preferred to use a random set of users for this purpose since it has the advantage of not being limited to any value (or narrow range of values) of 𝜇𝑖 . Fig. 6 shows the relative performance of Algorithms Naive1, Hybrid, and Two-Phase, for finding the top-10 recommen-
Figure 5: Performance of the Two-phase algorithm using different distributions for estimating 𝑝𝑟𝑜𝑏𝑒 values dations (i.e., 𝑘 = 10). We found Naive-2 much slower than other algorithms on average, making its inclusion in the figure difficult. To put this in perspective, when 𝑁 = 10, while Naive-1 took about 0.08s, Naive-2 took 3.7s, or about 45 times worse. Recall, in Sec. 3, we theoretically derived the “switchover” value of 𝜇𝑖 for the Hybrid algorithm to switch from Naive-1 to Naive-2. We empirically found a different switchover value was more effective for making the performance of Hybrid more competitive. We found that if we use Naive-1 for any user who has rated less than 1500 ratings and Naive-2 for the rest, Hybrid’s performance becomes most competitive. We note that 1500 is larger than the theoretical switchover value of 𝜇𝑖 provided in Sec. 3. This is due to the fact that in many cases, the performance of Algorithm Naive-1 is better than its worst case running time. This is expected because the tentative list of top 𝑁 most similar items maintained by the algorithm does not need to get updated every time during the execution. We empirically found that Naive-2 starts getting more efficient than Naive-1 for values of 𝜇𝑖 greater than 1500. As can be seen in Fig. 6, the two phase algorithm outperforms all algorithms on average. Comparing this to Fig. 4 confirms our theoretical results that our algorithm has a better expected cost compared to naive algorithms. However, the gap between the algorithms does not too much increase with 𝑁 . We justify this by the same observation we made about hybrid algorithm earlier. An efficient implementation of the Naive-1 algorithm does not need to compare every item on the list of rated items to all of the current top 𝑁 items during execution. Therefore, Naive-1 performs better than expected in practice. Probe versus Explore: It is also worth mentioning that the execution cost shown in both of the figures corresponds only to the probe step. The cost of explore step is the same for all algorithms since all nearest neighbors are found in probe step. We found the explore step typically takes less than a millisecond in our experiments for 𝑁 = 10. This confirms the validity of our argument about probe being the dominant component of cost.
6.4
Scalability
A brief discussion of what scalability means in this context is in order. First of all, since we assume similarities are pre-
Figure 6: Average performance of Naive-1, Hybrid and the Two-phase algorithm (TPH) on a randomly selected set of users. computed, the number of users will make no difference to the running time of any of the algorithms. We found that all the algorithms discussed scale linearly w.r.t. number of items in the system, even though as already observed, the two-phase algorithm outperforms other algorithms. Thus, we decided to measure scalability of algorithms w.r.t. the average number of items rated by a user, i.e., the average size of the profile of an active user. Given the different approaches adopted by the various algorithms, we expect the average profile size to reflect their relative strengths and weaknesses as well as the tradeoff between Naive-1 and Naive-2. Thus, we chose 5 different ranges of values for 𝜇𝑖 . We randomly chose 5 users from the Netflix dataset who have rated a number of items in each of the ranges. Fig. 7, shows average performance of the algorithms for each value. We can see that for small values of 𝜇, Algorithm Naive2 is very inefficient. The two-phase algorithm outperforms Naive-1 algorithm in all cases. The gap between Naive-1 and the two-phase algorithm increases with 𝜇𝑖 . Naive-2 becomes more efficient than Naive-1 as expected for large values of 𝜇𝑖 . However, even for a considerably large value of 𝜇𝑖 such as 2000, which is significantly in favor of Naive-2, and is extremely rare in the Netflix data set, we found that the twophase algorithm performs as good as Naive-2. This confirms the scalability and reliability of the presented two-phase approach. This should be contrasted with our technical results in Section 4 showing that for any values of the parameters, the classic top-𝑘 algorithms can have an unpredictable performance, in that on some instances they access as many entries as the naive algorithms.
6.5
Figure 7: Performance of different algorithms with respect to different values of 𝜇.
Cost-based Optimization
Finally, in order to evaluate the significance of our costbased optimization, we choose 4 different ranges of values for 𝜇𝑖 . Again, in each range we found 5 users and found their top-𝑘 recommendations. We used 𝑁 = 10 and ran the two-phase algorithm with changing similarity threshold values as well as the optimal value obtained from cost-based optimization algorithm. Fig. 8 shows the running time of algorithm using different similarity threshold values. It can be seen from this figure that as argued and shown in Section 5, the running time also follows the same shape as the cost function defined in that
Figure 8: Performance of TPH with respect to different values of similarity threshold, for different values of 𝜇.
section. We can see in all cases, the curve has only one minimum. This is due to the tradeoff that exists between the two phases of the algorithm. We show the optimal threshold value resulting from our optimization approach as well. Although the number of ratings might be different for each of the users in the range, we obtain the threshold using median as 𝜇𝑖 . In some cases, obviously, choosing the right value of the threshold is of more importance. Our selected threshold values are reported in the title of each sub-figure and it can be verified that in all cases the value obtained from our method is quite close to the optimal threshold value. This can be seen best when 𝜇𝑖 ∈ [950, 1050] where choosing the right threshold is of more importance due to the shape of the curve. The optimal threshold value in this case is between 0.4 and 0.5. Our algorithm finds 0.46 as the best threshold value which actually results in a running time faster than both of the points examined here. Using 0.46 as similarity threshold in this case, the two-phase algorithm finds 𝑁 nearest neighbors of all items in 0.21(s).
7.
CONCLUSIONS
While tremendous strides have been made in recommender systems in developing and tuning algorithms with high accuracy of prediction, the issue of scalability, particularly for finding top-𝑘 recommendations for an active user, as opposed to predicting the scores of items, has received relatively less attention. This is the primary focus of this paper, where we concentrate on item-based collaborative filtering, a popular approach in recommender systems that boasts high accuracy of prediction. We show that direct adaptations to classic top-𝑘 algorithms such as the TA/NRA family leads to algorithms which either require unrealistic preprocessing and storage or end up accessing as many entries from similarity lists as certain naive algorithms on some instances, regardless of the problem parameters. We develop a novel approach based on abstracting the work required for finding top-𝑘 recommendations as two key operations – probe and explore, the former by far being the expensive one. Our approach is to use a similarity (or probabilistic) threshold that cuts down the number of entries accessed by the algorithm where the threshold is chosen in order to optimize the expected cost of the algorithm. We prove the cost function has a unique minimum which greatly facilitates the use of numerical approaches in determining the optimal threshold. We demonstrate using extensive experiments on the Netflix data set that the algorithm we propose for top-𝑘 recommendations based on item-based collaborative filtering is highly scalable and analyze its relative performance compared to other algorithms for various choices of parameters. Several problems remain open. The data in a recommender system is subject to frequent change. It is important to update the similarities as well as parameters of probability distributions. In [14], we describe some key ideas for maintaining the similarity matrix and parameters refreshed, by maintaining sufficient statistics. It would be interesting to also develop an efficient algorithm for incrementally updating the similarity values. Providing accurate approximations of top-𝑘 recommendations using even more efficient algorithms is also important for systems with heavier workloads. Finally, developing top-𝑘 algorithms for other recommender approaches such as model-based methods is an important direction for future work.
8.
REFERENCES
[1] G. Adomavicius et al. Towards the Next Generation of Recommender Systems: A Survey of the State-of-the-Art and Possible Extensions. IEEE TKDE 17(6), 2005, pp. 734-749. [2] J.S. Breese et al. Empirical Analysis of Predictive Algorithms for Collaborative Filtering. UAI 1998, pp. 43-52. [3] K. Chang et al. Minimal probing: supporting expensive predicates for top-k queries. SIGMOD 2002, pp. 346-357. [4] A. Das et al. Google news personalization: Scalable online collaborative filtering. WWW 2007, pp. 271-280. [5] M. Deshpande et al. Item-Based Top-N Recommendation Algorithms. ACM TOIS. 22(1), 2004, pp. 143-177. [6] R. Fagin et al. Optimal Aggregation Algorithms for Middleware. Journal of Computer System Sciences. Vol. 66, 2003, pp. 614-656. [7] J. A. Konstan, Introduction to recommender systems. SIGMOD 2008, pp. 1373-1374. [8] Y. Koren. Tutorial on Recent Progress in Collaborative Filtering, RecSys 2008, pp. 333-334. [9] D. Knuth. The Art of Computer Programming. Vol. 3, Fourth Edition, Addison-Wesley 2005. [10] Y. Luo et al. SPARK: Top-k Keyword Query in Relational Databases. SIGMOD 2007, pp. 115-126. [11] P. Resnick et al. GroupLens: An Open Architecture for Collaborative Filtering of Netnews. CSCW 1994, pp. 175-186. [12] B. Sarvar et al. Item-Based Collaborative Filtering Recommendation Algorithms. WWW 2001, pp. 285-295. [13] P. Symeonidis et al. Collaborative Recommender Systems: Combining Effectiveness and Efficiency. Expert Syst. Appl. 34(4), 2008, pp. 2995-3013. [14] M. Khabbaz and L.V.S. Lakshmanan. TopRecs: Top-𝑘 Algorithms for Item-based Collaborative Filtering. Tech. Report. Dept. of Computer Science, UBC September 2010. http://www.cs.ubc.ca/˜ laks/topK-techReport.pdf. [15] M. Theobald et al. Top-k Query Evaluation with Probabilistic Guarantees. VLDB 2004, pp. 648-659. [16] D. Xin et al. Progressive and Selective Merge: Computing Top-K with Ad-hoc Ranking Functions. SIGMOD 2007, pp 103-114. [17] K. Yu et al. Instance Selection Techniques for Memory-Based Collaborative Filtering. SDM 2002. [18] K. Yu et al. Probabilistic Memory-Based Collaborative Filtering. IEEE TKDE 16(1), 2004, pp. 56-69. [19] T. Wu et al. ARCube: Supporting Ranking Aggregate Quaries in Partially Materialized Data Cubes. SIGMOD 2008, pp. 79-92. [20] C. M. Bishop, Pattern Recognition and Machine Learning, Springer, 2006. [21] S. Amer-Yahia et al. Group Recommendation: Semantics and Efficiency. PVLDB 2(1), 2009, pp. 754-765. [22] G. Koutrika et al. FlexRecs: expressing and combining flexible recommendations. SIGMOD 2009, pp. 745-758.