TORCS Sensor Noise Removal and Multi-objective Track Selection for Driving Style Adaptation Mike Preuss, Jan Quadflieg, G¨unter Rudolph
Abstract—Two related problems with TORCS car racing competition controllers are approached here. At first, we demonstrate how to handle the 10% artificial sensor noise that made proper track segment recognition quite difficult for some controllers in 2010 (when the noise was introduced). This is successfully dealt with by a combination of averaging and regression. The presented solution copes well with the natural antagonism between accuracy and the produced time lag, meaning that controllers are enabled to use full sensor information despite noise. Secondly, we suggest a solution for the problem of selecting a minimal set of controller parameter configurations suitable for several different tracks by applying principles of multi-objective optimization. While a full multiobjective approach is unfeasible here, we investigate the conflict potential between objectives (in this case tracks) in order to remove the ones that are less problematic. Naturally, the second problem is much more interesting but can only be tackled if the first one is resolved.
I. I NTRODUCTION In 2010, at around the time when the sensor-based Computational Intelligence controllers for the TORCS car racing competition reached the same level as the perfect information built-in controllers, the organizers introduced additional sensor noise in order to make the setting more realistic (see also [1] for a general description of the developments achieved up to that point). This resulted in a performance loss for most available controllers, where the decrease was the larger, the more sensor information had been employed. Controllers estimating the next track segment by only using the longest of 19 directional sensors were much less effected than controllers using all sensors as they only rely on correctness of the ordinal information. However, especially the controller established by Quadflieg et al. [2], called Mr. Racer, suffered a dramatic performance decrease (see table I) due to the fact that it considers much more information and depends on some geometrical properties that are heavily distorted by the artificially added 10% relative noise. In section II, this problem is described in some more detail. In this situation, one could either chose to drop track segment prediction and thereby also the global track model and the model-based driving style optimization which is described in [3] (without noise), or find a method that reduces the noise to an acceptable level. Simple averaging is not sufficient for noise reduction as it would introduce a severe lag. A 10% noise level can be reduced to around 3% by averaging 10 subsequent values, but as new sensor information is acquired every 20ms this requires the controller All authors are with the Chair of Algorithm Engineering, Computational Intelligence Group, Dept. of Computer Science, Technische Universit¨at Dortmund, Germany. E-mail:
[email protected]
978-1-4577-0011-8/11/$26.00 ©2011 IEEE
TABLE I C OVERED DISTANCE AT FIXED TIME FOR VARIOUS CONTROLLERS WITH NOISE , IN RELATION TO THEIR NOISELESS PERFORMANCE (100%). DATA TAKEN FROM WCCI 2010 [4] AND CIG 2010 [5] RESULTS . WCCI ”Petit”
CIG ”Dirt 1”
Timothy Alford:
98.13%
134.22%
Mr. Racer:
57.55%
81.77%
Joseph Alton:
72.91%
99.99%
Jorge Mu˜noz:
82.5%
97.68%
Cobostar:
103.74%
97.00%
Cardamone:
99.52%
98.82%
Autopia:
99.99%
98.7%
to wait 200ms before taking action. Whether such a lag of 1/5 second may be acceptable, taking many more than 10 samples into account is surely prohibitive. We therefore suggest to employ a combination of averaging and polynomial regression (section III) that reduces the noise to an acceptable level and enables us to use our track-specific driving style adaptation again (section IV). However, this adaptation is costly and has to be done offline before the competition which means that a representative number of driving style configurations (controller parameter settings) need to be prepared. From a multiobjective perspective, this resembles the problem of selecting the most conflicting out of many objectives, a problem that is fairly open and for which not many approaches are known. We suggest to utilize a combination of single-objective optimization, non-dominated sorting and correlation analysis that does sufficiently well for our purposes in section V. Nevertheless, the objective selection problem is far from resolved and as it occurs in many game-related and other domains, shall be investigated further in future. II. T HE I MPACT OF N OISE ON T RACK R ECOGNITION In order to understand why the Mr. Racer controller suffered so badly from the introduction of noise, basic knowledge of our track recognition system must be provided. We keep the description short here but it may be found in more detail in [2]. In contrast to all other competitors who only use three [6], [7], [8] or up to nine [9] of the 19 sensors, our track recognition system calculates a curvature measure ρ using all available information:1 1 Mathematically, our measure does not exactly resemble a curvature value, but rather a variant which approximately employs the same ordering but is (not necessarily linearly) slightly rescaled.
337
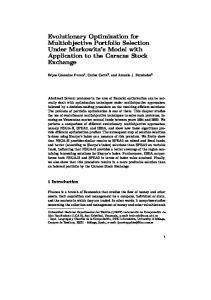
Fig. 1. Left: Screenshot of the game, right: Illustration of the computation of the sum of angles. Vectors s~i of track sensor s are colored blue, the normalised vectors l~i referring to the left side of the track outline are colored green. The purple vectors r~i (also normalised) give the right side of the track outline. Not all vectors s~i , l~i and r~i are drawn for the sake of readability.
ρ =
idx l −1 X i=0
180◦ [arccos(~li · ~li+1 ) · · π
sgn(~li,x · ~li+1,y − ~li,y · ~li+1,x )] + 16−idx Xr 180◦ [arccos(~rj · ~rj+1 ) · · π j=0 sgn(~rj,x · ~rj+1,y − ~rj,y · ~rj+1,x )]
III. Q UADRATIC R EGRESSION N OISE H ANDLING
(1)
Figure 1 illustrates equation 1: Since the orientations of the sensors s are known, the vectors representing the left (~l, shown in green) and right (~r, shown in purple) side of the track can be reconstructed. From these, ρ is calculated by summing up the angles between consecutive vectors. For left hand corners, ρ is positive and for right hand corners, ρ is negative. On a straight, |ρ| ≈ 0◦ . Entering a corner, |ρ| increases, until it reaches its maximum at the apex. The highest value observed was |ρ| ≈ 104◦ at the apex of a hairpin corner. In order to compute the maximum speed a car should have while traversing a corner, its observed maximum ρ value is an important guideline. The Mr. Racer controller relies heavily on this measure as it is used to build a model of the racetrack during the warmup phase of the competition [2]. A visualization of such a model for the wheel2 track can be seen at the top of figure 2: Starting with the start/finish line on the left, the track is divided into several segments which represent either straights or corners, which allows the Mr. Racer controller to plan ahead for a larger distance than covered by the track sensors of the sensor model. The effort of learning this model is justified by the results: Utilizing the track model and an optimized driving behavior on basis of the ρ measure, our controller is able to outperform the best competitors from 2010 & 2009 and on some tracks even a human player [3]. With the introduction of noise however, ρ looses all information content, as can be seen in figure 3 A. The
338
noise amplifies during the calculation and breaks geometric properties we are relying on, especially the monotonicity of individual angles. As a result, on a straight where the correct value of |ρ| ≈ 0◦ , our track recognition system detects a left hand hairpin as well as a right hand hairpin and everything in between when ρ is calculated on the same data with 10% noise applied. Figure 3 B demonstrates that this cannot be cured by a simple preprocessing step like a low pass filter, in this case by averaging the last 10 sensor readings. Although this brings the noise down to about 3% in the sensor readings and an improvement can be seen for ρ calculated with the filtered data, the overall quality of the measure is still far from usable. The center image of figure 2 shows the resulting track model: With simple averaging, the track model contains twice the number of segments compared to the model generated while driving without noise. This contradicts the goal of creating an abstract description of the track which contains only the most important information as the positions of individual corners and their curvature. Even worse, a lot of corners are erroneously recognized as straights which leads to a totally inappropriate driving behaviour and ultimately to the huge performance loss documented in table I.
To properly deal with noise in the context of our track recognition system, it is necessary to find a way to compute the ρ measure from noisy sensor data. With Torcs we are in the rare situation that we can • record data without noise and • since the nature of the noise is known, add it to the recorded data ourselves. By doing so, one can easily generate training data consisting of noisy sensor data and the corresponding correct value of ρ, calculated from the data without noise. One can think of numerous approaches to employ in order to reduce the noise as some arbitrary function approximation method, e.g. artificial neural networks, genetic programming, Kriging, random forests, etc. However, following our philosophy to incorporate expert knowledge where possible, we employ a much simpler approach: Since we know that the shape of the original track outline resembles a polygon, we fit one regression polynomial of degree two to each side of the track using the regression class of Michael Thomas Flanagan’s Java Scientific Library [10]. These two polynomials are then resampled and the resulting data is used to calculate the curvature measure. More precisely, for each side we use the two dimensional coordinates ~si of the sensor readings (see figure 1) but use the y-coordinates as the domain of the regression polynomial, which can therefore be written in the unusual form x = p(y) = a0 ∗ y 2 + a1 ∗ y + a2 . Flipping the coordinate axes avoids problems on straights, where otherwise the ideal regression polynomial would collapse to a linear term with infinite gradient. Having determined the coefficients a0 , a1
2011 IEEE Conference on Computational Intelligence and Games (CIG’11)
Fig. 2. Visualization of three trackmodels for Wheel2. Green segments represent straights (|ρ| ≤ 5), the others corners. For the latter, each segment is further split in subsegments of different curvature: Yellow represents fast (5 < |ρ| ≤ 20), orange medium (20 < |ρ| ≤ 35), red slow (35 < |ρ| ≤ 60) and magenta very slow (|ρ| > 60) parts of a corner. Although the information is contained in the trackmodel, the direction of corners is not shown here. The upper trackmodel was generated using data without noise and serves as a reference. The graphic in the middle shows a trackmodel based on noisy data and simple averaging. It differs significantly from the correct trackmodel which prevents the controller from reaching its top performance. The bottom track model, which closely matches the original one, was generated from noisy data using our final noise handling method.
Fig. 3. Original measure ρ against ρ under noise as recorded for the first lap on the Wheel2 track. Plot A shows the how ρ is distorted when applying 10% noise (no correction), in plot B a simple low pass filter is employed to the noisy data before calculating the measure. Plot C depicts the relation of the correct and the noisy measure when using the final noise handling.
& a2 , we resample the resulting polygon for each sensor reading: ~si,x = p(~si,y ). If one side of the track is scanned by less than 3 sensors, no regression takes place for this side because the system of linear equations defining the coefficients of the polynomial becomes under-determined. In this rare case, the ρ measure is only calculated from the data derived from the other side of the track. But under normal circumstances the car is oriented in a way that the 19 sensor readings are evenly distributed among both sides of the track and both regression polynomials can be calculated to use all the information available. Although being a step in the right direction, quadratic regression does not work sufficiently well on its own. To further improve the result we reuse the simple low pass filter
as a preprocessing step, knowing that this would bring the noise in the sensor readings down to about 3%. Additionally, we apply another averaging step to the ρ values obtained via regression. Summarizing, our noise handling mechanism consists of these subsequent steps: 1) Preprocess the raw sensor data by averaging the last ten sensor readings. 2) Fit one regression polynomial to each side of the track using the preprocessed data. 3) Resample the two polygons to create new sensor readings. 4) Calculate the measure ρ on the new sensor readings. 5) Postprocessing by averaging the last calculated values
2011 IEEE Conference on Computational Intelligence and Games (CIG’11)
339
Fig. 4. Plots of the best solutions found for the two optimized tracks, over the steering angle (0 to full, top line) and the ρ (curvature, bottom line) measure. The 13th parameter has been evolved to 0.80 for Alpine-1 and 0.88 for Wheel2. Target speed is higher for Alpine, acceleration is less and breaking stronger damped for large steering angles. Note that we use damping in a multiplicative sense, thus 1 stands for no damping and 0 for complete disabling of acceleration/braking
of ρ. Numerical parameters as the filter width of the pre- and postprocessing are set in an ad-hoc manner here and may be further tuned to get even better results. But the derived mechanism already works good enough to allow for applying the previously developed track recognition method again. This is illustrated in the bottom graphic of figure 2, which shows a track model generated from noisy data using the final noise handling mechanism. This model closely matches the reference model generated without noise and allows the Mr. Racer controller to regain its top performance in the presence of noise. Figure 3 C shows the correlation between the correct ρ measure and ρ calculated with noisy data and noise handling. On this data set, the root mean squared error (rmse) is only 4.33 while it was 48.86(!) without noise handling and 19.64 with the naive approach of the simple low pass filter. Finally, the noise handling was successfully used as described here for the first round of the 2011 simulated car racing championship. IV. C ONTROLLER AND L EARNING The Mr. Racer controller is an indirect controller as there is no direct coupling between the sensory input and the response. Instead, a planning module derives a plan based on the current situation (speed and position of the car, presence of opponents, etc) and the information contained in the trackmodel. The result of the planning process are a target speed and position, acceleration and steering modules then calculate the necessary actions to realize the plan. Twelve numerical parameters controlling the planning process and the acceleration behaviour have been successfully learned using the CMA-ES [3]. These twelve parameters control three generalized logistic functions, of which one maps the curvature measure to target speeds and the other two map the absolute steering value to damping factors for the acceleration and brake values. See figure 4 for a visualization of the three functions.
340
For the 2011 championship, a new 13th parameter has been introduced, which controls the usage of a corner for braking. This parameter, called β here, can take real values between 0 and 1, 0 meaning that the car doesn’t brake at all within a corner and the necessary slow down will take place on the preceding straight. With a value greater than 0, the brake distance bs on the straight becomes b − β ∗ d, where b is the distanced needed to slow down and d the length of the corner entry, that is the distance between the beginning of the corner and its first apex. For more details on how the controller plans the braking zone when approaching a corner see [3]. Again, the CMA-ES was chosen as an optimizer to find a good parameter set. Assuming that the newly introduced 13th parameter would not make the problem much harder, the same settings as for the twelve dimensional parameter set were used, namely a (10, 20) strategy with a run length of 1200 fitness evaluations on the wheel2 track. For each evaluation, a candidate solution drove two laps, the time of the second lap being the fitness value that should be minimized. In first tests, the assumption that the algorithm parameters don’t need to change proved to be correct, with the best solution found being 1 second per lap quicker than the old controller. That shows that the new parameter offers an advantage in adapting the driving behaviour and that the slightly bigger search space can still be handled with the old algorithm settings. However, the resulting driving bevaviour seems to be overfitted to driving as fast as possible during the second lap of the evaluation, losing control in the third lap. Therefore, we changed the fitness function to • driving three laps • and minimizing the overall time needed for the three laps. As before, an evaluation is aborted after a certain time, in this case 9 minutes, to avoid being stuck with bad solutions for too long, or when the damage is bigger than 5000. Whenever an evaluation has is aborted, the time is scaled to the full
2011 IEEE Conference on Computational Intelligence and Games (CIG’11)
distance of three laps based on the distance covered and further multiplied by 1.5 to punish solutions that got damage. With this setup, one optimization run takes about one day on a machine that can evaluate five individuals in parallel 2 . V. M ULTI - OBJECTIVE D RIVING S TYLE S ELECTION As we can handle sensor noise now and the track recognition system works good enough for adapting the driving style to a specific track, the question remains how to deal with multiple tracks. While it may be possible to apply a multi-objective optimization (with each track providing one objective) in order to achieve a good compromise solution, this will surely be far from optimal on each separate track. The discussion in [3] hints to several factors (beside others we may have not detected until now) that make the difference for the controller on different tracks: • On formula-1 tracks, it is usually possible and sometimes profitable to leave the track by a small amount, on road tracks (e.g. Alpine) this is dangerous because one may crash into a wall. • Track surfaces can differ in friction values and other important properties, requiring a different driving style. As we strive for reaching the best achievable performance for each single track, it would be a reasonable approach to try multi-objective optimization for a small number of tracks and then select some points on the approximate Pareto front which could then be tested during the warmup phase of the competition. However, as the number of tracks supplied with the TORCS installation is already large (≈ 20) and the competition tracks are not necessarily chosen from this set, a pure multi-objective approach with all tracks is unfeasible due to computational and methodical reasons. Even worse, there is a current trend to apply interactive procedural content generation to racing tracks [11] which may make the variance even larger. Thus, we end up with the problem to select few representative tracks on which either multi-objective or single-objective optimization can be applied to generate a reasonable candidate set of driving styles. From this set, the best matching driving style can then be selected during warmup. A related approach for obtaining few representative driving styles is known from Butz & L¨onneker who used single objective optimization on a set of ten tracks to tune the parameters of their Cobostar controller [6]. Additionally, they did a full test of how each of the best solutions found for one track performs on the other tracks. Based on this information, they chose the configuration which performs best on average as the driving strategy. Additionally, Cobostar might switch to one of three different driving strategies in the second lap based on observations from the first lap, namely the average and minimum speed3 . As the optimization runs for this approach had to be performed for each track (objective), 2 Core i7 930 CPU, 24GB RAM (only ≈6GB are actually used), NVIDIA Geforce 9800GT 3 Being a 2009 controller, Cobostar cannot use the warmup phase for this adjustment, as this was introduced later for the 2010 championship
it is computationally much more demanding than the one suggested in this work. In the following, we restrict ourselves to work towards a solution for the problem of selecting representatives and defer the application of a multi-objective optimization algorithm to generate a complete set of best driving styles for all these tracks to future work. Instead, we try a simpler approach by selecting a minimal representative set of 2 tracks with respect to our current understanding of the track property influences on the driving style, optimizing on each track separately, evaluating the best obtained individuals on all 6 considered tracks, and combining the results by means of non-dominated sorting. We thus rule out all driving styles that are equal or worse than others in all target values (which is essentially also what a multi-objective algorithm would do in each step). Then we measure the correlations between the performance values obtained for the 6 tracks in order to decide if our representative set is suitable. Suitable does not mean optimal, but if we obtain a high correlation for each single track to at least one of the representative tracks, we can at least be sure that for this track set the choice of representatives was meaningful—separate single-objective optimization for all the six tracks would most likely have lead to similar solutions. Note that the problem of selecting representative objectives from a larger set is an essential but open problem for the application of population-based multi-objective methods. Few approaches have been suggested to resolve it, e.g. the one of Brockhoff and Zitzler [12] that utilizes Hassediagrams. One may also argue with the number of individuals found in the last front in relation to the population size while testing all pairwise combinations of objectives as has been done in [13]. If the resulting front has only one individual, this clearly hints to compatible objectives (no conflict), if the front is large, there must be a conflict. However, this approach has two disadvantages compared to our two-step (single-objective/correlation analysis) approach: 1) Our approach scales linearly in the number of objectives, whether the pairwise multi-objective treatment scales quadratically (we assume that evaluating the set of resulting best individuals in several objectives is much cheaper than a full multi-objective run). 2) It is difficult to find the right time to measure (length of runs) for the multi-objective approach because runs mostly start with only one or very few leading individuals and the population distributes over the front (if existing) only after reaching its vicinity. We thus regard the method suggested here as a step into the direction of automatically detecting a representative subset of objectives that surely deserves some more development in the future. In our concrete case, only 6 of the many available TORCS track are considered, namely Alpine(1), Brondehach, C-SpeedWay, CG-Speedway-1, Street-1 and Wheel2 (resembling the Suzuka formula-1 track). It would surely be interesting to apply the method for more tracks, but for avoiding early overcomplication, we stayed with the
2011 IEEE Conference on Computational Intelligence and Games (CIG’11)
341
Fig. 5. Left: Pairwise correlations of the ranks of the combined set of controller configurations, same order as on the right side, Alpine=rt1, Wheel2=rt6, darker points mean higher frequency (as we use bins); right: Kendall’s tau rank correlations of the combined set between the six tracks, upper half gives the p-values (always near 0), thus all correlations are statistically significant
Fig. 6. Left: Multi-dimensional scaling (MDS) over the 13 parameter space, the configurations stemming from optimizing on Wheel2 in red, Alpine in blue; right: MDS over the ranks on the 6 different tracks, same colors. In both cases, we obtain 2 clearly separable groups. The numbers refer to the order of occurrence of the individuals during optimization
set of tracks we usually employed for controller testing in the past iterations. As an optimization run (see section IV) takes more than one day even if parallelized, we decided to start with the smallest representative set possible, namely 2 tracks. From the experiences reported in [3] it appears that the most different tracks of the 6 named above are Alpine and Wheel2 (we assume that Wheel2 and Brondehach will behave quite similarly but have to chose one). The controller parameter (driving style) optimization is thus performed once for each of this two tracks and the best 60 individuals of each
342
run are pooled and evaluated on all other 5 tracks, resulting in a six-dimensional fitness vector for each driving style. By applying a non-dominated sorting procedure, the set of 120 individuals is shrinked down to 75 non-dominated solutions. Of course one may obtain more and possibly also different best solutions while doing more than one run, but a) [3] has shown that the optimization runs quite stably on this problem, and b) we strive for a method that minimizes computation time due to the large runtime of even one optimization run.
2011 IEEE Conference on Computational Intelligence and Games (CIG’11)
In order to assess if the chosen 2 tracks (objectives) indeed represent the remaining tracks (objectives) well we measure the correlation between all 6 fitness value sets, implicitly transformed from simple numbers into ranks by utilizing Kendall’s tau correlation to make it more independent of the different scales. A rule-of-thumb in psychology demands a strong correlation to have a value of at least |0.4|, which we adopt here. Note that this does not rule out the possibility that another choice of representatives would give even higher correlations and thus be even closer to optimal, but if we can obtain a strong correlation between every non-optimized objective to one of the two selected ones in the above sense, we deem our selection to be suitable. Note further that by means of simple correlations, we can only capture linear trends, more complex interactions may exist but cannot be revealed. For computing the correlations and additionally test if they are significant, we rely on the cor.test method in R. To get a rough impression of the pairwise rank distributions between all six objectives, these are visualized in figure 5 on the left hand side. An ideal correlation would see all points on a diagonal from lower left to upper right, an ideal anti-correlation would result in a line from upper left to lower right. We can assess that although none of the measured correlations is ideal, there is a clear trend to correlation/anti-correlation in each subplot. The correlation values themselves are visualized on the right hand side of the same figure. The upper left half of this plot shows the pvalues obtained from the correlation tests which all indicate 5%-level significance (nearly all of them are even far below 10−3 ). It is easy to see that 3 of the non-optimized tracks (Street-1, CG-Speedway-1, and Brondehach) strongly correlate to Wheel2 and thus can well be represented by it during optimization. Alpine strongly correlates to C-SpeedWay only, and anti-correlates to all other tracks. According to the task devised above, we seem to have found a good minimal set of representatives. It is clear that neither Wheel2 nor Alpine alone can represent all other tracks well. The same approach may of course be tried with a larger representative set, e.g. of three tracks, possibly by obtaining even better correlations, but at the cost of a larger computational load. As we have identified two groups of similar tracks with respect to our driving style optimization problem ({Wheel2, Street-1, CG-Speedway-1, Brondehach} vs. {Alpine, CSpeedWay}), we may be interested in learning how large the differences are in search space (13 dimensions) and target space (6 dimensions). For visualizing these two spaces, we employ a multi-dimensional scaling (MDS) over the euclidean distance matrices between all 75 individuals as depicted in figure 6. MDS resembles a dimension reduction technique that produces a mapping to a predefined lowerdimensional space (2 in our case for the ease of visibility) and is provided by the R method cmdscale. Interestingly, we find that the clusters of individuals obtained from the Wheel2 and Alpine optimization runs are mutually disjoint in both cases which provides further evidence that our track
(objective) selection is minimal as well as sufficient. But how do the solutions actually look like and how do they differ? Figure 4 provides an impression of the different driving styles obtained for Alpine and Wheel2 by picturing the best individual of either optimization run, where we find 2 important differences (the higher target speed for Alpine probably not very important as speeds of 200 km/h and more are hardly possible on this track except on the home stretch): • For Alpine, acceleration is almost not damped even for large steering angles. On Wheel2, acceleration in sharp corners is very limited. • The opposite holds true for braking. On Alpine, breaking in sharp corners is heavily constrained, where this is not the case for Wheel2. The two different obtained strategies indeed seem to make sense. For a human test player, the most striking difference between the two tracks is that Alpine has many more sharp corners with little room to accelerate between them. Furthermore, the track consists mainly of a steep ascent, a soft descent, and a home stretch. As even 4x4 cars tend to slide in corners (see [14]), it is usually helpful to accelerate as early as possible when leaving them to prevent loosing control. For the same reason, it is not advantageous to do much braking within a sharp corner on Alpine. On Wheel2, the average speed over the whole round is almost 30 km/h higher, so that the target speed curve will be much more important on this track. Instead of many short and sharp corners, this track has many straights and several corners that can be driven at full speed. The slight brake damping and strong acceleration damping applies only to extreme steering angles that will be necessary in the few sharp bends (e.g. the hairpin). By applying the configuration of figure 4, the controller is restrained from accelerating while passing these corners which may make sense as driving through a hairpin corner with almost 100 km/h puts the car in a very delicate condition. Acceleration may lead to loosing the balance of forces easily, which means leaving the track. It would be interesting to take also completely different tracks (e.g. the dirt tracks) into account, these may lead to another completely different driving style adaptation. However, we have to defer that to future investigations. VI. C ONCLUSIONS We have seen that the solutions for both tackled problems, the reduction of sensor noise and the multi-objective driving style selection, can be handled in a satisfactory manner by the methods we provided. While our noise reduction technique is relatively specific and may have to be largely changed for application to related scenarios, the single-objective/multiobjective/correlation based procedure for objective selection may be applied nearly unaltered for similar problems in a completely different setting. It thus shows some potential not only for the game AI domain but also more generally for optimization problems where the number of available objectives is too large to treat them directly by applying a multi-objective optimization method.
2011 IEEE Conference on Computational Intelligence and Games (CIG’11)
343
ACKNOWLEDGEMENTS The authors would like to thank Michael Flanagan for his Java Scientific Library. R EFERENCES [1] D. Loiacono, P. L. Lanzi, J. Togelius, E. Onieva, D. A. Pelta, M. V. Butz, T. D. L¨onneker, L. Cardamone, D. Perez, Y. Saez, M. Preuss, and J. Quadflieg, “The 2009 simulated car racing championship,” IEEE Transactions on Computational Intelligence and Games, vol. 2, no. 2, pp. 131 –147, 2010. [2] J. Quadflieg, M. Preuss, O. Kramer, and G. Rudolph, “Learning the track and planning ahead in a car racing controller,” in Computational Intelligence and Games (CIG), 2010 IEEE Symposium on, 2010, pp. 395 –402. [3] J. Quadflieg, M. Preuss, and G. Rudolph, “Driving faster than a human player,” in Applications of Evolutionary Computation, ser. Lecture Notes in Computer Science, C. Di Chio, S. Cagnoni, C. Cotta, M. Ebner, A. Ekrt, A. Esparcia-Alczar, J. Merelo, F. Neri, M. Preuss, H. Richter, J. Togelius, and G. Yannakakis, Eds., vol. 6624. Springer Berlin / Heidelberg, 2011, pp. 143–152. [Online]. Available: http://dx.doi.org/10.1007/978-3-642-20525-5 15 [4] D. Loiacono, L. Cardamone, M. Butz, and P. L. Lanzi, “Wcci-2010 results of the second leg of the simulated car racing championship 2010,” http://cig.ws.dei.polimi.it/?p=166, 2010, 2. August 2010. [Online]. Available: http://cig.ws.dei.polimi.it/?p=166 [5] ——, “Cig-2010 results of the final leg of the simulated car racing championship 2010,” http://cig.ws.dei.polimi.it/?p=170, 2010, 25. August 2010. [Online]. Available: http://cig.ws.dei.polimi.it/?p=170 [6] M. Butz and T. L¨onneker, “Optimized sensory-motor couplings plus strategy extensions for the torcs car racing challenge,” in Proceedings of the IEEE Symposium On Computational Intelligence and Games, 2009, 2009, pp. 317–324. [7] M. Ebner and T. Tiede, “Evolving driving controllers using genetic programming,” in Proceedings of the IEEE Symposium On Computational Intelligence and Games, 2009, 2009, pp. 279–286. [8] E. Onieva, D. A. Pelta, J. Alonso, V. Milan´es, and J. P´erez, “A modular parametric architecture for the torcs racing engine,” in Proceedings of the IEEE Symposium On Computational Intelligence and Games, 2009, 2009, pp. 256–262. [9] L. Cardamone, D. Loiacono, and P. L. Lanzi, “On-line neuroevolution applied to the open racing car simulator,” in Proceedings of the IEEE Congress on Evolutionary Computation, 2009., 2009, pp. 2622–2629. [10] M. T. Flanagan, “Michael thomas flanagan’s java scientific library,” http://www.ee.ucl.ac.uk/ mflanaga/java/, 2011, 30. March 2011. [Online]. Available: http://www.ee.ucl.ac.uk/ mflanaga/java/ [11] L. Cardamone, D. Loiacono, and P. L. Lanzi, “Interactive evolution for the procedural generation of tracks in a high-end racing game,” in Genetic and Evolutionary Computation Conference, GECCO 2011, Proceedings, Dublin, Ireland, July 12-16, 2011, 2011. [12] D. Brockhoff and E. Zitzler, “Objective reduction in evolutionary multiobjective optimization: Theory and applications,” Evolutionary Computation, vol. 17, pp. 135–166, 2009. [13] J. Togelius, M. Preuss, N. Beume, S. Wessing, J. Hagelb¨ack, and G. Yannakakis, “Multiobjective exploration of the starcraft map space,” in Proc. of the IEEE Symposium on Computational Intelligence and Games (CIG 2010). IEEE Press, 2010, pp. 265–272. [14] M. Kemmerling and M. Preuss, “Automatic adaptation to generated content via car setup optimization in torcs,” in Proc. of the IEEE Symposium on Computational Intelligence and Games (CIG 2010). IEEE Press, 2010.
344
2011 IEEE Conference on Computational Intelligence and Games (CIG’11)