Computing Environment (FENCE) system for high end computing. FENCE is a ..... available spare nodes to those affected jobs whose rescheduling can greatly ...
Towards a Fault-aware Computing Environment Xian-He Sun, Zhiling Lan, Yawei Li, Hui Jin, and Ziming Zheng Illinois Institute of Technology {sun,lan,liyawei,hjin6,zzheng11}@iit.edu
Abstract: In this paper, we propose and present the design and initial development of the Fault awareness Enabled Computing Environment (FENCE) system for high end computing. FENCE is a comprehensive fault management system in the sense that it consists of both post and runtime analysis, integrates both proactive and reactive mechanisms, and combines both application level and system level fault management. Component-based systems are also developed to support the comprehensive FENCE design. Preliminary implementation results are presented.
based on rigorous mathematical models to model the possibility of failures and analyze the effects of failuresfailure effects on application performance based on collected historical data. We call it post analysis. The short-term prediction dynamically analyzes health-related information (e.g., by hardware sensors or through software error checkers) and forecasts imminent and potential failures at runtime. We call it runtime analysis. The long-term analysis can identify the weak point of a computing system and provide suggestions on the optimization of system configuration. The task scheduling component supports a variety of application-level fault-aware scheduling schemes. Here, the “application-level” means that the prediction and task scheduling focus on improving application performance, and “fault-aware” means the factors of fault management, such as fault recovery (e.g. checkpointing) and fault prevention (e.g. migration) are considered in performance optimization. The dynamic decision making component automatically evaluates different fault tolerance actions and selects the best action at runtime based on shortterm fault prediction. It includes an adaptation manager to dynamically determine a best-fit action in response to short-term failure prediction by considering a number of factors, including prediction accuracy, cost and benefit of different action, and available resources. The runtime resilience support component carries the actions including selective checkpointing (i.e., the runtime support system dynamically determines whether the checkpointing request will be granted or not), process migration, and application rescheduling, to avoid or mitigate the impact of imminent/potential failures. In particular, a new concept of dynamic virtual machine (DVM) is introduced, so a virtual machine (VM) can be customized and deployed swiftly. DVM provides a feasible mean of system configuration and VM incarnation, and is a big help of process migration. A software system, named MPI Mitten is also developed
1. Introduction Checkpointing/restart mechanism is the conventional fault management approach for high end computing (HEC). It is simple and capable of mitigating the impact of failures, but it is becoming increasingly costly for high end computing. Checkpointing periodically saves snapshots of the system onto disks and, when a failure occur, all the processes, including nonfaulty processes, have to rollback to a previously saved consistent state [1]. Both of the saving and rollback costs increase with the number of processors. A new fault tolerant approach is a must for next generation high end computers. Unlike the checkpointing/restart approach, newly emerged proactive methods (e.g., process migration) do not require periodic checkpointing, thereby preventing failure experiencing and reducing the fault management cost [2, 3]. Yet proactive methods rely on accurate fault prediction, which is hardly achievable in practice. It is more than often unexpected failures occur, and false alarms are produced. Hence, proactive approach alone is unlikely sufficient to provide a reliable solution for fault management in HPC. In this paper, we propose a novel approach to build a Fault awareness ENabled Computing Environment (FENCE) system, for HEC. The design of FENCE is three fold: Increasing the accuracy of fault prediction, integrating different fault management mechanisms, and developing runtime support systems. Three key technologies are associated with the design. They are post analysis, runtime analysis, and runtime systems.
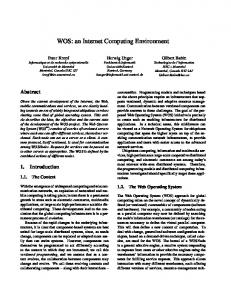
2. FENCE Design The structure of the FENCE system is shown in Figure 1. It consists of four major components, namely fault analysis and prediction, dynamic decisionmaking, runtime resilience support, and task scheduling support. The fault analysis and prediction component learns and models both long-term and short-term fault trends. The long-term prediction is
1
to support group communication and membership management during and after process migration. The combination and integration of these components makes FENCE unique and having a potential to be significantly better than existing fault management systems. Fault Analy. & Prediction Long-Term Prediction
distribution with mean
Adaptive Decision
Short-Term Prediction
Action Selection
Dynamic Adjustm
µc
and standard deviation σ c .
Here the checkpointing-recovery cost refers to the time required by the system to recover the application from the last checkpoint to the failure point. Let w denote the subtask workload, and the application’s execution is interrupted by failures S times, the completion time of the subtask can be expressed as, T = X 1 + Y1 + Z1 + X 2 + Y2 + Z 2 + ... + X s + Ys + Z s + L
Resource Selection
where X i (1 ≤ i ≤ S ) are the computing time consumed System Configration
Task Schedule
Resched.
Virtual Machine
by the application, Yi (1 ≤ i ≤ S ) are the downtime of
Adaptive Checkpoi
system failures, Z i (1 ≤ i ≤ S ) are the checkpoint-
Runtime Support
Task Scheduling Support
recover cost after failure interruption and L is the execution time of the last application process that finishes the application. Since w = X 1 + X 2 + ... + L , we get
Figure 1. Structure Overview of FENCE
3. Challenge and Current Results The FENCE design is promising. However, each component of HFT is a challenge in development. Integrating them together seamlessly is another. While the development of FENCE is an ongoing project, we have already overcome the major “key” technical hurdles and all the major components have been developed and tested. We discuss three technical hurdles in this study: better fault prediction, fault management, and system support. 3.1 Improving Prediction Accuracy The key of proactive fault management is fault prediction. The first step of our research is improving the accuracy of fault prediction. For long-term prediction, based on stochastic modeling and analysis, we have developed a set of practical and effective performance models to predict the application completion time under system failures. By assuming the entire system as an M/G/1 queuing system, we have derived the mean, variance and distribution of sequential task execution time [4]. Based on the common assumption in the reliability research that failures in a computer system are usually exponentially distributed (or the occurrence of failures is essentially random) [5, 6, 7], we assume that for one sequential task, the arrival of failures follows a Poisson distribution with λf , and the downtime of failures follows a general distribution with mean standard deviation
σf
µf
T = w + Y1 + Y 2 + ... + Y S + Z 1 + Z 2 + ... + Z s
The mean and variance of the following expression:
T can be obtained through
1 E (T ) = ( + λ f µc ) w 1− λf µ f
V (T ) = (
µ 2f + σ 2f µ f µc + µ c2 + σ c2 + 2 )λ f w . (1 − λ f µ f )3 1− λf µ f
The cumulative distribution function (CDF) of the application completion time is expressed as: −λ w −λ w e f + (1 − e f ) Pr(U ( S ) ≤ t − w | S > 0) if t ≥ w Pr(T ≤ t ) = otherwise 0,
Where
if S = 0 0, U (S ) = Y Z Y Z Y Z if S > 0 + + + ... + + , 1 2 2 S S 1 Based on [9], the Gamma distribution is an appropriate distribution to describe the Pr(U ( S ) ≤ u | S > 0) , which can be used to derived the distribution of sequential task execution time. The study of sequential task can be extended to parallel processing and workflow applications. Most scientific applications can be modeled by directed acyclic graphs (DAG) [8]. In a DAG, each node represents one sequential task and the edges represent the dependencies among the nodes. For each node in a DAG, we have three random variables to capture its performance features: start time, computation time and finish time. The computation time can be gained by our study of sequential task. Also, based on probability theory, the CDF of start time is the product of CDFs of its predecessors. The distribution of finish time is the convolution of start time and computation time. As
and
, which is a generalization on
the exponential downtime distribution used in [5, 7]. Checkpointing has been widely used for fault tolerance in HPC. Hence, we focus on modeling the performance influence of checkpointing in this study. We assume that the checkpointing/recovery cost follows a general
2
long as the finish time of each subtask is derivable, we can get the execution time of the whole parallel application. The models separate the influence of failure arrival rate, failure repair time, and checkpointing cost. The separation of factor leads a way to fault-aware system configuration. For example, given the possibility to be used as a replica or for migration, how should we utilize a computing node for best performance under failure? Based on our model, we may have different answers for different environments [4]. Also, suppose we have some spare processors for a scheduled DAG, based on the model, we can decide the weak node(s) and thus issue them replica with the spare processors. To verify the correctness of the newly proposed models, we have conducted extensive experiments and simulations. In our simulation, the mean of failure rate on each machine ranges from 1.5 × 10 −7 to 4.5 × 10 −7 per second and the mean of failure downtime ranges from 2 hours to 4 hours. These values are set based on the observation of the failure rate and repair time collected in [10]. The parameters on each machine are randomly generated within their corresponding ranges so that the failure rate and downtime on each machine are different. Figure 2 plots the mean and the standard deviation of prediction error of fully parallel application completion time under failures. The application workload on each node ranges from 16 hours to 512 hours and the system size is 100 nodes. We observe that the prediction error is relatively small, less than 10% for most of the situations. As the application workload increases, both mean and variation of the prediction error decrease, indicating our prediction models work well for large-scale applications. When the number of processors, or the system ensemble size, increases with problem size, the results are even more encouraging. Figure 3 gives the mean and the standard deviation of prediction error with different system size where machine number increases from 25 to 800, where the application workload increases with the system size, maintaining an average of 32-hour workload on each node. As we can see, the prediction error is all less than 10% for all system sizes. This shows the potential of the prediction of performance under failure for the upcoming Petaflops systems. In our simulation, we examine different failure downtime distributions (Lognormal, Exponential and Gamma). Similar results are observed. These results demonstrate the correctness of the analysis of failure models.
r o r r e n o i t c i d e r p
0.14 0.12 0.1 0.08 0.06 0.04 0.02 0
mean std 16 32 64 128 256 512 workload on each node (hours)
prediction error
Figure 2. Mean and STD of prediction error with different workloads 0.08 0.07 0.06 0.05 0.04 0.03 0.02 0.01 0
mean std 25
50 100 200 400 800 system size
Figure 3. Mean and STD of prediction error with different machine numbers Our short-term failure predictor focuses on dynamical learning and discovering of fault patterns from RAS (reliability, availability, and serviceability) logs collected during system operation for runtime failure forecasting. Failure prediction is challenging, especially in large-scale systems composed of hundreds of thousands of components. Due to the massive quantities of information collected from a large number of components, fault patterns and root causes are often buried in mass information like needles in a haystack. To address the problem, we have designed an ensemble learning based prediction mechanism [11, 14]. The basic idea of this mechanism is to integrate a number of data mining and statistical learning methods to identify a variety of fault patterns and correlations from RAS logs and use them for failure forecasting (see Figure 4). The goal is to boost prediction accuracy by combining the strengths of different predictive methods.
Figure 4. Ensemble Leaning Based Predictor We have acquired two RAS logs from the Blue Gene/L systems at ANL (Argonne National
3
Laboratory) and SDSC (San Diego Supercomputing Center) for the initial evaluation. At the time of our experiments, both systems consisted of 1024 compute nodes (2048 processors) with 32-128 I/O nodes. Considering the nature of RAS logs, we have examined two base prediction methods, namely statistical learning method and association rule based method. The statistical learning method emphasizes on discovering probabilistic characteristics (e.g., how often and with what probability will the occurrence of one failure influence subsequent failures) and then using the obtained characteristics for failure prediction. The association rule method builds association rules to capture causal correlations between non-fatal events occurring before each fatal event and then use them for failure prediction. Rules are in the form of {x1,x2,…,xk}=>y, meaning that if an occurrence of {x1, x2,…,xk} is found then there is a good chance of finding y. Our ensemble learning mechanism adaptively combines these methods as follows:
management is invoked (named FT-Pro). FT-Pro aims to enable parallel applications to avoid anticipated failures via preemptive migration, and in the case of unforeseeable failures, to tolerate them in such a way that their impact is kept to a minimum through selective checkpointing [12]. Three runtime actions are currently considered in our runtime adaptation: • SKIP, where a possible checkpoint is skipped. • CHECKPOINT, where the application takes a checkpoint. • MIGRATION, where the processes on unsafe failure-prone resource are transferred to healthy resource to avoid an upcoming failure. The major challenge facing the design of runtime adaptation is how to select a best-fit action at runtime. Toward this end, we have designed an adaptation manager. It performs runtime selection based on quantitative performance modeling of applications. More specifically, it estimates the expected application execution time Enext during the next interval and selects the action that minimizes Enext:
“Observe the events within a fixed time window before the occurrence of a failure: (1) if there exist nonfatal events, apply the rule based method for the discovery of fault patterns and produce a warning in case of matching rules; (2) if no nonfatal event is observed, examine the occurrence of fatal events and apply the statistical based method for failure prediction; (3) if both fatal and non-fatal events are presented, use the base method that produces a prediction with higher confidence.”
(1) MIGRATION: Enext = (2 I + Cr + C pm ) ⋅ f appl + ( I + C pm ) ⋅ (1 − f appl ) 1 − (1 − precision) NW − N S where f appl = NWf ≤ N Sh 0 f
(2)
h
NWf > N Sh
CHECKPOINT:
Enext = (2 I + Cr + Cckp ) ⋅ f appl + ( I + Cckp ) ⋅ (1 − f appl ) f
where f appl = 1 − (1 − precision) NW
(3)
SKIP:
Enext = [Cr + (2 + lcurrent − llast ) ⋅ I ] * f appl + I *(1 − f appl ) where f appl = 1 − (1 − precision)
Where I is the adaptation interval, Cckp is the checkpointing overhead, Cpm is the migration overhead, Cr is the mean recovery cost, fappl denotes the failure probability of the application during the next interval, lcurrent and llast are the index of the current or the last
Our preliminary results obtained by applying the ensemble learning mechanism on both RAS logs have indicated that the proposed predictor can boost prediction accuracy with both Precision and Recall higher than 65%, which represents up to three times improvement over using either of the base methods. Here, Precision is defined as Tp / (Tp + Fp), and Recall is defined as Tp / (Tp + Fn). Tp is the number of correct predictions (i.e. true positives), and Fp is the number of false alarms (i.e. false positives), and Fn is the number of incorrect non-failure predictions (i.e. false negatives).
checkpoint location,
NWf and N Sh represent the number
of failed computation nodes and healthy spare nodes allocated to the application. We have implemented FT-Pro in the open-source checkpointing package MPICH-VCL 0.76 [15]. Note that FT-Pro is independent of the underlying checkpointing tool, and can be easily implemented with other checkpointing tools. We have evaluated FT-Pro with real applications (cosmology application ENZO, molecule dynamics application GROMACS, and the parallel benchmark NPB) under a wide range of settings. Preliminary study has indicated that it outperforms periodic checkpointing in terms of reducing application completion times and improving resource utilization,
3.2 Adaptive Fault Management Based on long-term fault prediction, system can be configured and tasks can be scheduled in such a way to avoid and reduce the possibility of failure. We have developed a set of schedule algorithms, including both optimal and heuristic algorithms, for this purpose. In response to short-term prediction, adaptive fault
4
by up to 43% (see Figure 5). It does better than periodic checkpointing, even when failure prediction has a 70% false positive and false negative rate. Additionally, the overhead caused by runtime adaptation is less than 3%.
combination of five metrics to measure system productivity: three performance metrics (i.e., average response time, system utilization rate, and throughput) and two reliability metrics (i.e., service unit loss and job failure rate). We have designed a discrete event-based simulator which integrates the proposed fault-aware rescheduling with a widely used batch scheduler, i.e., FCFS/EASY Backfilling scheduler. Figure 6 show the relative performance improvement of FARS against FCFS/EASY, where three different recovery options are included (RESUBMIT, RESUME, and RETRY). As we can see, the relative improvement in terms of response time is 8%, 14.7% and 41% under three failure recovery policies respectively by using FARS.
Figure 5. Reduction on application completion time achieved by FT-Pro against periodic checkpointing Figure 6. Relative improvement by using fault-aware rescheduling (FARS) against FCFS
Runtime adaptation also includes the triggering of fault-aware rescheduling and re-leaning of fault patterns. Unlike FT-Pro which emphasizes on improving application performance, our fault-aware rescheduling aims at improving system productivity (i.e., performance and reliability) in response to failure prediction. Given the existence of failure correlations in large-scale systems, simultaneous failures on multiple nodes are possible. In case spare nodes are not sufficient to accommodate migration requests originated from different jobs, how to select jobs for rescheduling is critical. We have designed a fault-aware rescheduling (FARS) algorithm to coordinate job rescheduling [14]. It first analyzes failure impact on each affected user job. The impact is analyzed from four aspects: (1) workloss Cworkloss , the amount of volatile work lost due to the
3.3 System Support Our runtime system development is pursued from two directions: (1) build fault-aware computing environment and (2) support fault management. Our effort along the first direction includes building the MPI-Mitten middleware for live migration [16], the dynamic virtual machine environment for dynamic VM configuration and deployment [17], and fast fault recovery support. Each of these systems is individually valuable and could be used with other fault or non-fault related computing systems. Along the second direction, we have developed libraries and runtime systems to trigger and support of dynamic checkpointing and job rescheduling, as well as a monitoring system. The job rescheduling is two fold: reschedule the jobs in the job queue and reevaluate the fault possibility for better scheduling. Towards this end, we have developed a set of rescheduling strategies to coordinate jobs and computing resources by evaluating performance impact of potential failures on user jobs. Most of the system development along the second direction is based on our previous experience on the GHS system, a performance prediction and test scheduling system for high performance computing [18]. Many of the subsystems, such as the trigging system, monitoring system, rescheduling system, have
failure; (2) restart cost Crestart , the time required to restart the job during recovery; (3) failure downtime Cdowntime , the time used to repair the failed node; and (4) requeue cost Cqueue , the queue waiting time of the job due to the failure. It then estimates the expected performance gain by rescheduling the job. Based on the above performance analysis, it allocates the available spare nodes to those affected jobs whose rescheduling can greatly improve the overall system productivity. In our current design, we have used a
5
already been developed under GHS and only need minor modification and extension to be used under FENCE. Currently these runtime systems are only used individually for component testing. It is still a long way to go to integrate them into one system.
to Failure and Repair,” IEEE Transactions on Computers, Vol 42, NO 10, pp. 1184–1194, 1993. [7] A. Duda, “The Effects of Checkpointing on Program Execution Time,” Information Processing Letters, vol. 16, pp. 221-229, 1983. [8] J. Yu and R. Buyya, “A Taxonomy of Scientific Workflow Systems for Grid Computing,”Special Issue on Scientific Workflows, ACM SIGMOD Record, Vol34, NO 3, pp. 44-49, ACM Press, New York, USA, Sept. 2005. [9] L. Gong, X.H. Sun, and E. Waston, “Performance Modeling and Prediction of Non-Dedicated Network Computing,” IEEE Trans. on Computers, Vol 51, No 9, pp. 1041-1055, 2002. [10] Los Alamos National Laboratory, Operational Data to Support and Enable Computer Science Research, http://institute.lanl.gov/data/lanldata.shtml [11] P. Gujrati, Y. Li, Z. Lan, R. Thakur, and J. White, “A Meta-Learning Failure Predictor for Blue Gene/L systems”, Proc. of ICPP07, 2007. [12] Z. Lan and Y. Li, “Adaptive Fault Management of Parallel Applications for High Performance Computing”, accepted by the IEEE Trans. on Computers, 2008. [13] Y. Li, P. Gujrati, Z. Lan, and X. Sun, “FaultDriven Re-Scheduling for Improving System-Level Fault Resilience”, in Proc. of International Conference on Parallel Processing (ICPP’07), 2007. [14] Z. Lan, Y. Li, P. Gujrati, Z. Zheng, R. Thakur, and J. White, “A Fault Diagnosis and Prognosis Service for TeraGrid Clusters”, in Proc. of The 2nd TeraGrid Conference, WI, 2007. [15] A. Bouteiller, T. Herault, G. Krawezik, P. Lemarinier, and F. Cappello, “MPICH-V: A Multiprotocol Automatic Fault Tolerant MPI,” International Journal of High Performance Computing and Applications, 2005. [16] C. Du and X.-H. Sun, “MPI-Mitten: Enabling Migration Technology in MPI,” in Proc. of 6th IEEE International Symposium on Cluster Computing and the Grid, 2006. [17] C. Du and X-H. Sun, “Model and incarnate virtual environments,” IIT-CS Technical Report (No. IIT/CS-06-01), Illinois Institute of Technology, 2006 [18] Grid Harvest Service http://meta.cs.iit.edu/~ghs/
4. Conclusions This position paper presents the design and development of the FENCE (Fault awareness ENabled Computing Environment) system. While FENCE is an ongoing project, its major components have been developed and tested. We have conducted initial evaluation of FENCE under a wide range of computing settings. Experimental results show that the FENCE approach is promising and has a true potential. We are using FENCE as a framework to develop and test advance fault tolerant mechanisms. Our on-going efforts include the investigation of advanced failure diagnosis and prognosis techniques, the development of better integration and coordination support, and extensive evaluation with real applications on production systems. The ultimate goal of this project is to provide an end-to-end fault management system for high performance computing.
ACKNOWLEDGMENT This work was supported in part by US National Science Foundation under grants CNS0720549, CCF0702737, CNS0406328, EIA0224377, and a TeraGrid Compute Allocation.
Reference [1] E. Elnozahy, L. Alvisi, Y. Wang, and D. Johnson, “A Survey of Rollback Recovery Protocols in Message Passing Systems,” ACM Computing Surveys, vol. 34(3), 2002. [2] S. Chakravorty, C. Mendes, and L. Kale, “Proactive Fault Tolerance in Large Systems,” in Proc. of HPCRI Workshop, 2005. [3] A. Nagarajan and F. Mueller and C. Engelmann and S. Scott, “Proactive Fault Tolerance for HPC with Xen Virtualization,” in Proc. of ICS’07, 2007. [4] M. Wu, X.-H. Sun and H. Jin, "Performance under Failure of High-End Computing", in Proc. of the ACM/IEEE SuperComputing Conference. 2007 (SC'07), 2007. [5] John W. Young, “A First Order Approximation to the Optimal Checkpoint Interval,” Comm. ACM, Vol 17, No 9, pp. 530-531, 1974. [6] P. F. Chimento, Jr., and K. S. Trivedi, “The Completion Time of Programs on Processors Subject
6