The University of Sydney, Sydney, Australia. 13-17 December 2004. Towards a Universal Criterion for Predicting Vortex Breakdown in Swirling Jets.
15th Australasian Fluid Mechanics Conference The University of Sydney, Sydney, Australia 13-17 December 2004
Towards a Universal Criterion for Predicting Vortex Breakdown in Swirling Jets A. J. Fitzgerald, K. Hourigan and M. C. Thompson Fluids Laboratory for Industrial and Aeronautical Engineering (FLAIR), Department of Mechanical Engineering, PO Box 31, Monash University, Clayton, VIC, 3800, AUSTRALIA
Abstract
Previous studies of unconfined swirling jets have shown that when the ratio of the axial to azimuthal velocity exceeds a critical value (Sc ), the vortex core undergoes vortex breakdown [4]. In this paper, critical swirl ratios are determined numerically for a wide range of different upstream axial velocity distributions and Reynolds numbers to determine the general applicability of the proposed critical swirl ratio criterion. While it predicts the onset of vortex breakdown reasonably well, a modified version based on averaged axial and azimuthal velocities, improves the prediction of the onset of breakdown from 60% to better than 10% over a large part of the parameter space considered. Introduction
Vortex breakdown is a flow phenomenon that can affect vortex cores over a wide range of flow parameters. Vortex breakdown and its control have importance to flows in mixing vessels [5], meteorological phenomena (e.g. tornados) [1], military [16] and civil aviation [15], and combustion [17]. Three main vortex breakdown topologies have been identified in the literature [6]: the bubble, spiral and double helix. Recently, a new type has been added to this list, which has been designated conical breakdown due to its conical (near) axisymmetric expansion about the vortex core [4]. The critical swirl ratio criterion described in the abstract, and in more detail below, has been applied to breakdown types including conical breakdown. Refer to the recent review of Lucca-Negro and O’Doherty for details [14]. Early vortex breakdown research was conducted experimentally in diverging pipes [19] and with somewhat less success over delta wings [11]. Numerical studies have allowed an often more detailed analysis of the mechanisms and dynamics of vortex breakdown beginning with the quasi-cylindrical approximation of Hall in 1972 [10]. The quasi-cylindrical approximation allowed prediction of the occurrence and position of vortex breakdown, but not the internal dynamics or the upstream and downstream influences. The use of the quasi-cylindrical approximation is hence limited. Parallel with the increase in computing power came more sophisticated simulations utilising the Navier-Stokes equations with steady [8] and unsteady [9] axisymmetric approximations. Later the need for full 3D time-dependent solutions to the Navier-Stokes equations became more apparent [21]. State of the art direct numerical simulations have successfully shown a variety of vortex breakdown states including the bubble, the spiral, combined bubble and spiral, and combined bubble and helical modes [18]. Despite decades of research, the physical mechanism of vortex breakdown remains under dispute. Three main theories have been put forward, which are supported to varying degrees by experimental observations and measurements. These are: (i) an axisymmetric analogy to a two-dimensional hydraulic jump, where there is a jump transition between the supercritical upstream vortex and the downstream sub-critical conjugate state [2, 3, 19, 18]; (ii) an analogy with two dimensional bound-
ary layer separation, where the quasi-cylindrical approximation of the equations of motion is assumed to be analogous to 2D boundary layer equations, such that a breakdown in the approximation indicates the occurrence of a local separation and hence vortex breakdown [10]; and (iii) through a hydrodynamic instability, that uses stability analysis based on a columnar Q-vortex [17, 12, 13]. Proceeding in parallel with research into the mechanism of vortex breakdown, research has also attempted to find the critical parameters (critical states) that can be used to determine whether breakdown will occur. Most of these critical conditions have been related to axial and azimuthal velocities, or axial and azimuthal momenta [7]. One parameter, the Rossby number, Ro U rc Ω, where U, rc and Ω are the characteristic axial velocity, radius and rotation rate respectively, was used to interpret past experimental and numerical results as well as new numerical results [20]. Collation of the data for the onset of breakdown showed a trend to asymptote to a critical Roc 0 65 for Re 250. Generally, these classifications are based on characteristics of a whole vortex core. Alternatively, the swirl angle, defined as φ tan 1 W U [10], where U and W are the local axial and azimuthal velocities, has been used as a local indicator to predict the downstream occurrence of breakdown.
�
�
� �
� � � �
One form of critical parameter—the swirl ratio, has been argued to provide a better indicator of the onset of breakdown than the Rossby number [4]. An analysis based on Bernoulli’s equation applied along the core centreline, and the assumption that the pressure in the breakdown region matches the far field pressure, leads to the prediction that breakdown will occur under the following condition
� �� 2 � (1) � Here, S is the swirl ratio, W � is the azimuthal velocity at � radius r R 2 and a small distance downstream of the nozzle exit at z z , R is the nozzle radius and U � is the axial velocity at the nozzle centreline (hereafter referred to as U ). Results of swirling jet experiments [4] showed that for 300 � Re � 1200, vortex breakdown first occurred at S � 1 � 4, S
�
2W R 2 z0 U 0 z0 R 2 z0
0
0 z0
cl
consistent with the theoretical prediction. Note that equation 1 has been simplified by assuming a Rankine vortex, i.e. solid body rotation and a top-hat axial velocity profile.
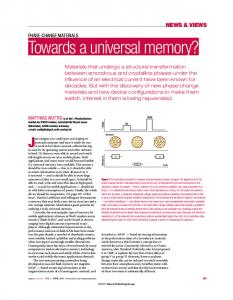
Figure 1 shows the variation of the centreline, flow-rateaveraged and momentum-averaged jet velocity as a function of swirl ratio for the swirling jet studied experimentally by Billant et al. [4]. As expected, the averaged velocities are almost constant with swirl ratio, since the experimental rig was supplied with a constant head. Of interest, the axial velocity profiles (with radius) show a variable height local peak in the axial velocity at the centreline depending on the relative swirl ratio, however, further out from the axis the axial velocity is relatively uniform before dropping smoothly to zero at the edge of the jet. It is expected that the relatively small mass flow associated with
0.03
Ucl Uflow aver. Umomentum aver.
0.025
1.2 1
0.02 U
0.8 U/UCL
0.015
0.6
0.01
0.4
0.005
0.2
0
Billant et al.(1998) Medium Flattened Peaked Top-Hat
0 0
0.2
0.4
0.6
0.8
1
1.2
1.4
-1
S
Figure 1: The magnitude of the centreline axial velocity used in the swirl ratio S, as compared with the flow and momentum averaged velocities. this local peak should not have a great influence on the tendency for the jet to breakdown. Despite this, but with some theoretical support, the centreline velocity was the measure used by Billant et al. [4] to represent the axial flow in equation 1. The aims of this research were to determine the sensitivity of critical swirl ratio (Sc ) to changes to the axial velocity profile and, if the critical swirl ratio was found not to be constant, then to attempt to find a modified version of the swirl ratio for which this would be the case. Numerical Method
Axisymmetric numerical simulations were performed using a spectral-element code previously developed and validated [22]. The method employs high-order tensor-product Lagrangian polynomials as shape functions within the discretisation elements. Accurate and efficient integration over each element is achieved by matching the node points of the Lagrangian polynomials to the Gauss-Legendre-Lobatto quadrature points. The method is second-order accurate in time.
-0.5
0
0.5
1
r/R
Figure 2: Axial velocity profiles tested (medium, flattened, peaked and top-hat) as compared with the profile given by Billant et al.(1998)[4] ( � ) for S 1 � 33, a swirl ratio near the critical swirl ratio Sc . flattened profiles have been momentum matched to the profile of Billant et al. (1998) (figure 2). The flattened and peaked profiles have centreline velocities decreased and increased by 20% from that of the medium case. The top-hat profile has the same centreline velocity as the medium case but significantly higher momentum. This profile also has the same averaged velocity as its centreline velocity (U¯ Ucl ). All profiles simulated were generated using the U � r �� Ucl � 1 � � r R � n � where the exponent n describes the profile. The peaked, medium, flattened and tophat profiles had n 1 � 55, 2 � 39, 5 � 1 and 1000, respectively. Azimuthal velocity profiles follow a sinusoidal curve described by W � r �� WR 2 0 sin � πr R � , where WR 2 0 is the peak azimuthal velocity at the nozzle exit. The radial velocity (V ) was set to zero at the inlet. The Reynolds number (Re) was defined as Re 2RU¯ ν, where U¯is the mass-flow averaged axial velocity. Locating Sc was accomplished by running a series of independent simulations at increasing azimuthal velocity with sufficient resolution, such that the critical swirl ratio for the onset of vortex breakdown could be determined to within Sc � 0 � 02.
The computational grid has six macro elements across the swirling jet with mesh compression towards the outer radius (R) to help resolve the jet shear layer. There are thirteen macro elements expanding out from the nozzle radius to the outer radial boundary at r 10R. The axial domain length is l 46R and there are thirty macro-elements that expand away from the nozzle. The number of internal nodes was fixed for all cases at � 36 (6 6), limiting the error in flow field characteristics, such � as Strouhal number and point velocities, to 3%. This error estimate was determined through a series of simulations with higher numbers of internal nodes per element. At the inflow boundary the axial and azimuthal velocity profiles were specified. At the outlet boundary the normal component of velocity were set to zero. Initial problems with divergence of the solution as the jet reached the outlet were resolved by the inclusion of a viscous sponge region of very high relative viscosity. This was applied in the last three rows of elements before the outlet. A free-slip condition was specified to the outer wall. The flow was evolved until it reached either a steady, periodic or asymptotic state (dependent on flow parameters). Typically this involved 1–2 � 105 timesteps.
The critical swirl ratios determined from the numerical simulations are shown in figure 5. The numerical predictions � ( ������� ��� ) have hyperbolic trendlines determined using the least squares method. The experimental values from [4] are shown ( � ) without a trendline. Figure 5 (a) shows predictions based on the definition of the swirl ratio given in equation 1.
In order to investigate the effect of velocity profile on the critical swirl ratio, four quite different axial velocity profiles were chosen (figure 2). These profiles will be referred to as ”medium”, ”flattened”, ”peaked” and ”top-hat”. The medium, peaked and
The critical swirl ratio (Sc ) for vortex breakdown for the simulated medium case (the case most similar to the experimental work), demonstrates convergence on Sc � 1 � 28. This correlates with the measured range of 1 � 22 � Sc � 1 � 57 published by Bil-
Results
Predicted vortex breakdown structures showed good qualitative correlation with experiments as seen in figure 3 and 4. At Re � 600, the bubble was the first breakdown state formed. In all cases the bubble progressed into a cone with increasing S. The transition from bubble to cone with increasing swirl involves a state where both the cone and bubble alternately appear in an unsteady fashion. With further increases in swirl a steady cone appears, however at high Re, the ”tails” of the cone experience a shear layer instability causing a form of vortex shedding, as can be seen in figure 3. At Re � 600, the cone type was the first breakdown state to form and no real bubble was subsequently formed.
Figure 4: Comparison of unsteady bubble vortex breakdown between dye-visualisation from Billant et. al.(1998) Re 600 and S 1 42 and simulated contours of azimuthal vorticity at Re 600, S 1 32.
�
�
�
critical swirl ratio based on averaged axial and azimuthal velocities may be more successful at collapsing the data. Following through this line of reasoning, the following swirl ratio parameter is suggested as an alternative to the definition used in equation 1 Figure 3: Comparison of unsteady conical vortex breakdown between dye visualisations of Billant et al.(1998) at Re 626, S 1 31 and simulated contours of azimuthal vorticity at Re 650, S 1 45.
�
�
�
lant et al. [4], and corresponds to their experimental data also shown in the figure. The most notable difference between the simulations and the experimental data is the trend toward higher critical swirl ratios at lower Re. This trend has been noted previously in an extensive review of both numerical and experimental results [20], and is an effect that becomes apparent at Re 300. Some evidence of this effect can be seen in the experimental data shown here although most of the results are for higher Reynolds numbers.
�
Figure 5(a) reveals that the critical swirl ratio is dependent on the axial velocity profile and there is a significant shift to higher critical swirl ratios at lower Reynolds numbers. For example, Sc for the flattened and peaked profiles were respectively higher and lower than the base case by up to 20%, and up to 60% higher for the top-hat case. This effect is not surprising when the jet is considered in terms of flow rate or momentum. Looking at the flattened case, the total axial momentum is unchanged from the medium case, however the denominator of the swirl ratio (Ucl ) has decreased, causing an increase in the critical ratio. The opposite occurs with the peaked profile. A similar situation applies to a top-hat profile, where U¯ Ucl , Sc increases to 2. As expected, the significantly larger momentum in this jet is causing a significant increase in the critical swirl ratio.
�
However, the significant differences in Sc for the medium, flattened and peaked cases suggests that neither the upstream centreline axial velocity nor the axial momentum are the appropriate scaling parameters influencing the downstream vortex breakdown state. In fact, the average flow rates are U¯ 1 217, 1 265, 1 335 and 2 323 for the peaked, medium, flattened and top-hat profiles, respectively, despite the constancy of axial momentum for the first three of these profiles. This suggests that a
�
�
�
�
� 2UW¯¯ � z0
S
(2)
z0
Here, W¯z0 is the mass-flow averaged azimuthal velocity evaluated at the upstream position z z0 . Figure 5(b) shows the critical swirl ratio based on this definition of the swirl ratio. Clearly, the use of averaged axial and azimuthal velocities in the formulation significantly improves the collapse of the data. For a particular Reynolds number, the critical swirl ratio varies by less than 10%, despite significant changes to the axial velocity profile. The critical swirl ratio increases slightly at Reynolds number below approximately 400. For Re 400, Sc 1 2 1 3. �
� �
�
�
Figure 5(b) also yields further support for the idea that the centreline velocity may not be the optimal scaling parameter even with respect to the axial velocity profiles given by Billant et al. [4]. The critical swirl ratios determined from their experiments are almost exactly coincident with the predictions for a top-hat profile. In retrospect, this should not be wholly unexpected, as the local axial velocity peak at the centreline contributes only slightly to the overall jet mass or momentum flux. Recall that their axial velocity profiles resemble a top-hat distribution, except for the appearance a localised increase in velocity near the centreline. While the new formulation does not eliminate the slight Reynolds number dependence at low Reynolds numbers, the effect is considerably less for the swirl ratio based on integrated parameters. Conclusions
The results of the present numerical simulations of axisymmetric vortex breakdown of a swirling jet using the spectral-element method show good correlation with those obtained from the experiments of [4]. Axisymmetric solutions show both the bubble and the cone type of vortex breakdown as seen in these experiments. The simulations are successful at replicating the ob-
3.5
[3] Benjamin, B. T., Some developments in the theory of vortex breakdown, J. Fluid Mech., 28(1), 1967, 65–84.
Billant et al.(1998) Medium Flattened Peaked Top-Hat
3 2.5
[4] Billant, P., Chomaz, J.-M. and Huerre, P., Experimental study of vortex breakdown in swirling jets, J. Fluid Mech., 376, 1998, 183–219.
2
[5] Escudier, M., Observations of the flow produced in a cylindrical container by a rotating endwall, Exps. Fluids, 2, 1994, 189–196.
S 1.5 1
[6] Faler, J. and Leibovich, S., An experimental map of the internal structure of a vortex breakdown, J. Fluid Mech., 86, 1978, 313–335.
0.5 0
[7] Farokhi, S., Taghavi, R. and Rice, E., Effect of initial swirl distribution on the evolution of a turbulent jet, AIAA Journal, 27(6), 1988, 700–706.
3.5 Billant et al.(1998) Medium Flattened Peaked Top-Hat
3 2.5
S *
[8] Grabowski, W. and Berger, S., Solutions of the navierstokes equations for vortex breakdown, J. Fluid Mech., 75, 1976, 525–544.
2
[9] Hafez, M., Ahmad, J., Kuruvila, G. and Salas, M., Vortex breakdown simulation, AIAA Journal, 7-1343.
1.5
[10] Hall, M., Vortex breakdown, Ann. Rev. Fluid Mech., 4, 1972, 195.
1 0.5 0 200
400
600
800
1000
1200
Re Figure 5: Comparison of critical swirl ratio for vortex breakdown between data and present numerical simulations. denotes experimental data[4]. show present simulation data. Figures show swirl ratio as interpreted (a) using S and (b) using S .
��������� ��
served behaviour of the critical swirl ratio when a similar axial velocity profile to that seen in the experiments is used. This allowed us to extend on the experimental work by observing the effect of swirl ratio definition on jets with different axial velocity profiles. It was seen that the swirl ratio definition originally used in interpreting the experimental data (equation 1) did not produce a profile-independent critical swirl ratio for the range of profiles tested. The inclusion of an averaged azimuthal velocity and an averaged axial flow velocity in the definition of the swirl ratio (equation 2) yielded an excellent collapse of data, so that the critical swirl ratio was in the range Sc 1 2 1 3.
� �
�
�
At present the authors are trying to develop a theoretical understanding of these observations. Acknowledgements
Mr. Fitzgerald acknowledges the support of the Department of Mechanical Engineering, Monash University, through a Departmental Scholarship. References
[1] Althaus, W., Br¨ucker, C. and Weimer, M., Breakdown of slender vortices, In Fluid Vortices (ed. S. Green), 373– 426. [2] Benjamin, B. T., Theory of the vortex breakdown phenomenon, J. Fluid Mech., 14(4), 1962, 593–629.
[11] Lambourne, N. and Bryer, D., The bursting of leading edge vortices, Aeronaut. Res. Coun., R and M, 3282. [12] Leibovich, S., Vortex stability and breakdown, In Aerodynamics of Vortical Type Flows in Three Dimensions (ed. A.D. Young), AGARD Conference Proceeding, 342, 1983, Paper 23. [13] Leibovich, S., Vortex stability and breakdown: Survey and extension, AIAA Journal, 22(9), 1984, 1192–1206. [14] Lucca-Negro, O. and O’Doherty, T., Vortex breakdown: A review, Prog. Energy Combust. Sci., 27, 2001, 431–481. [15] Mager, A., Dissipation and breakdown of a wing-tip vortex, J. Fluid Mech., 55(4), 1972, 609–628. ¨ oren, M., Sahin, B. and Rockwell, D., Vortex structure [16] Ozg¨ on a delta wing at high angle of attack, AIAA Journal, 40, 2002, 258–292. [17] Panda, J. and McLaughlin, G., Experiments on the instabilities of a swirling jet, Phys. Fluids, 6, 1994, 262–276. [18] Ruith, M., Chen, P., Meiburg, E. and Maxworthy, T., Three-dimensional vortex breakdown in swirling jets and wakes: Direct numerical simulation, J. Fluid Mech., 486, 2003, 331–378. [19] Sarpkaya, T., On stationary and travelling vortex breakdowns, J. Fluid Mech., 45(3), 1971, 545–559. [20] Spall, R., Gatski, T. and Grosch, C., A criterion for vortex breakdown, Phys. Fluids, 30(11), 1987, 3434–3440. [21] Spall, R., Gatski, T. and Grosch, C., The structure and dynamics of bubble-type vortex breakdown, Proc. Roy. Soc. Lond. A, 429, 1990, 613–637. [22] Thompson, M., Leweke, T. and Provansal, M., Kinematics and dynamics of sphere wake transition, J. Fluids Structures, 15, 2001, 575–585.