Archaea 1, 303–309 © 2005 Heron Publishing—Victoria, Canada
Trace methane oxidation studied in several Euryarchaeota under diverse conditions JAMES J. MORAN,1 CHRISTOPHER H. HOUSE,1,2 KATHERINE H. FREEMAN1 and JAMES G. FERRY3 1
Department of Geosciences and Penn State Astrobiology Research Center, Penn State University, 220 Deike Bldg., University Park, PA 16802, USA
2
Corresponding author (
[email protected])
3
Department of Biochemistry and Molecular Biology and Penn State Astrobiology Research Center, Penn State University, 205 South Frear, University Park, PA 16802, USA
Received June 16, 2004; accepted November 16, 2004; published online December 6, 2004
Summary We used 13C-labeled methane to document the extent of trace methane oxidation by Archaeoglobus fulgidus, Archaeoglobus lithotrophicus, Archaeoglobus profundus, Methanobacterium thermoautotrophicum, Methanosarcina barkeri and Methanosarcina acetivorans. The results indicate trace methane oxidation during growth varied among different species and among methanogen cultures grown on different substrates. The extent of trace methane oxidation by Mb. thermoautotrophicum (0.05 ± 0.04%, ± 2 standard deviations of the methane produced during growth) was less than that by M. barkeri (0.15 ± 0.04%), grown under similar conditions with H2 and CO2. Methanosarcina acetivorans oxidized more methane during growth on trimethylamine (0.36 ± 0.05%) than during growth on methanol (0.07 ± 0.03%). This may indicate that, in M. acetivorans, either a methyltransferase related to growth on trimethylamine plays a role in methane oxidation, or that methanol is an intermediate of methane oxidation. Addition of possible electron acceptors (O2, NO 3– , SO 24 –, SO 23 –) or H2 to the headspace did not substantially enhance or diminish methane oxidation in M. acetivorans cultures. Separate growth experiments with FAD and NAD+ showed that inclusion of these electron carriers also did not enhance methane oxidation. Our results suggest trace methane oxidized during methanogenesis cannot be coupled to the reduction of these electron acceptors in pure cultures, and that the mechanism by which methane is oxidized in methanogens is independent of H2 concentration. In contrast to the methanogens, species of the sulfate-reducing genus Archaeoglobus did not significantly oxidize methane during growth (oxidizing 0.003 ± 0.01% of the methane provided to A. fulgidus, 0.002 ± 0.009% to A. lithotrophicus and 0.003 ± 0.02% to A. profundus). Lack of observable methane oxidation in the three Archaeoglobus species examined may indicate that methyl-coenzyme M reductase, which is not present in this genus, is required for the anaerobic oxidation of methane, consistent with the “reverse methanogenesis” hypothesis. Keywords: anaerobic methane oxidation, Archaeoglobus, methanogen, reverse methanogenesis, stable isotope label.
Introduction The anaerobic oxidation of methane (AOM) is a significant methane sink in marine sediments, oxidizing up to 90% of the biological methane produced in these environments (Hinrichs et al. 2000). Organisms responsible for AOM (ANME-1 and ANME-2) have not been isolated, but genetic and lipid analyses indicate the methane-consuming organisms are archaeal and closely related to cultured methanogenic genera, specifically Methanosarcina and Methanococcoides (Hinrichs et al. 1999, 2000, Boetius et al. 2000, Orphan et al. 2001a). Lipid analyses and fluorescence in situ hybridization (FISH) suggest that certain bacteria form tight consortia with the archaeal methanotrophs (ANME-2), coupling methane oxidation to sulfate-reduction and rendering the overall reaction thermodynamically favorable (Boetius et al. 2000, Orphan et al. 2001b). Nauhaus et al. (2002), investigating methane seep sediments, showed a 1:1 reduction of sulfate to sulfide with the oxidation of methane to CO2 when methane served as the only available electron donor. The bacterial component of these natural consortia is most closely related to isolated sulfate-reducers from the Desulfosarcinales (Orphan et al. 2001a), and stable isotope evidence suggests their biomass is, at least in part, composed of carbon from oxidized methane (Hinrichs et al. 2000, Pancost et al. 2000, Orphan et al. 2001b, Michaelis et al. 2002). Some archaeal methane-oxidizing organisms (ANME-1) may perform AOM and associated sulfate reduction unaided by bacteria (Michaelis et al. 2002, Orphan et al. 2002). The enzymatic mechanisms mediating AOM in marine sediments remain unknown. One possible mechanism, proposed by Hoehler et al. (1994), is reverse methanogenesis. In this paper, we refer to “reverse methanogenesis” as the reversal of a methanogen’s typical metabolism such that methane production is replaced by net methane oxidation. Hallam et al. (2004) recently found nearly all genes associated with methanogensis in environmental ANME-1 sequences. It is hypothesized that reverse methanogenesis begins with methane activation by either methyl-coenzyme M reductase (MCR) or methyl transfer-
304
MORAN, HOUSE, FREEMAN AND FERRY
ase (MT) as described by Hoehler and Alperin (1996). Methyl-coenzyme M reductase catalyzes the final reductive step in all known biogenic methane formation and the operon (mcrA) encoding this enzyme is observed in all known methanogen species. Consistent with the reverse methanogenesis hypothesis is the recent discovery of mcrA or a close variant in both ANME-1 and ANME-2 environmental samples (Hallam et al. 2003, 2004, Krüger et al. 2003b). In the event that ANME-2 methanotrophy is initiated by reverse MCR activity, analysis of closely related, culturable species with active MCR may provide a suitable model system for studying archaeal methane oxidation until the indigenous archaeal methanotrophs can be cultured. We use the term “trace methane oxidation” (TMO) to refer to the conversion of labeled methane to CO2 in methanogen cultures during typical methanogenic growth (Zehnder and Brock 1979, Harder 1997). The extent to which reverse methanogenesis and TMO are related is undetermined. Yet, if the two processes are mechanistically similar, providing an organism capable of TMO with favorable environmental conditions could potentially initiate reverse methanogenesis. Although never experimentally demonstrated, Hohler and Alperin (1996) used a thermodynamic approach to argue that under the proper conditions, principally low H2 pressures, reverse methanogenesis is favored. Also, exposure to typical methanogenesis inhibitors (such as bromoethane or methyl fluoride) halts AOM activity within marine consortia (Krüger et al. 2003a), suggesting a possible link to methanogenesis pathways. The reverse methanogenesis hypothesis invokes consortia associations to help maintain thermodynamic favorability by consuming the methanotroph’s metabolic end product, keeping its concentration below a critical thermodynamic threshold. One possible end product is H2, which could be produced by an archaeal methanotroph and consumed by sulfate-reducing bacteria. Valentine et al. (2000) monitored H2 production rates in stressed methanogen cultures subjected to high methane concentrations and low methanogenic substrate levels. No link between methane abundance and H2 production was observed, suggesting reverse methanogenesis is either unrelated to H2 production or it is not a metabolism adoptable by the methanogens tested. Acetate has been proposed as an alternative AOM intermediate (Valentine and Reeburgh 2000). Yet, Nauhuas et al. (2002) tested multiple potential intermediates (including acetate, formate, hydrogen and methanol) and demonstrated these possible intermediates did not greatly enhance sulfate reduction rates in methane seep sediment samples, suggesting that acetate is not an intermediate for in situ AOM. In order to further understanding of TMO and evaluate the reverse methanogenesis hypothesis, we examined TMO in pure cultures of three Archaeoglobus species and three methanogen species. Our experiments were aimed at determining (1) if archaeal species more closely related to AOM methanotrophs exhibited a stronger propensity for methane oxidation expressed through enhanced TMO, (2) whether the inclusion of different potential electron acceptors make conditions more amenable to methane oxidation, increasing the level of TMO
and (3) if archaeal sulfate-reducers, which share genetic similarity to the ANME group but lack the potential enzymatic methane activators (namely MCR) required for reverse methanogensis, exhibit TMO. For each experiment, a set of cultures was grown under headspaces containing differing proportions of 13C-labeled methane. Following growth, isotopic analysis was used to quantify the amount of 13C label converted from methane to CO2, indicating the extent of TMO in the culture. Materials and methods Microorganisms Archaeoglobus fulgidus VC16, Archaeoglobus profundus AV18 and Methanobacterium thermoautotrophicum ΔH were obtained from the Deutsche Sammlung von Mikroorganismen und Zellkulturen (DSMZ, Braunschweig, Germany). Methanosarcina barkeri MS was obtained from the Oregon Collection of Methanogens (Portland, OR). Archaeoglobus lithotrophicus TF2 was a kind gift from Karl Stetter (emeritus, Universität Regensburg, Germany). Methanosarcina acetivorans 2CA was provided by J.G.F. Media Strict anaerobic technique was employed for cell culturing. Media for A. fulgidus and A. profundus were prepared as recommended by DSMZ (media 399 and 519, respectively). Methanobacterium thermoautotrophicum was cultured on medium containing: 3.0 g Na2SO4, 0.2 g KH2PO4, 0.3 g NH 4 Cl, 0.3 g KCl, 0.2 g CaCl2·2H2O, 0.3 g MgCl2·6H2O, 1.0 ml 10× Wolfe solution (Wolin et al. 1963), 0.5 mg resazurin, 3.0 ml NaOH solution (10%) and 0.5 g Na2S·9H2O. All reagents except Na2 S were mixed in solution and degassed by bubbling with N2 for 20 min followed by Na2S addition. The medium (20 ml per bottle) was dispensed into 120-ml culture bottles in an anaerobic chamber followed by three flushes with a mixture of H2 and CO2 (80:20 (v/v)) and subsequent filling of the bottles to 0.3 MPa pressure with the gas mixture and sterilization in an autoclave. Archaeoglobus lithotrophicus was cultured in the same medium, but with the addition of 20 g NaCl l – 1. Methanosarcina barkeri was cultured in medium containing (per liter): 0.29 g K2HPO4·3H2O, 0.23 g KH2PO4, 0.23 g (NH4)2SO4, 0.45 g NaCl, 0.06 g CaCl2·2H2O, 0.09 g MgSO4·7H2O, 1.0 ml (NH4)2Ni(SO4) 2 solution (0.2%), 1.0 ml FeSO4·7H2O solution (0.2%), 0.5 mg resazurin, 1.0 ml 10× Wolfe mineral solution (Wolin et al. 1963), 6.0 ml vitamin solution, 4.0 ml NaOH solution (10%) and prepared as above with the addition of 0.5 g l – 1 Na2S·9H2O. Medium for M. acetivorans contained (per liter final solution): Mix A: 23.4 g NaCl, 3.8 g NaHCO3, 1.0 g KCl, 1.0 ml 10× Wolfe mineral solution, 2.0 ml vitamin solution and 0.5 mg resazurin; Mix B: 11.0 g MgCl2·6H2O, 0.30 g CaCl2·2H2O and 0.68 g KH2PO4; Mix C: 1.0 g NH4Cl, 0.50 g cysteine hydrochloride and appropriate substrate; and Mix D: 0.50 g Na2S·9H2O. Mixes A and B in 500 ml water each were degassed under N2 then combined in an anaerobic chamber followed by addition of Mix C and finally the addition of Mix D. Substrates were
ARCHAEA VOLUME 1, 2005
TRACE METHANE OXIDATION IN EURYARCHAEOTA
trimethylamine (9.56 g l – 1) or methanol (5.0 ml l – 1). Once dispensed (30 ml per culture bottle), individual bottles were flushed three times, then filled to 0.2 MPa pressure with a mixture of N2 and CO2 (80:20 (v/v)) and autoclaved. For the experiment involving M. acetivorans and H2, the culture bottles were pressurized to 0.2 MPa with a mixture of H2 and CO2 (80:20 (v/v)). For experiments involving M. acetivorans and oxygen, neither Na2S nor resazurin were included in the growth media and sterile oxygen was injected into the bottles after autoclaving. Cultivation Two sets of four culture bottles were used for each species investigated. A total of 40 ml (at 0.1 MPa ≈1.8 mmol) of methane was added to each culture bottle with increasing proportions of labeled methane (99% 13CH 4, 1% 12CH 4 ) added to each bottle in the series (Lot 00-04, Cambridge Isotope Labs, Cambridge, MA). For each tested species, one set of bottles was inoculated for growth and the other was kept uninoculated as a negative control. All species, except M. barkeri, were incubated for 1 week to ensure maximum growth and substrate consumption. Because of its slower growth, M. barkeri was incubated for 2 months. The amount of methane produced in each culture was calculated from established stoichiometric relationships for each substrate and final methane production. The cultures were grown to completion, ensuring complete substrate usage. Measurement of methane concentration in parallel experiments, by gas chromatography with a thermal conductivity detector, confirmed the accuracy of calculated methane productivity. Cell counts following growth were performed by phase- contrast microscopy with a counting chamber for all species but M. barkeri where cell clumping prevented accurate counting.
305
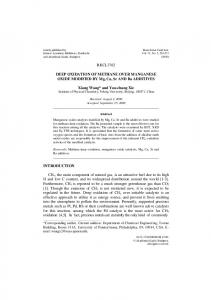
Data analysis Isotope data were plotted as the 13C fractional abundance of the initial methane (FCH4 = 13C/(13C + 12C)) in each culture bottle versus the measured fractional abundance of CO2 (FCO2) in each bottle after incubation (Figure 2). Least-squares calculations provide the slope and intercept for the resulting relationships and a positive slope indicates methane oxidation. We next consider mass balance for methane and CO2 produced by M. acetivorans cultures during growth on either trimethylamine or methanol. The methane in a culture bottle after growth represents that contributed during growth and methane lost by oxidation: FT n T = Fi n i + Fb n b – Fox n ox
(1)
where FT, Fi, Fb and Fox represent the fractional abundance of carbon isotopes in total, initial, biogenic and oxidized methane, respectively. Likewise, nT, ni, nb and n ox represent the moles of total, initial, biogenic and oxidized methane, respectively. We assume that any fractionation in the methane oxidation process is insignificant in our strongly labeled system, such that Fox = FT; we can therefore simplify Equation 1 and solve for FT: FT =
Fi n i + Fb n b ni + nb
(2)
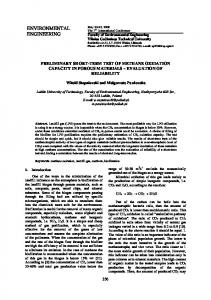
Sample preparation Following culture growth, two distillations were performed to collect and purify CO2 from each sample for isotope analysis. The first distillation was done with an apparatus (Figure 1) we developed for collection of CO2 from high pressure cultures with up to 0.4 MPa of mixed gases. After growth, a sample bottle was connected to the evacuated distilling apparatus through a gas-tight needle. A liquid nitrogen trap froze CO2 from the culture bottles into a separate collection tube, and gaseous methane was pumped from the sample. A secondary liquid nitrogen trap ensured quantitative CO2 collection. During growth, the Archaeoglobus spp. produced H2S, which interfered with preliminary CO2 isotope analysis. For these samples, about 100 mg of silver foil was included in the sample collection vial at room temperature over 24–48 h prior to analysis on the mass spectrometer. The foil removed all H2S artifacts from the isotopic analysis. A second distillation cryogenically trapped and removed water (2-propanol and dry ice) and condensed CO2 (liquid nitrogen) to assure residual noncondensable gasses were removed. Isotope analysis to determine the 13C/ 12 C ratio for the CO2 in each culture bottle was performed with a Finnigan MAT 252 dual inlet mass spectrometer (Thermo Finnigan, Bremen, Germany).
Figure 1. The distilling apparatus used to isolate CO2 cryogenically from pressurized culture bottles after growth. Sample was introduced to the system through a needle. Liquid nitrogen collected CO2 in a separate sample tube, allowing for subsequent removal of non-condensable gases by a vacuum. The auxiliary freezing coil was also cooled by liquid nitrogen and served as a secondary trap for assuring no CO2 loss. Heating the auxiliary freezing coil after removing noncondensable gases allowed any trapped CO2 to migrate to the sample tube.
ARCHAEA ONLINE at http://archaea.ws
306
MORAN, HOUSE, FREEMAN AND FERRY
We assume oxidized CH 4 is converted to CO2, such that: FTCO2n TCO2 = Fi CO2n i CO2 + Fb CO2n b CO2 + FTCH4n ox
(3)
where FT CO2, Fi CO2 and Fb CO2 represent fractional abundance of carbon isotopes in total, initial and biogenic CO2, respectively. Similarly, n T CO2, n i CO2 and n b CO2 represent moles of total, initial and biogenic CO2, respectively. In a culture bottle containing unlabeled methane, we can ignore the methane oxidation input into the CO2 mass balance because the small n ox does not significantly affect FT CO2 or n T CO2. In cases with unlabeled methane we have: (4)
FTCO2* n TCO2* = Fi CO2* n i CO2* + Fb CO2* n b CO2*
where terms are defined as in Equation 3, and an asterisk refers to bottles cultured with unlabeled methane. We prepared incubation bottles such that Fi CO2 = Fi CO2* and n i CO2 = n i CO2* . Therefore, unlabeled incubations account for CO2 produced during cell growth: (5)
FTCO2n TCO2 = FTCO2* n TCO2* + FT n ox Combining Equations 2 and 5 and solving for n ox gives: n ox = ( FTCO2n TCO2 – FTCO2* n TCO2*)
Fi n i + Fb n b ni + nb
(6)
where FT CO2 and FT CO2* were measured in multiple sample cultures with varied Fi (Figure 2). The value of FT CO2 was interpolated from the linear regression of the data at the median Fi, whereas FT CO2* was interpolated from the same line at the point with no labeled methane. We controlled the amount of labeled methane added to each bottle, with ni fixed at 1.8 mmol. We estimated the biogenic methane composition to be δ = –50‰, and therefore Fb = 0.0106. Because of the strong label, small variations in Fb become inconsequential to the results. The value of nb was estimated based on the stoichiometry of methanogenesis for a given substrate and confirmed in parallel experiments by gas chromatography with a thermal conductivity detector. The value of n T CO2* was estimated by summing n i CO2* and n b CO2* ; CO2 input from CH4 oxidation was small in comparison with other CO2 sources. We solved for nox using an iterative method. First, n T CO2 was estimated as equal to n T CO2* . We then solved for nox by adjusting n T CO2 to account for CO2 derived from CH 4 oxidation. The nox values converged within two to three iterations. We calculated nox for both the growth experiments and control bottles (media with labeled CH 4 but no cells) and the amount of CH 4 oxidized in each experiment is reported as the difference between these two values. Error estimates are based on the standard error of the slope used to calculated FT CO2 and FT CO2* . Final reported error was estimated by repeating the above calculations using an experimental slope plus twice the slope standard error (i.e., 2 SD) and a control slope minus twice the slope standard error. The same system of calculations was used for determining CH 4 oxidation in the other methanogen and sul-
Figure 2. The 13C fractional abundance (13F ) of a culture bottle’s CO2 after incubation versus 13F of final CH4 tracks methane oxidation to CO2. (A) The 13F CO2 in culture bottle headspace following incubation versus 13F of the final methane in each bottle for Methanosarcina acetivorans cultures (䊏) grown with trimethylamine and for identical, but not inoculated, control bottles (䊐). The difference in slopes between the cultured (8.0 × 10 – 3) and control samples (–8.6 × 10 – 5) determined the amount of methane oxidation in the experiment. (B) Results from Archaeoglobus profundus (䊉) and control samples (䊊) showing no direct relationship between the extent of final methane enrichment and 13F of final CO2, indicating no methane oxidation by the cultures.
fate reducer cultures, adjusted to account for stoichiometric input (or uptake) of biogenic methane and CO2 (nb, n b CO2). Methane oxidation is reported as both the percent of total postgrowth methane oxidized in each bottle and, for methanogens, as the percent of methane produced during growth that was oxidized to CO2.
Results and discussion Archaeoglobus is an archaeal sulfate-reducing genus with multiple culturable representatives (Stetter et al. 1987, 1993). There are several reasons we chose to look at Archaeoglobus for studying TMO. First, recent environmental genomic sequencing of uncultured AOM methanotrophs revealed a gen-
ARCHAEA VOLUME 1, 2005
TRACE METHANE OXIDATION IN EURYARCHAEOTA
eral core similarity between the ANME-1 and the Archaeoglobales (Hallam et al. 2004). Second, sulfate reduction by Archaeoglobus could provide an electron sink for methane oxidation. Third, Archaeoglobus species possess much of the enzymatic machinery associated with methanogenesis (Klenk et al. 1998). Archaeoglobus fulgidus, for example, contains enzymes involved with the reduction of CO2 to a methyl group in methanogenesis, but operates these enzymes in the reverse direction, oxidizing methyl groups to CO2. Yet, Archaeoglobus species lack MCR (Stetter et al. 1987, Klenk et al. 1998), used in all known methanogenic pathways and thought likely to be required for reverse methanogenesis. Although the role of MCR in methanotrophy is undetermined, its absence from Archaeoglobus species would prohibit the initiation steps required for reverse methanogenesis unless an alternative enzymatic pathway for methane activation is present. We examined methane oxidation in three Archaeoglobus species, each utilizing different growth substrates for sulfate reduction: A. fulgidus utilizes lactate; A. profundus utilizes acetate and H2; and A. thermolithotrophicus grows chemolithotrophically on media containing H2 and CO2. In each case, the amount of methane oxidized was not detected within the experimental error (Figure 3, Table 1). Lack of observable TMO in these species suggests MCR is required for TMO, which is consistent with the reverse methanogenesis hypothesis for AOM. The methanogens, Mb. thermoautotrophicum, M. barkeri and M. acetivorans, each displayed small amounts of methane oxidation (Figure 3, Table 1), consistent with previous reports based on similar experimental work (Zehnder and Brock 1979, 1980, Harder 1997). We further explored the reaction in M. acetivorans, which has a close rRNA phylogenetic relationship with the ANME-2 methanotroph lineage (Orphan et al. 2001a) and also has a large and complex genome (~5.8 Mb) with high metabolic diversity (Galagan et al. 2002). Such a close relationship to indigenous AOM species coupled with its large genome makes M. acetivorans a reasonable candidate for harboring genes required for reverse methanogenesis and may make it a valuable model organism for studying archaeal methane oxidation. The TMO we observed suggests a path-
307
way for methane oxidation is present in M. acetivorans. We tested whether O2, NO –3 , SO 24 – and SO 23 – could be used as electron acceptors in methane oxidation by M. acetivorans. Enriching the culture medium with these electron acceptors could stimulate methane oxidation if electrons can be transferred to them effectively. Sulfite is a metabolic intermediate in bacterial sulfate reduction and, therefore, we hypothesize that it could be transferred between the archaeal and bacterial members of in vivo AOM consortia. In our model, sulfite transfer within the AOM consortia from the sulfate reducer to the archaeal ANME-2 would provide oxidizing potential for the methanotrophic reactions. However, none of the electron acceptors tested with M. acetivorans substantially enhanced the amount of methane oxidized in the cultures (Figure 3, Table 1), indicating that these electron acceptors, including sulfite, are not utilized by this methanogen to oxidize methane, even in trace amounts. Interestingly, most methanogen species are extremely oxygen sensitive, being killed by even trace amounts of oxygen. However, two superoxide dismutases, a superoxide reductase and a catalase, were uncovered in the M. acetivorans genome, suggesting the potential for oxygen resistance (Galagan et al. 2002). The presence of a cytochrome d oxidase may even provide a link between oxygen and energy conservation by the organism (Galagan et al. 2002). We cultured M. acetivorans under a microaerophilic headspace (0.7% O2). Diffusional constraints likely lowered the percent of oxygen in the actual liquid growth medium, but M. acetivorans still demonstrated oxygen tolerance under microaerophilic conditions. The presence of oxygen had little effect on cell yields, methane production or trace methane oxidation in these cultures (Figure 3, Table 1), indicating that the oxygen reduction, which is likely occurring, cannot be coupled to methane oxidation. Research is now underway to more closely examine the responses of M. acetivorans to oxygen. We also tested the effect of including H2 in the culture headspace. Methanosarcina acetivorans is capable of growth and methanogenesis using a large array of substrates but does not use H2. Unlike the other methanogens tested, M. aceti-
Figure 3. Methane oxidation (± 2 SD) standardized to either the total amount of methane in the culture after growth (black bars) or the methane produced by the culture during growth (white bars) observed in experiments with varying species and substrates. Added concentrations: lactate, 13.4 mM; H2 (for all but M. acetivorans experiment), 0.24 MPa; H2 (M. acetivorans experiment), 0.16 MPa; Ac (acetate), 12.2 mM; SO2– 4 (for A. fulgidus),14.0 mM; SO2– (for A. pro4 fundus), 33.0 mM; SO2– 4 (for A. thermolithotrophicus), 21.1 mM; MeOH (methanol), 125 mM; O2, 0.7 kPa; TMA (trimethylamine), 100 mM; NO–3 , 6.59 mM; SO2– 4 (for M. acetivorans experiments), 21.1 mM; and SO2– 3 , 2 mM.
ARCHAEA ONLINE at http://archaea.ws
308
MORAN, HOUSE, FREEMAN AND FERRY
Table 1. Growth conditions and methane oxidation per culture experiment. Each culture was initially provided 1.79E–3 mol of methane. In addition, based on methanogenesis, stoichiometry and measurements performed in parallel experiments, the cultures produced 1.3E–3, 2.8E–3 and 5.5E–3 mol of methane for the cultures grown on H2 /CO2, methanol and trimethylamine (TMA), respectively. Species
Growth substrate
Media addition
Incubation Cell count temperature (°C) (ml – 1)
Experimental slope
Control slope
Methane oxidized (mol)
A. fulgidus A. lithotrophicus A. profundus Mb. thermoautotrophicum M. barkeri M. acetivorans M. acetivorans M. acetivorans M. acetivorans M. acetivorans M. acetivorans M. acetivorans M. acetivorans
Lactate H2, CO2 Acetate, H2 H2, CO2 H2, CO2 Methanol Methanol Methanol TMA TMA TMA TMA TMA
– – – – – – O2 SO 24 – – NO –3 H2 SO 24 – SO32 –
85 85 85 65 33.5 33.5 33.5 33.5 33.5 33.5 33.5 33.5 33.5
3.1E–5 9.7E–5 7.8E–6 6.1E– 4 1.8E–3 1.0E–3 7.9E– 4 1.1E–3 8.0E–3 7.2E–3 8.3E–3 8.5E–3 9.4E–3
1.7E–5 8.1E–5 –1.3E–5 2.8E–5 6.0E–6 4.7E–5 1.2E–5 4.9E–6 –8.6E–5 9.2E–5 7.0E–5 3.4E–5 –2.5E–5
4.7E–8 (± 1.7E–7) 3.8E–7 (± 1.6E–7) 5.2E–8 (± 2.3E–7) 6.3E–7 (± 5.9E–7) 2.0E–6 (± 5.7E–7) 2.0E–6 (± 8.5E–7) 1.6E–6 (± 3.2E–7) 2.3E–6 (± 2.6E–7) 2.0E–5 (± 3.0E–6) 1.7E–5 (± 1.4E–6) 2.0E–5 (± 1.9E–6) 2.0E–5 (± 7.6E–7) 2.3E–5 (± 2.7E–6)
1
2E+8 7E+7 1E+8 5E+7 n/a 1 5E+8 5E+8 4E+8 1E+9 9E+8 2E+9 5E+8 1E+9
Clumping of M. barkeri during growth prevented accurate cell counting for these cultures.
vorans lacks two essential hydrogenases required for methanogenic growth using hydrogen but does have other hydrogenases frequently associated with methanogenesis (Galagan et al. 2002). Hydrogen transfer between AOM consortia members may be essential for maintaining the low hydrogen concentrations required by thermodynamic constraints (Hoehler et al. 1994). In this experiment, however, the presence of hydrogen did not have a deleterious effect on the amount of methane oxidized (Figure 3, Table 1). Nauhaus et al. (2002) suggested that AOM depends on the transfer of electron carriers between consortia members. In this model, ANME-2 would donate electrons from methane to an oxidized electron carrier that is then passed to the bacterial sulfate-reducer. We used a simplified protocol to determine whether adding either NAD + or FAD, the oxidized forms of these carriers, to M. acetivorans cultures increased methane oxidation during growth. We incubated cultures with trimethylamine (TMA) as a growth substrate and also provided labeled methane (initial FCH4 estimated at 0.117) in media containing 0.1 mM NAD + or FAD. If these common electron carriers can be used by M. acetivorans during TMO we would have observed enhanced methane oxidation. Yet, when compared to the results shown in Table 1, neither NAD + nor FAD elevated methane oxidation in M. acetivorans above typical background values, suggesting the two electron carriers cannot be coupled to methane oxidation. We also examined M. acetivorans for trace methane oxidation when grown on two different substrates, methanol and TMA. More methane was oxidized when TMA, versus methanol, was the substrate for methanogensis. The reason for enhanced methane oxidation in cultures grown on TMA is at present unknown. One potential explanation involves enzymatic differences in the TMA and methanol pathways. Methylamine-based methanogenesis requires three distinct methyltransferase I isozymes specific for mono-, di- and trimethylamines, and only one of two isozymes of methyltrans-
ferase II. Methanogenesis from methanol uses only one methyltransferase I and one methyltransferase II, both specific for methanol (Ding et al. 2002). Enhanced TMO in cultures grown with TMA may result from enhanced expression of a methyltransferase involved in TMA metabolism or enhanced expression of a closely related homologue of such a methyltransferase. Alternatively, it is possible that methanol may be an end product of TMO. Nauhaus et al. (2002) explored sulfate reduction in marine AOM samples. They found that when methane was removed and replaced by methanol, sulfate reduction continued at approximately half the original rate. Microbial responses to methanol can be sensitive to concentration (for example, methanol becomes toxic at higher concentrations) and adjusting the methanol concentration used by Nauhuas et al. (2002) may optimize the reactions they observed, increasing sulfate reduction. The ability of consortia of sulfate-reducing bacteria to use methanol as a substrate at all suggests that methanol is an intermediate of AOM. The sulfate-reducing bacteria would be crucial for removing excess methanol, preventing its build up from making AOM energetically unfavorable. If a similar mechanism of methane oxidation occurred in our experiments, TMO might be hindered in cultures grown with methanol because high methanol concentrations could limit methane oxidation. Acknowledgments We thank Dr. Michael Arthur for the use of his mass spectrometer and Denny Walizer for invaluable technical assistance. Graduate support for this project was provided by the Penn State Biogeochemical Research Initiative for Education (BRIE) funded by NSF (IGERT) grant DGE-9972759. This work was also funded by the Penn State Astrobiology Research Center (through the National Astrobiology Institute), the National Science Foundation (MCB-0348492) and seed grants from the Center for Environmental Chemistry and Geochemistry and the Ettinger Foundation.
ARCHAEA VOLUME 1, 2005
TRACE METHANE OXIDATION IN EURYARCHAEOTA References Boetius, A., K. Ravenschlag, C.J. Schubert et al. 2000. A marine microbial consortium apparently mediating anaerobic oxidation of methane. Nature 407:623–626. Ding, Y.H., S.P. Zhang, J.F. Tomb and J.G. Ferry. 2002. Genomic and proteomic analyses reveal multiple homologs of genes encoding enzymes of the methanol:coenzyme M methyltransferase system that are differentially expressed in methanol- and acetate-grown Methanosarcina thermophila. FEMS Microbiol. Lett. 215: 127–132. Galagan, J.E., C. Nusbaum, A. Roy et al. 2002. The genome of M. acetivorans reveals extensive metabolic and physiological diversity. Genome Res. 12:532–542. Hallam, S.J., P.R. Girguis, C.M. Preston, P.M. Richardson and E.F. DeLong. 2003. Identification of methyl coenzyme M reductase A (mcrA) genes associated with methane-oxidizing archaea. Appl. Environ. Microbiol. 69:5483–5491. Hallam, S.J., N. Putnam, C.M. Preston, J.C. Detter, D. Rokhsar, P.M. Richardson and E.F. DeLong. 2004. Reverse methanogenesis: testing the hypothesis with environmental genomics. Science 305: 1457–1462. Harder, J. 1997. Anaerobic methane oxidation by bacteria employing 14 C-methane uncontaminated with 14C-carbon monoxide. Mar. Geol. 137:13–23. Hinrichs, K.U., J.M. Hayes, S.P. Sylva, P.G. Brewer and E.F. DeLong. 1999. Methane-consuming archaebacteria in marine sediments. Nature 398:802–805. Hinrichs, K.U., R.E. Summons, V. Orphan, S.P. Sylva and J.M. Hayes. 2000. Molecular and isotopic analysis of anaerobic methane-oxidizing communities in marine sediments. Org. Geochem. 31: 1685–1701. Hoehler, T.M. and M.J. Alperin. 1996. Anaerobic methane oxidation by methanogen-sulfate reducer consortium: geochemical evidence and biochemical considerations. In Microbial Growth on C1 Compounds. Eds. M.E. Lidstrom and F.R. Tabita. Kluwer Academic Publishers, Boston, pp 326–333. Hoehler, T.M., M.J. Alperin, D.B. Albert and C.S. Martens. 1994. Field and laboratory studies of methane oxidation in an anoxic marine sediment: evidence for a methanogen-sulfate reducer consortium. Global Biogeochem. Cycles 8:451–463. Klenk, H.P., R.A. Clayton, J.F. Tomb et al. 1998. The complete genome sequence of the hyperthermophilic, sulphate-reducing archaeon Archaeoglobus fulgidus. Nature 394:364 –370. Krüger, M., S. Shima, R. Thauer and F. Widdel. 2003a. Occurrence and activity of methanogenic enzymes in environmental samples dominated by ANME-1 archaea and their potential role in the anaerobic oxidation of methane. Am. Soc. Microbiol. 103rd General Meeting Abstracts, Washington, DC, p 414.
309
Krüger, M., A. Meyerdieks, F.O. Glöckner et al. 2003b. A conspicuous nickel protein in microbial mats that oxidize methane anaerobically. Nature 426:878–881. Michaelis, W., R. Seifert, K. Nauhaus et al. 2002. Microbial reefs in the Black Sea fueled by anaerobic oxidation of methane. Science 297:1013–1015. Nauhaus, K., A. Boetius, M. Krüger and F. Widdel. 2002. In vitro demonstration of anaerobic oxidation of methane coupled to sulphate reduction in sediment from a marine gas hydrate area. Environ. Microbiol. 4:296–305. Orphan, V.J., K.U. Hinrichs, W. Ussler, C.K. Paull, L.T. Taylor, S.P. Sylva, J.M. Hayes and E.F. DeLong. 2001a. Comparative analysis of methane-oxidizing archaea and sulfate-reducing bacteria in anoxic marine sediments. Appl. Environ. Microbiol. 67:1922–1934. Orphan, V.J., C.H. House, K.U. Hinrichs, K.D. McKeegan and E.F. DeLong. 2001b. Methane-consuming archaea revealed by directly coupled isotopic and phylogenetic analysis. Science 293: 484–487. Orphan, V.J., C.H. House, K.U. Hinrichs, K.D. McKeegan and E.F. DeLong. 2002. Multiple archaeal groups mediate methane oxidation in anoxic cold seep sediments. Proc. Natl. Acad. Sci. USA 99:7663–7668. Pancost, R.D., J.S. Sinninghe Damsté, S. de Lint, M.J.E.C. van der Maarel, J.C. Gottschal and the Medinaut Shipboard Scientific Party. 2000. Biomarker evidence for widespread anaerobic methane oxidation in Mediterranean sediments by a consortium of methanogenic archaea and bacteria. Appl. Environ. Microbiol. 66: 1126–1132. Stetter, K.O., G. Lauerer, M. Thomm and A. Neuner. 1987. Isolation of extremely thermophilic sulfate reducers: evidence for a novel branch of archaebacteria. Science 236:822–824. Stetter, K.O., R. Huber, E. Blöchl, M. Kurr, R.D. Eden, M. Fielder, H. Cash and I. Vance. 1993. Hyperthermophilic archaea are thriving in deep North Sea and Alaska oil reservoirs. Nature 365: 743–745. Valentine, D.L. and W.S. Reeburgh. 2000. New perspectives on anaerobic methane oxidation. Environ. Microbiol. 2:477– 484. Valentine, D.L., D.C. Blanton and W.S. Reeburgh. 2000. Hydrogen production by methanogens under low-hydrogen conditions. Arch. Microbiol. 174:415– 421. Wolin, E.A., M.J. Wolin and R.S. Wolfe. 1963. Formation of methane by bacterial extracts. J. Biol. Chem. 238:2882–2886. Zehnder, A.J.B. and T.D. Brock. 1979. Methane formation and methane oxidation by methanogenic bacteria. J. Bacteriol. 137:420– 432. Zehnder, A.J.B. and T.D. Brock. 1980. Anaerobic methane oxidation: occurrence and ecology. Appl. Environ. Microbiol. 39:194 –204.
ARCHAEA ONLINE at http://archaea.ws