1North Western Medical Physics, Christie Hospital NHS Trust, Manchester, United Kingdom, ... using samples taken from the tumour at the time of operation.
Tracer Kinetic Parameters Derived from Quantitative Dynamic Contrast-Enhanced MRI correlate with VEGF Expression in Head-and-Neck Tumours 1
S. B. Donaldson1,2, G. Betts3, S. C. Bonington4, C. M. West3, L. E. Kershaw2, and D. L. Buckley2,5 North Western Medical Physics, Christie Hospital NHS Trust, Manchester, United Kingdom, 2Imaging Science and Biomedical Engineering, University of Manchester, Manchester, United Kingdom, 3Academic Department of Radiation Oncology, University of Manchester, Manchester, United Kingdom, 4Department of Radiology, Christie Hospital NHS Trust, Manchester, United Kingdom, 5Division of Medical Physics, University of Leeds, Leeds, United Kingdom
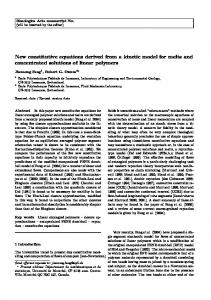
Introduction Dynamic contrast-enhanced (DCE-) MRI can be used to provide estimates of perfusion (Fb), microvessel permeability-surface area (PS), interstitial volume (ve) and blood volume (vb) in tumours using a two-compartment exchange model (2CXM)1. Tracer kinetic parameters have been shown to correlate with VEGF expression, an important initiator of angiogenesis in a variety of tumours, and angiogenesis is known to be a prognostic factor for treatment outcome2. Pre-treatment estimates of Fb and vb have been shown to differ in patients where treatment resulted in either local control or local failure3. The aim of this study was to present tracer kinetic parameter estimates in head-and-neck cancer and to correlate these with known predictors of patient outcome, including tumour volume, stage and VEGF expression. Materials and Methods Eight patients undergoing curative surgical resection for head-and-neck cancer were scanned prior to surgery. MRI studies were performed on a 1.5 T Philips Intera using either a SENSE head or head-and-neck coil. A transverse 3D T1-w FLASH sequence (TR/TE 3.6/0.95 ms, α = 30o, 128 x 128 x 20 matrix, 220 x 220 x 100 mm FOV, acquisition time 1.5 s for 7.5 mins) was used for the dynamic acquisition. An inversion-recovery turbo-FLASH sequence with 5 inversion times (TI = 65 – 3900 ms) was used to provide pre-contrast tumour T1 estimates. Individual arterial input functions (AIFs) were obtained from the carotid arteries. Whole tumour regions-of-interest (ROIs) were defined and concentration-time curves were analysed using a general 2CXM1 to obtain estimates of Fb, PS, ve, vb and plasma mean transit time (MTT). Tumour volumes were calculated using the number of pixels within the ROI multiplied by the voxel volume. VEGF mRNA expression was measured by quantitative real time polymerase chain reaction using samples taken from the tumour at the time of operation. A Pearson correlation was performed to examine the relationship between the tracer kinetic parameters, tumour volume and VEGF expression. Spearman correlations were performed to examine relationships with tumour stage. A oneway ANOVA test was applied to assess whether the tracer kinetic parameters varied with tumour site. Results The mean age of the patients was 62.5 (range 50.4 - 72.7) years. Tumours were classified as oral cavity (n=3), larynx (n=3) and hypopharynx (n=2) and were stage I (n=1), II (n=3), and IV (n=4). The mean tumour volume was 15.3 (range 0.6 – 44.5) cm3. The average pre-contrast T1 value for the tumours was 1005 ± 180 ms. Tracer kinetic parameters did not correlate significantly with any of the clinico-pathologic parameters. Table 1 shows values of tracer kinetic parameters obtained averaged over all 8 patients. They did not differ significantly between tumour sites. Estimates of VEGF expression were obtained for 7 tumours. There were significant correlations between VEGF expression and Fb (r = 0.78, p = 0.042) (Fig. 1a), ve (r = 0.90, p < 0.01) (Fig. 1b) and PS (r = 0.77, p = 0.044). Fb PS vb ve MTT ml/min/100ml ml/min/100ml ml/100ml ml/100ml s 43.0 ± 26.0 7.2 ± 5.5 15.6 ± 8.0 19.3 ± 15.5 19.5 ± 7.6 Table 1: Values of DCE-MRI parameters averaged over 8 patients. 8
8 r = 0.775 p = 0.042
6
r = 0.898 p < 0.01
7 VEGF expression
VEGF expression
7 5 4 3 2
6 5 4 3 2 1
1
0
0 0
20
40
60
80
0
10
20
30
40
50
ve (ml/100ml)
Fb (ml/min/100ml)
Figure 1: Correlation of a) Fb and b) ve with VEGF expression Discussion Tracer kinetic parameters of head-and-neck tumours calculated using DCE-MRI have been presented. Individual patient AIFs were obtained and high temporal resolution data was analysed using a 2CXM. MTT was shown to be high in these tumours – 19.5 s – and it has been shown that the 2CXM is more appropriate for analysis of such datasets than the Tofts models4. Our estimates agree well with those measured using PET5. Correlations with VEGF expression suggest that DCE-MRI estimates of Fb, ve and PS may be indicative of angiogenesis in these tumours. This is a small pilot study, however these results warrant further investigation. References: 1
Brix G, MRM (2004) 52:420-429; 2 Folkman J, Annual review of medicine (2006) 57: 1-18; 3 Cao Y, Int J Rad Onc Biol Phys (2008) 72:1287-1290; 4 Donaldson SB, MRM In press; 5 Komar G, J Nucl Med (2008) 49:1944-51
Proc. Intl. Soc. Mag. Reson. Med. 18 (2010)
4294