VAQAR LAYOUT
12/3/09
12:10 PM
Page 40
VEHICULAR WIRELESS NETWORKS
TRAFFIC PATTERN DETECTION IN A PARTIALLY DEPLOYED VEHICULAR AD HOC NETWORK OF VEHICLES SAYYID A. VAQAR AND OTMAN BASIR, UNIVERSITY OF WATERLOO
ABSTRACT
In this article the traffic information gathered by a node in an ad hoc network is viewed as a snapshot in time of the current traffic condition on the road segment. This snapshot is considered as a pattern in time of the current traffic conditions.
40
Knowledge about traffic conditions on the road play an important role in route planning and avoiding traffic jams. With recent developments in technology, it is possible for vehicles to be equipped with communication and GPS systems. Equipped vehicles on the road can act as nodes to form a vehicular ad hoc network. These nodes can collect information regarding traffic conditions such as position, speed, and direction from other participating nodes. Depending on the number of participating nodes in the ad hoc network, this collected information can provide useful information on driving conditions to the node collecting this information. With proper analysis this information can be used in detecting and/or predicting traffic jam conditions on freeways. In this article the traffic information gathered by a node in an ad hoc network is viewed as a snapshot in time of the current traffic conditions on the road segment. This snapshot is considered as a pattern in time of the current traffic conditions. The pattern is analyzed using pattern recognition techniques. A weight-of-evidence-based classification algorithm is presented to identify different road traffic conditions. The algorithm is tested using data generated by microscopic modeling of traffic flow for simulation of vehicle or node mobility in ad hoc networks. Test results are presented depicting different percentage levels of vehicles equipped with communication capability.
INTRODUCTION Highway traffic congestion is a common problem faced by motorists around the world. It causes unwanted delays and results in production losses to the amount of several billion dollars per year [1]. Availability of real-time traffic information is therefore crucial for motorists. In today’s world, although this kind of information is readily available through the Internet, radio networks, and other means, the accuracy, timeliness, and coverage of current systems are considered only
1536-1284/09/$25.00 © 2009 IEEE
marginal (ITS America 2000). Currently most traffic data is collected through embedded loop sensors and mounted video monitors. The data collected in this manner is for a limited section of the highway and requires significant infrastructure to be in place. Another method of collecting data is via mounted equipment on vehicles. Although the equipment itself can be sophisticated and expensive it has the advantage of requiring no fixed roadside infrastructure to function. Using such equipped vehicles as mobile traffic probes is subject to issues such as the number of probe vehicles on the road, type of data transmitted, and communication mechanism. Recently there has been significant interest in mobile ad hoc networks (MANETs) of vehicles for intelligent transportation systems (ITS). In MANET-based ITS the vehicles are able to communicate with each other and can share data regarding traffic flow conditions. The data communicated between the vehicles will depend on the number of vehicles equipped with MANET capability. But the ad hoc network will provide an effective means of communication between the vehicles without utilizing any infrastructure. The ability to communicate without infrastructure is important in providing communication capability anywhere on the road and thus possibly helping the drivers in becoming aware of the traffic road conditions in their pathway. The number of equipped vehicles will perceivably be very low in the early stages of deployment; thus, the performance of any traffic condition monitoring system has to be evaluated under low levels of equipped vehicles. The problem of identifying highway traffic conditions (jams, accidents, etc.) based on collected data can be viewed as a pattern recognition problem. In the literature several attempts have been made to analyze the traffic problem as a pattern recognition problem under different assumptions. In [2] the problem of network-level traffic detection has been addressed as a two-class problem for simulated data on the freeway. The data is collected from fixed
IEEE Wireless Communications • December 2009
VAQAR LAYOUT
12/3/09
12:10 PM
Page 41
sensors on specific collection points of the freeway and therefore suffers from the limitation of required infrastructure. In [3] a similar problem is presented with a wavelet energy approach applied to data collected from the FSP I-880 project. In [4] MANET-based traffic condition detection is presented, but the solution methodology is based on group formation with issues regarding leader and follower being resolved before any traffic conditions are considered. There have been many other attempts in the literature to address the problem of traffic condition detection [5, 6], but the solutions presented are specific for network communication protocol. This article presents the problem of identifying road traffic conditions in the context of a MANET of vehicles. The vehicles, acting as nodes in the ad hoc network, communicate with each other and gather information of interest from other nodes in the network. The collected information is analyzed locally by each node and is independent of the network communication protocol. By this approach each node or vehicle on the road can predict or detect the traffic condition in its direction of travel. The information gathered by each node can be viewed as a snapshot in time of the traffic condition. This snapshot of traffic flow is then analyzed using pattern recognition techniques to classify it into different classes such as free flow, pre-jam, or jammed. The formulation allows each vehicle equipped with MANET capability to view the current traffic condition ahead of it and recognize it as a pattern recognition problem. In pattern recognition problems weight of evidence has been used as a measure for classification, and it has the capability to take into account partial information [7]. This quality can be used along with some conflict resolution algorithm in order to predict classes in the case of limited data availability. In this article a weightof-evidence-based classification algorithm is presented, taking into account that the available data may contain only partial or incomplete information. The algorithm provides a systematic method of evaluating the ability of each feature to correctly predict a certain class. For a particular observation, only the features that satisfy certain criteria are allowed to participate in predicting the class of the data set. This mechanism is particularly useful in the case of limited data availability as it bars the features with low weight of evidence from the voting mechanism for classification. One such case of limited data availability will be the early stages of deployment of MANET capability vehicles on the road where the snapshot of traffic will only represent a partial pattern for identification purposes. The proposed weight-of-evidence-based classification scheme will utilize this ability of handling partial information and provide an effective method of traffic condition detection when only limited data is available. The proposed algorithm is tested under a simulation model for microscopic modeling of traffic flow [4, 8]. This model closely resembles other well-known models and is based on the fact that, in general, on any freeway vehicles
IEEE Wireless Communications • December 2009
move without colliding, and their movement is mainly characterized by the parameters describing typical acceleration and deceleration capabilities of vehicles. The model primarily focuses on traffic jam situations and hence is a natural choice for this work. The feature vectors of the data will be very high-dimensional because the data collected from mobile nodes (vehicles) is time- and space-dependent. Weight of evidence between features and classes is calculated based on sample data and tested on testing data sets. In an ideal setting all the vehicles on the road will be equipped, and the node or vehicle of interest can view the current traffic conditions with all the data points available. This assumption may not be true in the early stages of deployment of MANETs. Therefore, several data sets reflecting the different levels of MANET deployment on the freeways are generated, including in particular cases of full, partial and scarce deployment. This article is organized as follows. We present the traffic detection problem formulation as a pattern recognition problem. We also presentthe basis of using weight of evidence in classification and outline the proposed algorithm in detail. We describe the simulation model used in detecting the traffic jam conditions. We also provide some details of microscopic traffic model and give an analysis of the generated data. Results of simulation are discussed, and then we conclude this article.
The problem of traffic condition monitoring helps form the basis for the application of MANETs in vehicular transportation system. Apart from the issues involved in communication protocols for ad hoc network of vehicles, this problem can be considered as a pattern recognition problem.
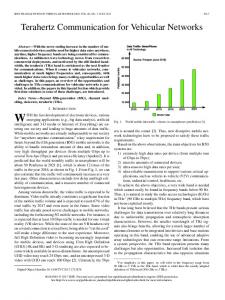
PATTERN RECOGNITION FORMULATION The problem of traffic condition monitoring helps form the basis for the application of MANETs in vehicular transportation systems. Apart from the issues involved in communication protocols for ad hoc networks of vehicles, this problem can be considered as a pattern recognition problem. In ad hoc networks of vehicles, the vehicles communicate with each other and can gather information regarding traffic conditions of the individual participating nodes in the ad hoc network. This traffic information as gathered by any individual node can be arranged as a pattern of traffic flow condition around the node in real time. From the point of view of that particular node the pattern may now be classified into traffic condition classes, such as free flow or jam, by utilizing proper pattern recognition techniques . To demonstrate the idea we restrict our traffic flow to single-direction traffic on a freeway. Since MANETs have the capability to communicate within a certain range with each other, the node of interest is the most recent node joining the group. Two different scenarios representing snapshots of the traffic flow as seen by the node of interest are shown in Fig. 1. Figure 1a represents the free flow condition, and Fig. 1b represents a jam condition on the highway. Figure 1 thus represents two different patterns in time of the traffic flow on the highway. For the sake of demonstration it is assumed that a node has an area of interest of 2 km. We analyze the problem from the point of view of the node most recently joining the
41
VAQAR LAYOUT
0
12/3/09
200
400
12:10 PM
600
Page 42
800 1000 1200 x-position (m)
1400
1600
1800
2000
W (Y = yi / Y ≠ yi | X) Pr (X,Y = Yi ).(1− Pr (Y = yi )) . = log Pr (Y = yi ).(Pr (X) − Pr (X,Y = yi )) (3)
(a)
0
200
400
600
800 1000 1200 x-position (m)
1400
1600
1800
2000
(b)
Figure 1. Snapshot of traffic on a single lane highway: a) free flow; b) traffic jam.
The numeric value of weight of evidence can be positive, zero, or negative. A positive value will indicate X providing positive evidence for Y belonging to y i, whereas a zero value will show no information provided on selecting a class. A negative value, on the other hand, indicates that there is evidence against Y taking on the class yi; it might as well belong to some other subset of Y.
CLASSIFICATION ALGORITHM snapshot. This node of interest can collect data over time from each participating node using one-hop or multihop communication. The data collected from each node consists of the identification of the vehicle, speed of the vehicle, its current position with respect to the node of interest, and its own state. The state of every participating node can be classified in one of the three possible conditions: free flow, pre-jam connected, and jammed. The data is collected by MANET equipped vehicles, and it is possible that not all vehicles are equipped. Therefore, the data generated for different levels of MANET equipped vehicles will reflect the real-life situation of sparse equipped vehicles in the early stages of deployment. In the presence of patterns with incomplete or sparse data, the classification of patterns becomes a difficult task. Weight of evidence has the capability of dealing with partial information and is therefore chosen as the preferred technique for pattern classification of traffic conditions. —
WEIGHT OF EVIDENCE
Let (X , Y) be jointly distributed — random variables with q-dimensional vector X denoting a feature vector and Y denoting the attribute whose value is to be determined. The missingvalue problem here is to find a decision rule d(.) that maps R q into the domain of Y such that certain properties of the data set —are preserved. We call the feature vector X a new observation and Y its class label or predicting attribute. Given Xj the weight of evidence in favor of Y = y i as opposed to Y ≠ y i can be calculated as the difference of mutual information between the two possibilities [7]. If we represent weight of evidence by W and mutual information by I, we may write W (Y = yi/Y = ≠ yi | X) = I(Y = yi : X) – I(Y ≠ yi : X).
(1)
The mutual information is given by I (Y = yi : X) = log
Pr (Y = yi | X) . Pr (Y = yi )
(2)
The weight of evidence can now be rewritten as
42
The weights of evidence as provided by features for the possible classes can take on either positive, zero or negative values. Depending on the weights of evidence provided by features for all classes, a decision has to be made in favor of a particular class. We present a classification algorithm based on voting strategy for comparing weights of evidence as given by each feature for every class. Algorithm: • Step 1: Given Vector X with m features. x i ∈ X, i = 1 ··· m represents m features collected from participating nodes. • Step 2: Calculate weight of evidence wij ∈ Wm × n from m features for n classes. (Here n = 3, representing the three traffic condition classes.) • Step 3: Find Wm × 1, where w–i is a vote by feature for a particular class. w–i = max(wij) ∀ j = – 1 ··· n and w i ≥ wcutoff. — • Step 4: If ∃ j, k | wij = wik = w–i ∈ W, feature i is not allowed to vote. • Step 5: If w– i ≤ 0, feature i is not allowed to vote. • Step 6: Count number of votes for each class. – – ∀ i = ··· n, votei = Σm j=1 wj | wj = yi, where yi = i. Y = yk, where k = index(max(votei)), will represent the winning class. w cutoff is a minimal value chosen to prevent features with small numeric value of weight of evidence from taking part in the voting process.
SIMULATION SETUP To set up and simulate the problem of identifying the traffic conditions in MANET equipped vehicles we have to go through the following steps: 1 Generate and classify microscopic traffic data by simulation for training and testing sets. The training sets are labeled into classes: free flow, connected (toward jam), and jammed. 2 Use the training data set to generate probabilities required for calculating weights of evidence. 3 Classify the test data set using a weight of evidence classifier. To realize this problem, we need to generate realistic traffic flow data. There are two kinds of traffic flow models available in the literature, macroscopic and microscopic. Macroscopic models consider the dynamics of vehicle density and average velocity. For our case we need a simple
IEEE Wireless Communications • December 2009
VAQAR LAYOUT
12/3/09
12:10 PM
Page 43
model that is capable of exhibiting enough features such that a traffic jam condition is recognizable; also, the model should allow for the vehicle to be simulated as a single entity. One such microscopic model is presented by Krauss in [8]. The main features of the model are briefly given below.
THE KRAUSS MODEL
gap − vl ⋅τ τb + τ
with
τb =
Follower vf Length
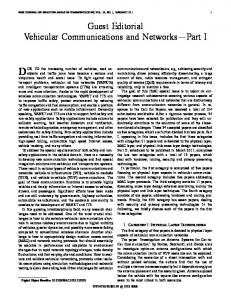
The Krauss model defines a vehicle at any time step as consisting of four parameters and four update rules. The parameters are the maximum velocity vmax, maximum acceleration a, maximum deceleration b, and the amount of noise ε that introduces stochastic behavior to the model. The time is discrete and ticks with an interval t = 1 s. However, the spatial values of positions are continuous. Figure 2 depicts the model parameters. The rules of the model describe how the vehicle chooses a velocity and applies it to reach a new position in the next time step. The rules mirror three observations of human driving behavior: 1 Drivers want to reach their goal as fast as possible. 2 They do not want to collide with other vehicles. 3 The human perception of speed and distance is inaccurate. A noise term captures the latter and reduces the optimal velocity by a random value. The reaction time of the driver is set to τ = 1 s. The update rules for the vehicle are vsafe = vl +
Gap
vl + v f 2.b
vdesired = min[vmax, vf + a.Δt, vsafe] v(t + Δt) = max[0, vdesired ε.a.Δt.random()] x(t + Δt) = x(t) + v(t + Δt).Δt,
(4) (5) (6) (7)
where x is the distance, v l is the velocity of the leader, vf is the velocity of the follower, and gap is the gap between the leader and the follower. a is the maximum acceleration, b is the maximum deceleration, and eps is the influence of noise. A stopped vehicle is seen as a jammed vehicle in this model. A vehicle connected to a jammed vehicle and traveling at a velocity below a lower threshold, v JIn , is also seen as jammed. A previously jammed vehicle only escapes the jam if it is not connected to the preceding vehicle and travels at a velocity above an upper threshold v JOut . A vehicle is called connected to its leader if it has to adjust its velocity because of the small gap between them. In terms of the model, the vehicle is connected if the minimum in rule 2 is vsafe. In compliance we set the lower threshold to 50 percent of the maximum speed. The upper threshold for escaping the jam is set to 70 percent of the maximum speed. The microscopic traffic model is applied to a highway scenario. Figure 1 gives an overview of the road model. For more than one lane, the model requires lane changes to capture the influence of the traffic in a neighboring lane.
IEEE Wireless Communications • December 2009
Leader vl Direction
Figure 2. Traffic model parameters.
Vehicular ad hoc network
Local application
Vehicle mobility
Figure 3. Simulation system overview.
We restrict our implementation to unidirectional flow with no lane changes to keep the model at a simple level because the main scope of this work is to focus on traffic pattern detection rather than traffic models. Other parameters of the road model are total length, the width of a lane and the number of lanes per driving direction. We again set the number of lanes per driving direction to one because the extension of the traffic model to multilane traffic is not trivial. Next we describe in detail the simulation setup for generating the data set for this problem and some preliminary analysis of data to highlight the problem’s underlying complexity.
SIMULATION ENVIRONMENT The simulation environment consists of three logical components as shown in Fig. 3. The vehicle mobility component depicts the periodic computation of new position within a confined geographic space of the mobile vehicles. This component may be implemented by a Krauss traffic simulator. The vehicular ad hoc network constitutes the second component and is dedicated to imitating the full functionality of a real wireless network with all its complex effects of mobile communications. Only some of the vehicles defined by the traffic simulator will participate in the ad hoc network, mimicking the partial deployment stage of VANETs on the road. The other vehicles play a certain role for traffic considerations, but are considered as unequipped and hence do not participate in the ad hoc network communication. The third and last component is the local application, which accounts for controlling the whole simulation environment. The local application operates in the same manner for all vehicles: it evaluates received messages, and is able to generate new messages and broadcast them via the network. The
43
VAQAR LAYOUT
12/3/09
12:10 PM
Page 44
2500
1500
2000 Second principal component
Second principal component
1000
500
0
–500
1500 1000 500 0 –500 –1000 –1500
–1000 –2000
–1000
0
1000
2000
3000
4000
–2000 –3000 –2000 –1000
0
1000
2000
3000
First principal component
First principal component
(a)
(b)
4000
5000 6000
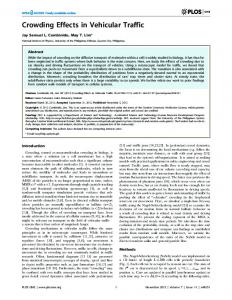
Figure 4. 2-D data representation of three classes of traffic condition in: a) 100 percent and b) 40 percent MANET equipped scenario. = free Flow, × = connected, ∇ = jam.
application relies on up-to-date information about current vehicle positions, which are provided by the vehicle mobility module. This simplifies implementation work, since communication links are only necessary between two simulators. The simulation environment consists of both a network simulator and a traffic simulator. The network simulator acts as a client requesting information from the traffic simulator. The traffic simulator, on the other hand, acts as a server and sends all the requested information to the network simulator. Without loss of generality it is assumed that all the participating vehicles are identified by a unique identification number and are equipped with wireless communication equipment of identical capability. The nodes are also equipped with GPS systems through which they are aware of their own physical location at all times. Also the discourse vehicles are located in a specified geographic area in the same plane, but not necessarily within one-hop communication range. For the scope of this work we also assume that there are no communication packet losses such as under conditions of network congestion and network fragmentation.
DATA GENERATION AND ANALYSIS The mobility data for this simulation problem is generated by implementing the Krauss model in MATLAB. The data is generated in steps of 30 s periods, and is divided into training and testing sets with a ratio of 3:1. The training data is labeled to represent one of the possible three classes (free flow, towar jam, and jammed traffic scenarios). Each row of the data set collected represents all the vehicles that are present in the 2 km range. Since the number of available nodes in this stretch of the highway is not known, we limit our nodes to 50, which is the approximate maxi-
44
mum number of vehicles possible in the 2 km stretch of the highway under the Krauss model vehicle density assumption. The data collected from each node includes the vehicle ID, its current speed, and its distance from the node of interest. For every simulation run we select a period of 30 s to collect the data. This time limit is under the assumption that a node traveling at maximum allowed speed will traverse the distance of 2 km in this time limit. To incorporate the situation representing sparse equipped MANET vehicles, the data set is modified by including the effect of missing nodes (unequipped vehicles). To achieve this we generate the data through the Krauss model, and then for every time snapshot we select at random the allowed number of equipped cars from the complete set. We do this to represent different levels of MANET deployment such as 60, 40, and 20 percent. A minimum of 20 percent deployment has to be chosen because of the limitation of the Krauss model. As mentioned earlier, within the area of interest of 2 km the maximum number of vehicles is 50; combined with the limitation of 250 m range of radio communication, the minimum number of vehicles required to maintain multihop communication under controlled conditions is greater than 8; hence, the 20 percent minimum deployment restriction for this simulation setup. Each data point in the data set generated by the simulation runs of the Krauss model has the dimension of 150 and belongs to one of the three classes. We use principal component analysis (PCA) to gain some insight about separability of the three classes. One of the advantages of PCA is that by reducing the dimension, it can help in visualizing the data. Since more than 2D data is hard to visualize, we take the first two most significant components obtained by PCA to graphically visualize the data set. Figure 4 shows the class separability of data.
IEEE Wireless Communications • December 2009
VAQAR LAYOUT
12/3/09
12:10 PM
Page 45
Figure 4a shows the class separability of data under the assumption of 100 percent MANET equipped vehicles, Fig. 4b of just 40 percent MANET equipped vehicles. As seen in comparison the problem of pattern identification becomes more complex as the sparse data set makes classification more difficult. This becomes more apparent as we further reduce the level of equipped vehicles to 20 percent.
The results of simulation are presented in Fig. 5. The proposed algorithm is used to predict traffic conditions under different scenarios. Specifically we test levels of 20, 40, 60, and 100 percent of MANET equipped vehicle deployment on highways. The probabilities required to calculate weights of evidence are derived from the training data set. The training data is composed of 270 events with 150 features and 3 classes. We assume the probability of each class to be equally likely. The testing data set is used to classify the traffic jam condition based on the weight-of-evidence-based classifier. The testing data set is composed of 90 events comprising 30 instances of each class. Table 1 summarizes the results obtained by the voting algorithm on the traffic condition detection problem under different levels of MANET deployment. A few conclusions can be drawn from the table. The training error and testing error increase consistently with the decrease in percentage level of MANET equipped vehicles. This is no surprise as it was expected based on the data analysis done by PCA. The visual inspection of the first two principal components showed that as the level of equipped vehicles decreases, the classes overlap more and more. More specifically, as shown in Fig. 5, class 2 errors increase with a decreasing number of MANET equipped vehicles. Class 2 is the pre-jam condition, and is more difficult to predict than the free flow and jammed conditions.
CONCLUSION The problem of traffic flow condition detection has been presented as a pattern recognition problem under a mobile ad hoc network of vehicles. The traffic pattern is analyzed by individual nodes or vehicles and is independent of any infrastructure requirement. The nodes can communicate using any communication protocol to collect the required information for pattern formation. The traffic flow condition is then detected locally by each node using the proposed weight-of-evidence-based classification algorithm. Information-theory-based weight of evidence is used to classify the test data sets. It is shown that the vehicles in a mobile ad hoc network can indeed view traffic conditions as a pattern recognition problem. The proposed algorithm also works under a scarce data availability scenario such as thate of initial deployment of MANETs on the roads. The
IEEE Wireless Communications • December 2009
Solid line: Target class : 20% deployment : 40% deployment : 60% deployment
3.5
3
2.5 Class
RESULTS AND DISCUSSION
4
2 1.5
1 0.5 0 0
50
100
150
200
250
Data instance
Figure 5. Classifier outputs.
MANET level
Training error
Class 1 error
Class 2 error
Class 3 error
100%
5.5%
0
5.6%
0
60%
8.9%
0
15.5%
0
40%
9.8%
0
16.2%
0.3%
20%
14.3%
0.3%
17.0%
0
Table 1. Result summary.
probability of error in detecting traffic jams will decrease with the rising percentage of equipped vehicles. MANETs are going to be deployed in the transportation industry; it is only a matter of time. Much work has to be done before they can effectively be used in vehicle traffic prediction scenarios. We have only demonstrated one possible approach to solving this problem, but we have made several simplifying assumptions. Future work on traffic pattern detection can continue in two directions. First, we intend to test the algorithm under a more realistic multilane traffic simulator. Second, we want to investigate the effects of network communication limitations such as congestion and network fragmentation scenarios. Another possible direction for future research can be to investigate the voting mechanism to include a relative confidence measure among competing features.
ACKNOWLEDGMENT This research has been supported by the Natural Science and Engineering Research Council (NSERC) and Pattern Analysis and Machine Intelligence (PAMI) Laboratory, University of Waterloo.
45
VAQAR LAYOUT
12/3/09
12:10 PM
Page 46
REFERENCES [1] D. Schrenk and T. Lomax, The 1999 Annual Mobility Report, College Station, Texas A & M Univ., 2000. [2] J. Ren et al., “Research on Network-Level Traffic Pattern Recognition,” IEEE 5th Int’l. Conf. ITS, Sept. 2002, pp. 500–04. [3] A. Karim and H. Adeli, “Incident Detection Algorithm Using Wavelet Energy Representation of Traffic Patterns,” J. Transportation Eng., vol. 128, 2002, pp. 232–42. [4] L. Briesemeister and G. Hommel, “Overcoming Fragmentation in Mobile Ad Hoc Networks,” J. Commun. and Networks, vol. 2, 2000, pp. 182–87. [5] J. Blum, A. Eskandarian, and L. Hoffman, “Mobility Management in IVC Networks,” Proc. IEEE Intelligent Vehicles Symp., 2003, pp. 150–55. [6] I. Chisalita and N. Shahmehri, “A Peer-to-Peer Approach to Vehicular Communication for the Support of Traffic Safety Applications,” IEEE 5th Int’l. Conf. Intelligent Transportation Systems, 2002, pp. 336–41. [7] Y. Wang and A. K. C. Wong, “From Association to Classification: Inference Using Weight of Evidence,” IEEE Trans. Knowledge and Data Engineering, vol. 15, 2003, pp. 764–67.
46
[8] S. Krauss, Microscopic Modeling of Traffic Flow: Investigation of Collision Free Vehicle Dynamics, Univ. zu Koln, Dept. of Mathematics, 1998.
BIOGRAPHIES S AYYID A NAS V AQAR (
[email protected]) is currently working toward a Ph.D. degree with the Department of Electrical and Computer Engineering, University of Waterloo. He got his M.Sc. degree in systems engineering from KFUPM, Dhahran, Saudi Arabia. His research interests include wireless communication protocols, mobile networks and ad hoc vehicular networks. OTMAN BASIR (
[email protected]) holds a Ph.D. degree in systems design engineering from the University of Waterloo, Canada, an M.Sc. degree in electrical engineering from Queens University, Kingston, Canada, and a B.Sc. degree in computer engineering from al-Fateh University, Libya. He is currently an associate professor with the Department of Electrical and Computer Engineering, University of Waterloo. He is the associate director of the Pattern Analysis and Machine Intelligence Laboratory. His research interests include ITS, embedded real-time systems, sensor networks, sensor and decision fusion, and biologically inspired intelligence.
IEEE Wireless Communications • December 2009