Transforming GML to Presentation Languages by Extending XSLT
Recommend Documents
Jan 29, 2014 - thods for this approach. The initial method is Java applet. A Java applet is a small program written in Java which runs on the client. Java applets ...
new Web vector graphics standard, Scalable Vector Graphics. (W3C, 2003) (Lehto .... figure also contains a graphic illustration of the transformation procedure to.
How XML documents may be rendered in browsers. ▫ How the XSLT language
transforms XML d t documents. ▫ How XPath is used in XSLT. 2. An Introduction to
...
Apr 14, 2003 - The PHP calls within the XML documents render this dynamism. Enabling an XSLT processor to process instructions in PHP combines the ...
D.2.2 [Software Engineering]: Design Tools and Tech- niques. General Terms. Design, Languages, Management. Keywords service and system modelling; ...
In a tagged value, the name is referred to as the tag. Certain tags .... Transform each operation on the UX screen into
Our visual language is referred to as the User-Experience (UX) Modeling Language. It is defined by a UML ..... programmi
Dec 6, 2011 - of Complex Objects using Answer-Set Programming. Johannes ... can be automatically generated using available ASP solver technology.
Extending XSLT with Java and C#. The world is not perfect. ... unique to Stylus
Studio. In the following screenshot we see the execution suspended inside the.
Russian secret services (FSB) and probably approved by .... the computer network of the German parliament in .... the Fe
with a declarative formalism that has a satisfactory degree of expressive power; ... to create expert system applications in a particular programming language.
Machines take their inputs from trays and put their results in conveyors. Users collect fallen ..... Vallecillo, A.: A journey through the secret life of models. In: Model ...
Abstract. Domain specific languages (DSLs) play a cornerstone role in. Model-Driven Software Development for representing models and meta- models.
automated generation of data flow in semantic Web service composition. By considering .... 1 ZipCode. â ⥠1 EMail. Figure 1. Part of the domain ALN ontology.
Jul 12, 2015 - modeling business, organizations and enterprise processes. In France, they ..... global and structured vision of informatics applications trough a ... fonctionnelle,â Master 2, Dept., Pau and the Countries of the. Adour Univ., Pau ..
In (Entriken 2001), two additional syntactical items for modelling languages are presented, namely a random construct for the definition of random parameters, ...
XSLT-Examples. Page 2 / 5. The basic thing about XSLT is that a XML document
can be processed with an XSLT. (Extensible Stylesheet Language ...
What is XSLT? • An XML-based style sheet language for XML documents. – Tells
web browser how to display data. – Similar to CSS for HTML, but with absolute ...
PDF (paper-print), VoiceXML (aural presentations), SVG (graphics), HTML (
browsing). This is an em example para. HTML formatting. This is an example.
Example i p html head body title. Output tree structure ..... XSL Tutorial at
W3Schools.
This paper presents a UML Profile for Web applications. It is a UML extension based on the general extension mechanisms provided by the UML that defines ...
3003 Summit Boulevard, Atlanta, GA 30319 www.nealford.com www.
thoughtworks.com memeagora.blogspot.com. “design patterns” in dynamic
languages ...
of management, the top 3 business school of Asia Pacific. Diselenggarakan oleh : ... published by Pearson Education and
The XSLT processing model is described in Section 5.1, Processing Model, of the
XSLT specification. This section states: A list of source nodes is processed to ...
Business Uses XSLT Because XML is Everywhere. ..... C A computer program. C Transformation .... C Part of the XML family
Transforming GML to Presentation Languages by Extending XSLT
Jan 29, 2014 - to convert GML to a presentation language like SVG or ... GML by converting it to SVG by XSLT. ... dards such as CSS, XSLT, XLink, XPointer;.
Journal of Geographic Information System, 2014, 6, 59-69 Published Online February 2014 (http://www.scirp.org/journal/jgis) http://dx.doi.org/10.4236/jgis.2014.61007
ABSTRACT Diversity of practices and methods in all fields is the basis of emerging standards in different areas. World Wide Web Consortium (W3C) has standardized eXtensible Markup Language (XML) as a very convenient tool to structure data for numerous purposes. OGC standardized Geography Markup Language (GML), which is an XML-based language, to store and transport geospatial data. Despite the fact that it is a medium to separate georeferenced data from presentation, GML by itself is not intended to visualize geo-referenced data. One of the solutions to visualize GML is to use eXtensible Style sheet Language Transformation (XSLT) as transformer to a visualization language such as Scalable Vector Graphic (SVG). Unlike the usual procedure, the major advantage of the proposed approach is that the transformation process is shifted to the client-side. XSLT as a median language is a general-purpose transformation tool. As it is not specialized for map cartography, map making process is very complicated using this primitive language. To facilitate transformation process, in this research, XSLT is extended to meet cartography requirements. Furthermore, a graphical user interface (XCartoT) is designed to set all the map properties interactively. XCartoT provides a user-friendly interface for cartographers to automatically generate necessary XSL files for their intended maps. The goal of this research is to develop a major step towards the geospatial Web.
KEYWORDS Technology; Preference for Quality; Volume of Trade; Vertical Intra-Industry Trade
1. Introduction The tendency towards geospatial services is incessantly growing among people from all different walks of life and becoming a non-detachable part of everyday life. People do not need high skills to use an online map whenever they enter a city for the first time. Furthermore, spatial mobile and Web services have raised the expectation of people. Thus, developing services to fulfill the requirements of all sorts of people from different background is an inevitable requirement that should be taken into account by geospatial specialists. Based on high interest of the public to geospatial services, many specialists, organizations and institutes have developed various methods, practices, software, data formats, Web services, etc. in different fields of geospaOPEN ACCESS
tial sciences. To prevent this diversity leading to confusion, standards play a pivotal role. The most dominant standardization organizations and consortiums in the field of geospatial Web services are International Organization of Standardization (ISO), World Wide Web Consortium (W3C) and Open Geospatial Consortium (OGC). On the other hand, Web has undergone many revolutions compared to the existing one. The latest revolution was introduction of “Web 2.0” as a new concept. Web 2.0 is associated with concepts such as data/information sharing, interoperability, user-centered design and collaboration. Prior to this revolution, users were limited to use the available content, whereas Web 2.0 sites allowed the users to interact and collaborate in social networks with user-generated content. JGIS
60
S. H. PAZOKY, F. HAKIMPOUR
On this account, previously known standards such as GML became more popular. GML is designed to transport and store geo-referenced data [1]. It separates content from graphic presentation and does not contain any information on how to visualize geo-referenced data. Therefore, GML is not directly suitable for applications that need visualization. Hence, it should be converted to other forms based on the usage such as graphical visualization, plain text or verbal output [2]. All the aforementioned possibilities can be implemented. However, graphical visualization is the most prominent way of communication. Geospatial science is meant to show the spatial relationships between natural features. Therefore, it is obvious that a graphical map is far more useful than a textual or verbal one. GML can be visualized using certain libraries like Open Layers, certain GML viewer software, using XSLT to convert GML to a presentation language like SVG or X3D, etc. The focus of this research is on visualization of GML by converting it to SVG by XSLT. XSLT is used as the transformer of GML to SVG. Scalable Vector Graphics, a W3C recommendation since 2001, is a markup language for describing two-dimensional graphics applications and images, and a set of related graphics script interfaces. SVG is an XML-based language and describes vector graphic both statically and dynamically. As stated and discussed comprehensively in Peng & Zhang [3], the future of Web maps depends on SVG, GML and WFS. SVG has many features that make it the best choice for Web-maps including [4-7]: An open standard compatible with other Web standards such as CSS, XSLT, XLink, XPointer; Providing rich graphical visualization features such as scalability, vector display, animation, interactivity, transparency, graphic filter effects and special visual effects such as shadows, lighting effects and easy editing; Facilitating fast response time for interactive query requests; Providing efficient data interoperability over the networks; Supporting small wireless devices; Search ability. SVG and GML are two complementary languages which are highly compatible and can work in synergy. Since GML plays a major role in geospatial Web, SVG is currently the most promising format for vector graphics display on the Internet [7,8]. Although this transformation is implemented several times, the research has improved it in the following ways: The transformation process is completely shifted to client-side. OPEN ACCESS
XSLT is a general-purpose tool to reorganize XML files andit does not have any special feature for mapmaking [9]. Imagine a cartographer intends to draw a legend for the map. Working with this primitive tool is more like drawing with a vector drawing software such as Auto Cad with the difference that user should write some lines of codes instead of drawing with drawing tools! In this research, XSLT is extended to meet map making requirements of a cartographer to convert GML to SVG. It is worth noting that the research is not to produce a GML viewer, but an advanced tool for a cartographer to convert GML to SVG. Since writing code in a somehow strange language like XSLT may be bothersome for non-specialists, a graphical user interface called XCartoT is designed and implemented to facilitate map making process for different classes of users. Using XCartoT, cartographers can set all the specifications of their desired map. XCartoT then generates XSLT file using extended functions. Choosing the GML file as the output, the transformation process is run and the resultant map in SVG format is displayed both textually and graphically. Geospatial Web is a new term, emphasizing geo-referenced data anywhere and anytime. Mobile devices and the Internet are the major devices to accomplish this goal [10]. Therefore, the ultimate goal of this paper is to illustrate the essentiality for standardization organizations and institutes to force Web browsers to provide users with embedded capabilities to visualize geo-referenced data on the browsers both on computers and mobile devices.
2. Automatic Web Cartography One of the major problems cartographers are facing today is the enormous amount of raw data. Thus, it is impossible to spend a long time working on every single sheet to produce a well-designed map. On the other hand, people are less likely to buy papermaps. The change in people’s attitude from papermaps to digital maps is somehow a revolution.Development of telecommunication infrastructure such as wireless communication networks, spatial positioning methods such as Global Positioning Systems (GPS), radio frequency identification (RFID), gyroscope, mobile computing systems such as PDAs, tablets and smart phones has been the motive of this revolution [2]. Along with many other applications provided via telecommunication infrastructures and devices, people expect much more from maps, including availability and applicability in various devices anywhere and anytime. According to the definition of ubiquitous cartography, maps can be created and used anywhere and anytime. Hence, it is not possible to have highly-skilled JGIS
S. H. PAZOKY, F. HAKIMPOUR
crafts people spend long hours to produce general purpose maps, using traditional drawing methods like painting by hand [2]. Means of ubiquity are automatic and Web cartography which are discussed in the next section.
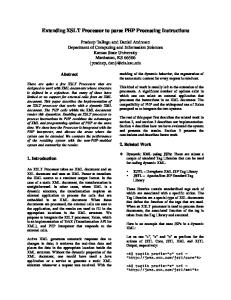
Automatic Web Cartography Techniques Apart from technical issues, all Internet GIS services can be divided into two distinct categories based on the type of data used. The initial category of services uses cartographic data servers, while the other uses geodata servers. Every Internet GIS service is constituted from data, logic and presentation elements [11]. The first category use data from a cartographic center, instead of raw geodata. Using this method, geodata is gathered, the map features are selected and designed to form a seamless and tiled map. Map providing procedure starts with a request from a user. Then, the raster tiles related to the request are searched and found in the cartographic database and sent to the user. Therefore, there is no logic behind these types of services. Although the method is very secure and lightens the workload of the client; it has also some serious disadvantages. The first disadvantage is that the response time may grow very much due to heavy load on the server. The second one is that the method needs high network bandwidth because the data transmitted via the network is usually very bulky. The architecture can only be implemented using server-side approach and is shown in Figure 1(a). On the other hand, there are some other services that have direct access to geodata. Instead of previouslyprepared raster tiles, the map is generated from raw geodata based on cartographic instructions provided by a
(a)
61
specialist. These methods should be categorized into server-side and client-side approaches. Server-side approaches have been implemented by two distinct technologies. The first technology is Common Gateway Interface (CGI) which is an interface for running external programs, software or gateways independent from platform. The most important bottleneck of this method is that if several CGI programs are operating simultaneously, it places considerable workload on the server. In addition, whenever a client makes any change to inputs, the CGI program starts a new process thread, consuming considerable computer resources [12]. The CGI-based approach is thus not a suitable method for map visualization on the Web [7]. Map Server is a software package that uses this approach. There are some codes for map presentation in the server-side. When the user sends a request, the map is generated and sent to the user as images [13,14]. Another server-side approach is using Java Servlets which is a program that runs on a Web server. Servlet usually works much faster than CGI, since it stays resident in memory when running. Another advantage of Java Servlets is its portability between operating systems and also servers [7,13]. The architecture of server-side methods is shown in Figure 1(b). The other alternative is to transfer some of the responsibilities of server to the client. There are two major methods for this approach. The initial method is Java applet. A Java applet is a small program written in Java which runs on the client. Java applets are platform independent similar to Java Servlet. Running on the client side, developers can design user-friendly and interactive interfaces using Java
(b)
Figure 1. How server-side Internet GIS services using (a) Cartographic database; (b) Geodatabase work.
OPEN ACCESS
JGIS
62
S. H. PAZOKY, F. HAKIMPOUR
applets. However, if the program and also the data are large, applet may overload the client and even paralyze the client machine [7]. Another solution is using plug-ins to install in client-side and add functionalities to the client’s Web browser. Unlike Java products mentioned previously, plug-ins are browser and platform dependent. They provide additional abilities for the browser to display and process spatial data, so that the server’s workload can be reduced. Since every computation required by every request is done on the requester machine, clients’ interactions with the server can usually take place frequently and efficiently [7]. The architecture of the method is shown in Figure 2.
3. Proposed Approach What shapes the foundation of this paper is that XSLT is not designed to produce visual maps from GML. It is a general-purpose language to reformat all types of XML documents. Therefore, making a map with all the ingredients using XSLT is very sophisticated. For example, in most cartography software, legend is generated automatically. But if users want to draw a complete legend on their own, it would be more similar to drawing in vector environment such as AutoCad or CorelDRAW. The difference is that instead of drawing tools provided in these environments, the user should write XSLT or SVG codes, which are very complicated and time-consuming. What makes the situation even worse is that since the graphical result of writing codes is not provided real-time, the process will become a trial and error process. Extending XSLT to meet cartographic requirements is the major idea presented in this paper. The paper provides functions, operators and ingredients for map cartography. In this section, the investigator is to identify and describe the fundamental functionalities required to transform geo-referenced data to a visualization format such as SVG. In the next section, the functionalities are im-
plemented using XSLT and it is clarified how Web cartography specialists can use them. As discussed earlier, client-side computing has many advantages over server-side computing. In this paper, the process of converting GML to a presentation language like SVG is transferred to client-side using plug-in technology. Advantages of server-side approach are as follows: Higher security; Higher concealment; No need for the technologies to be widely approved. On the other hand, advantages of client-side approach can be listed as follows: Less data is transferred on the network. Less frequently the data is transferred on the network. Higher level of interaction. In addition, advantages of client-side approach for the discussed method are as follows: Separation of content from presentation; Reusability of XSLT file generated by the server; Possibility to make personal profiles for each client; Customizability of the resultant map both contentwise and graphically. Another difference of this research with the previous ones is that XSLT is extended to visualize GML maps with SVG. Extending XSLT requires first to identify what needs to be added to current capabilities and then implement them. The most straight forward way to extend XSLT is by extension functions. As a consequence, a set of functions with appropriate input and output are determined. The areas where functions should be considered are as follows: Introducing spaces; Transforming from real space to monitor space; Calculating scale; Drawing geospatial features with appropriate symbology and texts; Drawing outer map features. The above-mentioned areas are necessary ones to extend XSLT in a way to be able to make an elementary, but complete map.
3.1. Introducing Spaces
Figure 2. How client-side Internet GIS services using geodatabase work. OPEN ACCESS
The page that a viewer can see in a map is divided into several parts including the following: browser space; user space; map space; geospatial features space; outer features space. The hierarchy of the spaces is depicted in Figure 3. Functions providing the user with different spaces are mentioned below: JGIS
S. H. PAZOKY, F. HAKIMPOUR
63
(a)
(b)
Figure 4. Difference of coordinates systems of (a) Monitor space; and (b) Real space. Figure 3. Map spaces hierarchy.
“public static String view box (coords, margin, b Space Width, b Space Height, Precision)” The above function is responsible for calculating the minimum bounding box and receiving some global parameters from user with parameters as follows: coords: the coordinates of all the spatial features on the map; margin: browser space margin; b Space Width: width of the browser space; b Space Height: height of the browser space; and Preciosion: precision of all the numbers generated in the application. “public static String border (margin)” The above function creates the border of user space where margin is user space margin. “public static void margin Set (margin, Umargin)” The function creates the margin of map space using the following parameters: margin: margin between user space and geospatial features space; where Umargin: upper margin between user space and geospatial features space. Another useful function of this category is to draw neatline. Neatline is a rectangle surrounding geospatial features space. The function is as follows: “public static String neatline (hShift, vShift)” Where hShift is horizontal shift of the geospatial features space; and vShift is vertical shift of the geospatial feature space.
3.2. Transforming Real Space to Monitor Space There is a difference between coordinate system of real space and monitor space as shown in Figure 4. After calculating the appropriate transformation parameters between the two spaces, the function to perform the transformation by using the above equation is as follows: “private static String cords Change (coordPair)” Where coordPair shows coordinate pairs to be transformed from real space to monitor space.
3.3. Calculating Scale To draw the map, the scale between real space and monOPEN ACCESS
itor space should becalculated. In order to achieve the goal, two elements are required: Space available on the monitor and actual ground space that accommodates real features. Space available on the screen as described above is asked from the user through “view box” function. Real space comprises of sets of nodes of all selected features. All the nodes in the GML file, which are intended to be drawn on the map, are also introduced to the “view box” function. Using maximum and minimum values of northing and easting, scales in vertical and horizontal directions are calculated using the following equations: horizontal scale = vertical scale =
w max ( X ) − min ( X ) h max (Y ) − min (Y )
where “w” is the width and “h” is the height of geospatial features space. Based on the geospatial features space, scales in the two directions are different. To preserve the map from horizontal or vertical elongation, a unique scale should be chosen for both directions. As the geospatial features space introduced before cannot be exceeded, the minimum value of scales is chosen as the eventual map scale. An important point to mention is that choosing the minimum value of the two scales causes the geospatial features space to decrease in one direction. Thus, map designer should be alert not to leave any empty space. The function to calculate the scale based on aforementioned equations is as follows: “private static double scale Detection (minE, maxE, minN, maxN, gfsBounds)” Parameters are as follows: minE: minimum easting; maxE: maximum easting; minN: minimum northing; maxN: maximum northing; and gfsBounds: geospatial feature space bounds.
3.4. Drawing Geospatial Features with Appropriate Symbology and Text Geospatial features are categorized into three groups: points, polylines, and polygons. For each of the groups, JGIS
64
S. H. PAZOKY, F. HAKIMPOUR
drawing, labeling and symbology is different. Therefore, different functions should be considered for each category. Points: Points are comprised of just two coordinate values of easting and northing. Point symbols should be defined in SVG file and the function refers to the symbol. Furthermore, the size of the symbol is adjustable using the function. The function to draw points with appropriate symbology is as follows: “public static String stylePoint (coordPairs, sym, fName, labelTag, symH, symW, labelStyle)” Using the following parameters: coordPairs: coordinate pairs representing a point; sym: reference to SVG point symbol; fName: name of the feature group in the legend; labelTag: tag to label features accordingly; symH: symbol height; symW: symbol width; and labelStyle: label styling. Polylines: Polylines are comprised of two sets of coordinates. As there is no way to define linear symbols in SVG, polyline symbols are implemented using “style” which is a CSS reserved keyword. The text of a linear feature should be written on it several times with a certain interval. The function for drawing polylines with appropriate styling is as follows: “public static String stylePolyline (coordPairs, fName, labelTag, labelInt, styling, labelstyle)” Parameters are as follows: coordPairs: sets of coordinate pairs representing a line; fName: name of the feature group in the legend; labelTag: tag to label features accordingly; labelInt: labels interval; styling: defining linear symbols using CSS code; and labelStyle: label styling. Polygons: Polygons are also comprised of two sets of coordinates. Like points, polygons can use externally defined symbols. In addition, as polygons are surrounded with lines, border lines can be styled by CSS “style” keyword. Labels of polygons should be in the middle of the polygon. The function for drawing polygons is as follows: “public static String stylePolygon (coordPairs, sym, fName, labelTag, styling, labelStyle)” With the following parameters: coordPairs: sets of coordinate pairs representing a polygon; sym: reference to SVG polygon symbol; fName: name of the feature group in the legend; labelTag: tag to label features accordingly; styling: defining linear symbols using CSS code for polygon borders; and labelStyle: label styling
3.5. Drawing Outer Map Features Outer map features are those which help map users understand the map better and include the followings: Map title: Map title is a short hugely-typed text on top of a map to provide a clear indication on what the OPEN ACCESS
map is displaying. Therefore, top of the map should be left empty that is accomplished by setting different margin value for top of the map when using “marginSet” function. The function designed for producing map title should suggest the best place for title. Also, two parameters are needed that if the suggested position is not acceptable for the users, they can move it in two directions. The function which displays the title is as follows: “public static String title (text, hOffset, vOffset, styling)” Parameters are as follows: text: title text; hOffset: horizontal offset of the title; vOffset: vertical offset of the title; and styling: title text styling. Grid: Grid lines define locations on map using Cartesian coordinate system. Each grid line specifies one coordinate horizontally or vertically based on its direction. The function is as follows: public static String grid (startingE, startingN, hInt, vInt, dist1, hOffText, vOffText, textStyle) Using the following parameters: startingE: the easting of the first vertical grid line; startingN: the northing of the first horizontal grid line; hInt: interval between horizontal grid lines; vInt: interval between vertical grid lines; dist1: distance of grid line texts from grid lines; hOffText: horizontal offset of texts; vOffText: vertical offset of texts; textStyle: texts styling. Different parameters of grid function are depicted in Figure 5(a). Legend: Legend is where all symbols used in the map are gathered showing which feature they refer to. The function declaration should be as mentioned below: “public static String drawLegend (pX, pY, width, titleStyle, textStyle, borderStyle)” With the following parameters: pX: X coordinate of the position of the legend in outer features space; pY: Y coordinate of the position of the legend in outer features space; width: legend width; titleStyle: styling of the titles of the legend; textStyle: styling of the text used in the legend; and borderStyle: styling of the border of the legend. Different Parameters of legend function is depicted in Figure 5(b). Scalebar: Scalebar is a graphical representation of scale that helps users measure distances on a map. Since scalebar is more complicated than other outer map features and has more distinct elements, parameters of this function are more than previous ones. The function declaration is as follows: “public static String scaleBar (type, div, divLength, subDiv, pX, pY, dist1, dist2, height, titleStyle, headStyle, oddStyle, evenStyle, titleHOff headHOff)” Parameters are as follows: type: scalebar type; div: number of divisions; divLength: division length; JGIS
S. H. PAZOKY, F. HAKIMPOUR
65
(a)
(b)
(c)
Figure 5. Different parameters of (a) “grid”; (b) “drawLegend”; (c) “scalebar” functions.
subDiv: number of subdivisions; pX: X coordinate of the position of the scalebar in outer features space; pY: Y coordinate of the position of the scalebar in outer features space; dist1: distance of title from scalebar; dist2: distance of heading from scalebar; height: scalebar height; titleStyle: title styling; headStyle: heading styling; oddStyle: scalebar styling odd parts; evenStyle: scalebar styling even parts; titleHOff: title horizontal offset; and headHOff: heading horizontal offset. Different Parameters of scalebar function is depicted in Figure 5(c). North arrow: North arrow type is defined by symbols in SVG directly and referenced in the function. The function is as follows: “public static northArrow (pX, pY, sym)” Using the following parameters: pX: X coordinate of the position of the north arrow in outer features space; pY: Y coordinate of the position of the north arrow in outer features space; and sym: reference to the symbol. Map metadata: Every map should contain production OPEN ACCESS
information, otherwise it is not valid. The text is entered by the user and ‘\n’ wild card should be used to go to next line. The function is as follows: “public static metadata (pX, pY, text, textStyle)” With the following parameters: pX: X coordinate of the position of the north arrow in outer features space; pY: Y coordinate of the position of the north arrow in outer features space; text: metadata text; and textStyle: Text Styling.
4. Prototype Implementation Required functions to extend general-purpose XML Transformation language to a cartographic tool were introduced in the previous section. In this section, most of the functions are implemented to demonstrate how using extension functions can facilitate GML to SVG conversion on the client side with conditions described in previous sections. Furthermore, a graphical user interface called XCartoT is designed to make the process more user-friendly and also allow less professional users to JGIS
S. H. PAZOKY, F. HAKIMPOUR
66
produce well-designed maps using aforementioned tools.
4.1. Implementing Extension Functions 4.1.1. Data The data used in the research consists of the following: Polygon features: parcels of 6 municipal regions; Polyline features: streets of the same regions; Point features: petrol stations, police stations and hospitals of the same regions. 4.1.2. XSLT File The first line of code to talk about is the opening