Translation-Invariant Mixture Models for Curve. Clustering. Technical Report No. 03-09. Information and Computer Science Department,. University of California ...
Translation-Invariant Mixture Models for Curve Clustering Technical Report No. 03-09 Information and Computer Science Department, University of California, Irvine
Darya Chudova, Scott Gaffney, Eric Mjolsness, Padhraic Smyth Information and Computer Science University of California, Irvine CA 92697-3425 {dchudova,sgaffney,emj,smyth}@ics.uci.edu
1
Abstract In this paper we present a family of algorithms that can simultaneously align and cluster sets of multidimensional curves defined on a discrete time grid. Our approach assumes that the data are being generated from a finite mixture of curve models. Each mixture component uses (a) a mean curve based on a flexible non-parametric representation, (b) additive measurement noise, (c) randomly selected discrete-valued shifts of each curve with respect to the independent variable (i.e., typically along the time axis), and (d) random real-valued offsets of each curve with respect to the observed variable. We show that the Expectation-Maximization (EM) algorithm can be used to simultaneously recover both the curve models for each cluster, and the most likely shifts, offsets, and cluster memberships for each curve. We demonstrate how Bayesian estimation methods can improve the results for small sample sizes by enforcing smoothness in the cluster mean curves. We evaluate the methodology on two real-world data sets, time-course gene expression data and storm trajectory data. Experimental results show that models that incorporate curve alignment systematically provide improvements in predictive power on test data sets. The proposed approach provides a non-parametric, computationally efficient, and robust methodology for clustering broad classes of curve data.
2
−15
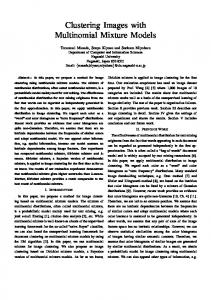
Mean sea−level pressure (mb)
−20 −25 −30 −35 −40 −45 −50 −55 0
30
60 90 Time (hours)
120
150
Figure 1: Curves of cyclone intensities from genesis to death.
1
Introduction and Motivation
Clustering is widely used as a general technique for exploring and understanding large data sets. Curve clustering focuses on the clustering of sets of variable-length sequences that consist of (possibly multidimensional) measurements observed over an independent variable such as time. An example we will discuss later in this paper is trajectories of cyclones, where each trajectory consists of a short 3-dimensional timeseries, the dimensions being x-y spatial coordinates and cyclone intensity. Other examples of curve data sets include time-course measurements from sets of genes [9], estimated trajectories of individuals or vehicles from video data [12], and biomedical measurements of the response of different individuals to drug therapy over time [18]. A practical problem with such data is that the curves tend to be misaligned in various ways. For example, Figure 1 shows a set of curve data that represents the intensity of individual cyclones over their respective lifetimes. These curves can be made more similar by shifting individual curves along the time axis. The lack of alignment here is both an artifact of the methods used to extract these curves (e.g., in detecting and tracking cyclone centers in sea-level pressure data [14]), as well as being due to natural variability in the underlying dynamic processes generating the data. More generally, all manners of (unknown) transformations may have been applied to observed curve data, such as linear shifting in the time-axis, offsets and scaling in the observed measurements, or more complex forms of non-linear warping of the signal. Clustering in this context can be problematic due to the “chicken and egg” problem: we may not be able to effectively cluster the data without first removing the transformations, but on the other hand we may not be able to effectively remove the transformations without first clustering the curves. One approach is to preprocess or post-process the sets of curves by employing alignment techniques such as dynamic time-warping before or after clustering [34, 35]. The disadvantage of such an approach is that the discovery of the curve transforma3
tions and curve clustering are decoupled from each other, which can in principle weaken the ability of a clustering algorithm to detect structure in the data. In this paper we address this specific problem, namely simultaneously clustering and “detransforming” sets of curves. The specific class of curve transformations we address includes discrete-valued shifts along the time (or independent variable) axis and real-valued additive offsets in each of the measurement (dependent variable) axes. Extensions to include other forms of transformations such as multiplicative scaling of the curve measurements or more general nonlinear deformations (such as non-linear warping of the time axis) can also be handled in principle within the mixture-based framework we propose but are not specifically addressed in this paper. The focus of the paper is the development and evaluation of learning algorithms that can recover both the cluster models as well as the most likely alignments for each curve, given sets of observed curves that are assumed to be generated from a particular class of generative models. The learning algorithms we use are in general based on maximum a posteriori (MAP) approaches that seek model parameters that maximize the product of (a) the likelihood of the observed curves under the generative model and (b) parameter priors that enforce smoothing in the mean curve models (e.g., smoothness over time). We will assume that we can achieve useful results by restricting attention to shifts that are “on-grid” in terms of the independent variable, i.e., that shifts are constrained to occur on the same sampling grid that the data are measured on. This is in direct contrast to “off-grid” methods that interpolate between the gridded observations, such as polynomial or spline models. The advantages of the on-grid approach (as we will see later in the paper) are that (a) we can use a completely non-parametric model for the mean curves within each cluster by avoiding parametric assumptions on the interpolating function, and (b) we get a computationally feasible procedure for solving the joint clustering/transformation problem. Of course for certain applications (for example when data are very sparse for each curve) the interpolative (or functional modeling) methods might be more appropriate. In this paper, however, the focus is on the “on-grid” class of modeling techniques. Experimental results later in the paper bear out that substantial and systematic improvements in modeling power can be gained by the “on-grid” approach alone. The advantages of a probabilistic approach to clustering are well-known and include the ability to estimate the most likely number of clusters given the data [32] and the ability to add background clusters to account for outliers in a systematic manner [10]. For curve clustering with transformations the probabilistic approach to clustering is particularly valuable since it allows us to directly address the afore-mentioned “chicken and egg” problem by treating the transformations as hidden information over which we can learn distributions informed by the observed data. Furthermore, we can couple the learning of these distributions over hidden transformations to the problem of learning cluster models. The paper is organized as follows. Section 2 introduces some basic terminology for the paper and Section 3 discusses relevant prior work in this area. Section 4 introduces the basic model and parameter estimation methods, and Section 5 then extends this model to a hierarchical Bayesian approach. Section 6 defines the ex4
perimental methods that we use to evaluate our proposed clustering methodology, followed by Section 7 which investigates the performance of the proposed methodologies on simulated data. Sections 8 and 9 describe experimental results with real datasets: time-course gene expression data and trajectories of extra-tropical cyclones (ETCs). Section 10 summarizes and concludes the paper.
2
Terminology
We will use the term “curve” to denote a variable-length series of data measurements observed as a function of some independent variable such as time. More generally, each individual “curve” can consist of set of multi-dimensional (vector) measurements as a function of the independent variable, rather than a single measurement. In statistics, such data are sometimes referred to as “functional data” [30], emphasizing the fact that the observed data are functions of an independent variable. The term “measurement offset” will be used to refer to a real-valued scalar added to all of the measurements in a curve—or a vector of reals, one for each measurement dimension if the curve has multiple measurement dimensions. For simplicity of notation we will refer to the independent variable as time, although in general it could refer to position or some other sequential ordering. We will use the term “time-shift” to refer to an integer-valued global shift of the curve measurements (simultaneously in all dimensions) along the time-axis (the independent variable axis). “Alignment” (in this paper) refers to the process of finding estimates for either (or both) measurement offsets and time-shifts for specific curves. Thus, we could refer to (for example) “alignment with time-shifts” or “alignment with both time-shifts and measurement offsets”. For example, Y�i (t) = Yi (t + ϕi ) + δi ,
1≤i≤N
could represent the alignment of curve Yi into a new curve Y�i where ϕi is an integer time-shift and δi is a real-valued scalar (or a vector of reals if Y is a vector measurement), and i is an index on curves.
3
Related Work
The primary novel contribution of this paper is the learning of curve clusters and curve alignments within a single unified framework. While there has been a significant amount of prior work on each topic in isolation (as we discuss below) there has been no work that we are aware of that addresses simultaneous clustering and alignment of curve data. Clustering of curves of equal length L can be achieved by representing the curves in a vector space of dimension L and using standard multivariate clustering techniques. For example, one can use K-means [17] or the model-based clustering approach of Gaussian mixtures [2]. More general techniques perform curve clustering directly in 5
the curve space and, thus, can handle curves of variable lengths (for example) in a natural manner. These techniques have their origins in regression-based mixture models that focus on the finding of two or more underlying functions (e.g., polynomials) from which the observed data might have been generated. This methods are often referred to as regression mixtures [7, 19, 12] and they extend the standard fixed-dimensional unconditional mixture framework to the case where component density models are replaced with conditional regression density models. More recent work along these lines focuses on learning individual models for each curve during the clustering. This can be handled for example, through the integration of linear random effects models [21] with regression mixtures [14, 22]. Further extensions have been developed that use non-parametric models for the mean curves, such as the kernel regression models in [12] and the mixtures of splines in [18]. The clustering component of our proposed approach can be loosely considered to fall within this class of non-parametric curve clustering techniques—we use a model that allows for individually varying means at specific time points but where the means are loosely coupled together via a smoothing prior. None of the above work on clustering addresses the issue of curve alignment. However, there is a considerable body of prior work on curve alignment (without clustering) in various forms under many names: time warping [34], curve registration [29], structural averaging [20], and image registration or point-set matching as commonly used for image matching [15]. Generally speaking there are two approaches to curve alignment. The first, called landmark registration, involves a process in which the time axis of each curve is made to coincide at selected landmark targets of the dependent variable by selecting from some space of available transformations on the time axis. Specific instantiations of this approach are described by Kneip and Gasser [20] and by Ramsay and Li [29]. The second common approach is to define a global alignment criterion (e.g., squared-error along curves) that is used to iteratively learn alignments based on the current overall averaged target curve. At each iteration, each curve is first transformed “towards” the current target curve so as to minimize the alignment criterion. The averaged target curve is then updated based on the newly calculated alignments. Ramsay and Silverman [30], and Ramsay and Li [29] discuss and apply this technique to various data sets. None of this work on curve alignment is integrated with clustering of curves. One area where there has been some success to date in simultaneous registration and clustering is with image data. Frey and Jojic [11] propose the use of EM to learn mixtures of images subject to various forms of linear transformations. Chui et al. [4] use the ideas of transformation invariant distance measures proposed in [16] and develop deterministic annealing algorithms for simultaneous clustering and matching of point sets. In some sense these approaches represent a two-dimensional extension of what we propose here, albeit with somewhat different goals. The novelty of our approach lies in the application and extension of mixture modeling to the specific problem of translation-invariant curve-clustering. In addition we demonstrate how these techniques can be applied to two real-world scientific data analysis problems involving gene expression data and cyclone trajectory data. 6
4 4.1
Probabilistic Curve Clustering A Generative Model
In this section, we describe the proposed generative model for simulating multidimensional curves observed on a subset of a fixed time grid. We implicitly assume that the grid points (measurement times) on the time-grid are equally spaced. In theory this assumption could be relaxed by treating data on non equi-spaced grids as observed samples from an assumed (but hidden) higher-resolution equi-spaced grid and making inferences accordingly. However, we do not pursue this in this paper, and focus here on data sets involving equi-spaced measurements along the time axis. In many situations the curves are univariate, for example, gene expression measurements. In applications like object tracking, however, there can be multiple measurements per time point, e.g., the estimated 2D or 3D location of the object and possibly other features of the object such as shape, color, mean intensity and so forth. Our generative model is designed to work with multidimensional curves. Throughout this paper we will use the term “curve” when referring to a series of D-dimensional observations of an object on a time grid. The number of D-dimensional observations (the length of the curve) can be different for different objects. In the approach taken here we do not explicitly model the lengths of the observed curves—we specify the model for generating curves conditioned on the curve lengths (this conditioning is implicit and not explicitly written out in all likelihood expressions below). We begin with a standard mixture model with K components to allow for heterogeneity in the generated curves [25]. The probability of an individual curve Yi given a set of model parameters Θ is defined as P (Yi |Θ) =
K �
αk P (Yi |Zi = k)
(1)
k=1
where αk is the probability of component k and Zi is a random variable indicating cluster membership for curve Yi . We will denote the vector of measurements over time in the dth dimension for the ith observation by Yid . To generate curves with relative time shifts, we introduce a latent variable ϕi that denotes the amount of shifting on the time grid for observation Yi and takes integer values from a fixed range [0..M ]. Therefore, P (Yi |Θ) =
M K � �
αk γk,m P (Yi |Zi = k, ϕi = m)
(2)
k=1 m=0
where γk,m is the probability of time shift m in component k: γk,m = P (ϕ = m|Z = k). If the curve Yi is observed on the entire time grid of length T (where T can be thought of as the maximum length of a curve, e.g., the length of the longest observed curve plus the maximum allowed time shift), we can represent it as a point in a T dimensional space, and model its distribution as a multivariate Gaussian with mean µk and diagonal covariance matrix Ck . The assumption of a diagonal covariance 7
structure is equivalent to assuming independence of measurements at different time points given cluster membership, proper alignment, and parameters of the cluster. In the next section we extend this model to handle smoothness constraints on the neighboring means of the Gaussians by employing a hierarchical Bayesian model that constrains neighboring means to be similar to each other. We assume that within each component the measurements taken in different dimensions are conditionally independent, providing a relatively simple but often effective way to handle multi-dimensional data: P (Yi |Zi , ϕi ) =
D �
�
P Yid |Zi , ϕi
�
(3)
d=1
Given the cluster membership Zi and time shift ϕi of a partially observed curve Yi of length Li < T , we can calculate its probability under a T -dimensional Gaussian distribution by integrating out unobserved measurements. The integration is trivial due to the diagonal covariance structure, and we obtain an Li -dimensional normal density. To allow real-valued offsets in the measurement space (note that this is different from the time-shifts discussed above), we define a likelihood that is invariant to translations of the axes. Namely, the conditional probability of curve Yid is given by a Gaussian density with mean µdk and covariance Ckd , evaluated at translated curve Yid − δid . The value of the offset δid is chosen so that the translated curve is best aligned with the corresponding portion of the mean curve under some norm. Note that the value of the offset δid depends on the particular cluster that we align with, as well as the assumed time-shift, and thus standard methods of dealing with offset translations (such as subtracting the mean value) are neither applicable nor optimal in this context. The likelihood of a single curve in dimension d is defined as �
�
�
P Yid |Zi = k, ϕi = m ∼ N Yid − δid (k, m)|µdk , Ckd
�
δid (k, m) = arg min �Yid − δ − µdk (am : am + Li − 1)� δ
2
(4) (5)
where am denotes the point on the time grid corresponding to the mth time-shift. We use the Euclidean norm in Equation 5, but other notions of similarity could equally well be used to define the best offset δ in the measurement space, perhaps based on prior knowledge of the process generating the data. Conditioned on the length of the curve, Equations 1 through 5 provide a generative model that can be used to simulate spatially offset “snippets” of a variety of curve prototypes. These snippets start from different initial points in time, have different lengths, and have arbitrary offsets in the measurement space. The simulation has four stages: • sample component k according to αk , k ∈ [1..K]; • sample time shift m according to γk,m , m ∈ [0..M ]; 8
ˆ d , d ∈ [1..D], from • sample curves Y �
�
N µdk (am : am + L − 1), Ckd (am : am + L − 1) ˆ d + δd. • generate offsets in the measurement space Yd = Y
4.2
Parameter Estimation
We employ the expectation maximization (EM) algorithm [6] to learn maximum likelihood estimates of the model parameters from the observed curves, as is usual for models with latent structure. The algorithm starts from a random initialization of parameter values and proceeds by alternating the following two steps: • E-Step: evaluate the distribution of latent variables Zi and ϕi given current parameter estimates; • M-Step: adjust free parameters of the model to maximize the expected loglikelihood of the data with respect to the distribution of latent variables. The time complexity of a single iteration for this algorithm is linear with respect to each of the following: the number of curves N , the size of the time grid T , the dimensionality of the curves D, the number of clusters K, and the maximum amount of shifting allowed M , i.e., it is O(N T DKM ). This is only a factor of M more expensive than EM for regular mixture of Gaussians with diagonal covariance matrices. Note in particular that the O(N 2 ) computation of calculating all pairwise alignments curves is avoided. The proposed method aligns observed curves only with the current estimates of the cluster means. Full details of the E-Step and M-Step equations are provided in Appendix I.
5 5.1
Bayesian Smoothing Defining the priors
In the models above, the consecutive means (e.g., in time) of the Gaussians are unconstrained. While this provides the flexibility of non-parametric modelling, it also ignores physical constraints and reasonable prior expectations about the smoothness of the mean curves. It is natural to employ Bayesian ideas in this context by introducing prior distributions on the parameters of the models that favor smooth solutions. We begin with the conventional factorization of the prior distribution as typically used in Bayesian analysis of Gaussian mixture models in a standard “non-curve” setting (e.g., [8] and [31]): P (Θ) = P (µ) P (C)P (α)P (γ)
(6)
We use conjugate prior distributions for the Gaussian noise covariance matrices C, component weights α, and shift probabilities γ. 9
In standard multivariate mixture modeling it is reasonable to assume that the means µdk (j) are independent from each other. Here, however, we specifically want to couple the means and to that effect we introduce a prior distribution on the means of the components that correlates the means at time t + 1 and t. We propose a hierarchical Bayesian model, where the first level of the hierarchy introduces dependence between the means at consecutive time points P (µ(t + 1)|µ(t), σ 2 ), and the second level controls the degree of smoothness in the means P (σ 2 ). Similar “smoothing priors” have been successfully used in computer tomography, medical imaging and image processing in general to enforce smoothness in the estimated signal (see [27] and [24] and references therein). Specifically, at the first level we assume a Gibbs prior such that the mean µdk (t + 1) at time (t + 1) in cluster k and dimension d is a priori normally distributed around the mean at time t within 2 the same cluster with some variance [σkd ] : �
�
�
2
P µdk (t + 1) = N µdk (t), [σkd ]
�
(7)
We have also investigated a more complex Markov random field prior that couples each point with both neighbors. While we found that this prior often leads to improvement in prediction performance, it requires more complex parameter estimation techniques and we do not pursue the details of this approach any further in this paper. 2 At the second level of the hierarchy, we assume that the parameters [σkd ] that con2 trol the degree of smoothness are generated from some common distribution, P ([σkd ] ). We use a conjugate prior, and model the precision [σ1d ]2 , denoted by ν d , as a Gamma k
distribution with parameters (Adµ , Bµd ): �
P
�
1 2 [σkd ]
= P (ν d ), k = 1, .., K �
P (ν d ) = Γ Adµ , Bµd
�
(8) (9)
We further define conjugate Gamma priors on the diagonal covariance terms in the Gaussian mixture components and Dirichlet priors on the mixture component probabilities and time shift probabilities within the clusters. �
P
5.2
1 Ckd,t,t
�
�
d = Γ Adcov , Bcov
�
(10)
Parameter estimation for the Bayesian model
Having specified prior distributions for all parameters of the model, we obtain point estimates of the parameters and the hyperparameters using a Gibbs sampling approach. This is commonly done for models with hyperparameters, e.g., as in [28, 23]. The algorithm iterates between updating the parameters of the model (cluster means, covariance matrices, time shift and component probabilities) given current values of
10
the hyperparameters, and then updating the posterior distribution of hyperparameters given all other parameters in the model. Specifically, we iterate through the following steps: 2
1. Sample values of hyperparameters [σkd ] from the corresponding prior distribution P (ν) = Γ(Adµ , Bµd ); 2. Use the EM algorithm to find maximum a posteriori (MAP) estimates of component parameters given current values of hyperparameters P (Θ|Y, σ 2 ); 3. Update the posterior distribution of the hyperparameters P (ν|Θ, Y) = Γ(Aˆµ , Bˆµ ), which also has a Gamma distribution due to conjugacy; 2
4. Sample values for the hyperparameters [σkd ] from their posterior distribution; 5. Repeat steps 2 through 4. MAP estimates of the parameter values result from including log P (Θ|σ 2 ) in the M-step of the EM algorithm. Closed-form solutions for the parameter values are no longer possible in this case, since we have introduced a dependence between consecutive means. The maximization can be reduced to iteratively solving a tri-diagonal linear system of equations, until a fixed point is reached. Finding a single M-step solution usually converges within the first few iterations when the initial approximation is taken to be maximum likelihood estimates of the parameter values. Full details are provided in Appendix II. The parameters A and B of the hyperprior allow us to express belief about the expected difference between consecutive means and to control the strength of the prior. The smaller the variance of the hyperprior, the stronger the effect of the prior in the sense that the model is more constrained to find estimates of the parameters that agree with the corresponding mean value of σ 2 . Other estimation strategies, such as empirical Bayes methods, could also be used to set the value of the hyperprior mean.
6
Experimental Methods
The quality of a clustering algorithm can be characterized empirically for a given data set using a number of different measures. For example, a particularly useful feature of the probabilistic clustering approach is that it provides a full density function for the data, allowing one to objectively compare different models and methods on outof-sample data—better models should yield higher probability for unseen data. The specific measures we use in this paper for evaluation include • Mean within-cluster variance: this is useful to domain experts comparing the results of various clustering algorithms. Clearly, as we add additional timeshift and offset parameters, we expect lower variance clusters; nonetheless, it is informative to record how much the within-cluster variance is reduced on specific data sets. 11
• Out-of-sample predictive power: – Cross-validated logP score reflects the expected log-likelihood of a single new observation and indicates how well the learned density function approximates the true distribution [5, 32]. To evaluate the per-point logP score on a single test data set with Nc curves, we sum log probabilities assigned by the learned model to individual curves, and divide by the total number of points in the test set Npts : log P =
Nc 1 � log P (Yi |Θ) Npts i=1
(11)
– One-step ahead prediction of the next measurement in a curve given previous measurements, or interpolation of a held-out measurement given all other prior and subsequent measurements, as measured by out-of-sample MSE (mean squared-error). Even though we primarily focus on clustering in this paper, it is also informative to measure time-series predictive power. • Scientific interpretation of the results: clearly this is quite subjective, but interpretability of results is often quite important for domain experts.
7
Synthetic Data
We use simulated data problems to demonstrate the benefits of models with timeshifts and measurement offsets and compare to baseline methods. The baseline methods are simple K-means clustering and conventional multivariate Gaussian mixture models. we evaluate the models in terms of classification accuracy, quality of density estimation (as measured by logP), error in estimated component parameters, and within-cluster variance. We create a set of simulated data sets from a two-component version of the generative mixture model described in Section 4, using randomly generated parameters (e.g., means, variances, cluster and shift probabilities). The mean function for each component models is a smooth function of the form f (x) = a1 sin(b1 x) + a2 cos(b2 x) defined on a discrete time grid. The coefficients a1 , a2 , b1 , b2 are sampled from a uniform distribution over a fixed interval [0,1]. Each component in the mixture model has its own set of randomly generated a and b coefficients. The inverse variance within each component is sampled from a Gamma prior with parameters (5,5). The mixing weight for the two-component model is selected from a uniform distribution on [0,1]. Time-shift probabilities are sampled by simulating from a uniform distribution and normalizing, and measurement offsets for each individual curve are sampled from a uniform distribution. Figure 2 shows a set of curves simulated in this manner. We generated a number of different problems with K = 2 by varying the random coefficients a, b of the mean curve, variance within the clusters, and component and shift probabilities. The length of the mean curve (number of points on the time grid) was set to L = 20 and we allowed time shifts of up to M = 4 time points. 12
5
4
3
2
1
0
−1
−2
0
2
4
6
8
10
12
14
16
18
20
Figure 2: Simulated curves from a 2-component mixture problem with similar component means.
1.5
1
0.5
0
−0.5
−1
−1.5
−2
−2.5
−3
0
5
10
15
20
25
Figure 3: The curves from Figure 2 after alignment by the EM algorithm.
Method
Accuracy
True Model Alignment in [Y,T] Alignment in [Y] Regular MM K-Means
0.97 0.96 0.62 0.64 0.64
logP
Error in cluster mean 1.41 0 1.29 0.018 0.21 0.048 -9.22 0.036 — 0.035
Within-Cluster StDev 0.052 0.049 0.062 0.100 0.127
Table 1: Average performance of various clustering methods on simulated data sets with similar clusters.
13
Method
Accuracy
True Model Alignment in [Y,T] Alignment in [Y] Regular MM K-Means
1 0.99 0.99 0.89 0.79
logP
Error in Cluster Mean 2.01 0 1.34 0.019 1.52 0.011 -7.87 0.171 — 0.4235
Within-Cluster StDev 0.050 0.048 0.057 0.105 0.129
Table 2: Average performance of various clustering methods on simulated data sets with distinct clusters.
Note that if two clusters are sufficiently distinct from one another, then small shifts along the time axes would not make the classification or clustering task much harder. In this case, we expect all of the algorithms to perform equally well in terms of classification accuracy, with better density estimates (as indicated by higher out-ofsample logP scores) provided by models with alignment. As the mean curves get closer to one another, the problem becomes increasingly difficult and we should expect the models with alignment to yield significant improvement in terms of both classification accuracy and density estimation. We emphasized this distinction between “hard” and “easy” problems by performing two separate experiments. In the first one (“hard” problems), we generated data sets such that the coefficients (a, b) of the smooth function f2 (x) generating the mean in cluster 2 are chosen such that γ2 = γ1 + 0.2r where γ1 is the corresponding coefficient for γ2 in component 1 and r is a random draw from U (0, 1). Thus, the coefficients in cluster 2 (the γ2 ’s) tend to be more similar to the coefficients in cluster 1 than in the case where they are independently sampled and, consequently, the two cluster means tend to be more similar. Figure 2 shows a sample of unaligned data generated by one such model. Figure 3 shows the same set of curves after alignment in both measurement space and time by the proposed EM algorithm (clustering not shown). We evaluated five different types of models on simulated data sets: (1) the true data generating model, (2) mixture models with alignment via both shifts in time [T] and measurement offsets in the [Y] axes, (3) mixture models that only align using measurement offsets [Y], (4) mixture models where the following (ad hoc) preprocessing is performed: all curves are shifted in time to start at time 0 and the value of the first measurement in each curve is subtracted from all other measurements, and (5) the K-means algorithm. Table 1 shows the results of running the 5 algorithms on 50 different simulated “hard” problems. In each of the 50 problems a training data set of N = 140 curves was generated. Table 2 shows the same type of results but for problems that are typically “easy” with more distinct cluster means (from coefficients that are generated independently). All of the performance results, with the exception of the withincluster standard deviation, reflect out-of-sample performance. We report the average value (with respect to the 50 different problems) of the performance measures for each 14
of the algorithms. Column 1 contains the classification accuracy, column 2 contains the logP score (the higher the better), column 3 contains the mean relative error observed in recovered cluster centers as compared to the true data generating cluster means (the lower the better), and column 4 shows the in-sample standard deviation of measurements within the clusters (the lower the better). The results show that the algorithms that use alignment in both the time and measurement axes provide higher classification accuracy on both the “harder” and “easier” problems. We achieve better density estimation by properly reducing the variance within the clusters. As expected, in the set of easier problems with distinct clusters (Table 2) the alignment in the measurement axes alone yields the same quality model as full alignment in [Y,T]. In this case, aligning the time axes allows one to slightly lower the variance within the clusters, but does not yield any improvement in classification accuracy. However, when the clusters are more similar to each other (Table 1) it is evident that simultaneous alignment in both axes is required to recover the correct cluster models. We have also performed two additional experiments. In the first experiment we performed alignment on the time axes alone. In the second experiment we performed clustering with alignment in the measurement axes, followed by alignment in the time axes within the clusters obtained in the first step (literally separating the alignment problem from the clustering problem). The results for these two types of methods in terms of both classification accuracy and density estimation are closer to the performance of the standard mixture (no alignment) than the model with proper alignment in both axes. This suggests that coupling the information contained in both dependent and independent variables significantly increases the power of the model.
8
Gene Expression Clustering
Time-course gene expression data consists of expression levels from a set of genes measured at different time points—each curve (also sometimes referred to as a “profile”) consists of the intensity measurements from a specific gene over time. Clustering is an important tool for analyzing gene expression data since for many expression sets it is hypothesized that there exists different groups (or clusters) of genes with different dynamic behaviors, but where the behavioral characteristics of genes within each clusters are relatively homogeneous and correlated [9, 36]. Moreover, in certain situations subsets of genes are hypothesized to exhibit “master-slave” or “leader-follower” relationships. To a first approximation expression levels of the slave genes can be reasonably assumed to follow that of their master gene with an unknown time lag. It is therefore desirable that a clustering algorithm that detects patterns of distinct behavior in such data is able to ignore the differences in profiles that are explained by simple shifts of the time axes. Analysis of the genes that resemble each other’s expression levels may reveal very useful information about regulation mechanisms. For example, finding sets of genes that exhibit “master-slave” relationships can provide a starting point for building more realistic models of regulatory behavior. In this context curve clustering is a useful methodology in the analysis of time15
2
Normalized log−ratio of intensity
1.5 1 0.5 0 −0.5 −1 −1.5 −2 0
2
4
6
8
10
12
14
16
18
Time
Figure 4: Time-course curves from the gene expression data set. course genomic data, from exploratory data analysis to model-building of regulatory networks. Previous work on gene expression clustering has focused on nonprobabilistic techniques such as hierarchical clustering methods [9]. It is both computationally infeasible and conceptually difficult to try to integrate curve alignment techniques (such as dynamic time-warping) with a technique such as hierarchical clustering—thus, alignment (via techniques such as dynamic time-warping tends to be applied separately from any clustering of the data [1]. Standard mixture models have been applied to gene expression clustering with some success, but without any integration of curve alignment [36, 26]. In the results presented in this section we integrate alignment and clustering of expression data using the methods presented earlier in the paper. We might speculate that the goal of producing clusters that are invariant to time-shifts is somewhat different from conventional clustering in that the two methodologies enable us to answer slightly different scientific questions about the data. For example, traditional clustering (no time-shifts) allows one to identify groups of genes that peak at the same interval, while shift-invariant clustering recovers groups of genes that participate in similar regulatory patterns that unfold along the time axis. For our experiments we used normalized gene expression measurements (logratios) of the activity of cell cycle-regulated genes in yeast. The data set contains time course measurements for 800 genes in yeast Saccharomyces cerevisiae identified as cell cycle-regulated based on analysis provided in [33]. Specifically, we use the alpha arrest data that captures gene expression levels at 7 minute intervals for two consecutive cell cycles, for a total of 17 measurements per gene (Figure 4). There are no missing measurements in any of the curves in this data set. The goal is to discover equivalence classes of genes such that the genes in the same class exhibit similar behavior subject to translation in the time axes. We did not use measurement offsets in the experiments for this data set since we cluster normalized log-ratios of the true measured intensities (a standard pre-processing step for gene expression data [33]). The analysis of the log-ratios in the yeast cell cycle data set [36] suggests that the log-ratios are better modeled by the normal distribution than the raw intensities. 16
0.22 No alignment Alignment, M = +−2 0.2
Mean variance
0.18 0.16 0.14 0.12 0.1 0.08 0.06 2
4
6
10 # of clusters
20
30
40
50
Figure 5: Within-cluster mean variance for methods with and without time-shifts on gene expression data.
average per−point logP
−0.25
−0.3
−0.35
−0.4
No alignment Alignment, M = +−2
−0.45 2
4
6
10 # of clusters
20
30
40
50
Figure 6: Cross-validated logP scores on gene expression data with V = 10. Figure 5 shows the difference in the within-cluster mean variance for the different models evaluated both with and without alignment in the time axis as the number of clusters K is varied. Naturally, the variance continues to decrease as the number of clusters is increased. We see that the mixture model with time-shift alignment systematically produces the most compact clusters. We used models that allow symmetric shifts of up to M = 2 time steps to the left and to the right, for a total of 5 possible alignments for each curve. Increasing M to ±3 does not result in large improvements in performance as the maximum possible shift approaches the length of the cell cycle, i.e. the period of the measured curves. Figure 6 plots the out-of sample logP scores for the same models as in Figure 5. Each score was obtained by 10-fold cross validation; higher scores indicate better fit of the model to the data. As expected, the score starts to climb quickly for small values of K, and then flattens out (with some evidence of a decrease) after K ≈ 20. Again, models with alignment provide systematically better density estimation performance
17
0.22 No alignment Alignment, M = +−2 Trivial Prediction
Mean Squared Error
0.2
0.18
0.16
0.14
0.12
0.1 2
4
6
10 # of clusters
20
30
40
50
Figure 7: Cross-validated MSE of one-step-ahead prediction on gene expression data.
Relative loss in logP, per−curve
0
−0.5
−1
MLE, M=+−2 Gibbs Sampler, common σ, MAP cov, M=+−2 −1.5 60
100
140 180 250 Training data size
350
450
550
Figure 8: Average improvement in out-of-sample logP scores for various training sample sizes using Bayesian estimation on gene expression data with K=10. (as measured by logP) than those models that do not. Figure 7 shows the cross-validated mean squared-error of predicting every measurement within each observed curve, given previous measurements up to the time of prediction. As shown, the models with time-shift alignment lead to a reduction in prediction error. There was little difference in the prediction quality of the models with M = ±2 and M = ±1. We also evaluated the impact of using priors on the quality of the solution as a function of the size of the training data. Figure 8 shows the average decrease in logP score on a validation set for models trained on sub-samples of the full gene expression data set. The numbers are presented relative to the logP score of the best model trained on the full data set. Figure 8 shows the performance of two models, both with K = 10 and maximum time shift M = ±2. The first model was fit using maximum likelihood estimation while the second one was fit using MAP estimates obtained by the Gibbs sampling approach described in Section 5. Each point on the 18
plot is an average decrease in the logP score over 10 different train/validation splits. For a single fixed validation set of size n = 200 curves, we incrementally created training sets ranging in size from 60 to 600 curves, so that each training set contains all training sets of smaller sizes. The x-axis indicates the amount of data that was used for training while the y-axis indicates the difference in logP score (relative to the best model overall) due to limited training data. The results show that the Bayesian methods provide systematically better density estimation performance. The improved performance is particularly noticeable at very small sample sizes agreeing with our general intuition about Bayesian estimation. We have also performed experiments on two other gene expression data sets described in [33]. These data sets include measurements of the same set of genes but under a different set of initial conditions. On these data sets, we see similar improvements in terms of logP scores for small to medium values of K (e.g., up to 20 or so). For larger values of K there is still a systematic improvement due to time-shifting, albeit a smaller improvement than that obtained in Figures 6 and 7.
9
Cyclone Clustering
We also applied our methodology to clustering of ETC (Extra-Tropical Cyclone) tracks or trajectories obtained from gridded records of sea-surface pressure data over time. Atmospheric scientists are interested in the spatio-temporal patterns of evolution of ETCs for a number of reasons. For example, it is not well-understood how long-term climate changes (such as global warming) may influence ETC frequency, strength, occurrence and spatial distribution. Also of concern is how changes in ETC patterns may in turn influence long-term climatic processes. Much work in this area is spent on the identification and tracking of ETCs which results in a set of cyclone trajectories. The trajectories consist of sequences of latitude, longitude, and intensity tuples observed over time. Clustering is usually performed on just the latitude-longitude position measurements over time. For example, Blender et al. [3] convert the two-dimensional lat-lon trajectories into fixed-dimensional vectors for clustering by the K-means algorithm. In our prior published work on this data we have focused on parametric model-based regression mixtures with no translation modelling [13, 14]. This prior work has not addressed the problem of simultaneously aligning and clustering cyclone trajectories. As was shown earlier in Figure 1, this is an important concern.
9.1
Dataset and Experimental Setup
The cyclone dataset used in this paper consists of 614 cyclones tracked over the North Atlantic (see [13] for full details). Each trajectory consists of a variable length sequence of latitude, longitude, and intensity measurements observed over 6-hour intervals. Figure 9 shows some of the cyclones in this dataset mapped over the North Atlantic. 19
Figure 9: A subset of the North Atlantic cyclone trajectory data. It is hypothesized by atmospheric scientists that there are subgroups of cyclones, where each subgroup has distinct dynamic behavior [3]. This suggests clustering the cyclones in latitude-longitude space to capture similar spatial patterns, and clustering in intensity space to capture similar intensification patterns over time. To achieve some degree of translation invariance in lat-lon space, clustering of storm trajectories in the atmospheric science literature is typically carried out by subtracting the first lat-lon observation of each cyclone from its entire trajectory (e.g., [3]), which we will refer to as first-observation alignment (in measurement space). This can be problematic if the cyclones themselves are shifted in time. Shifts in time cause cyclones to be aligned to incorrect starting observations since the observed starting measurements are not the actual starting observations. The methodology proposed in this paper allows for translation in time via time-shifts as well as for translation in the lat-lon measurements via measurement offsets. This alignment is carried out in a data-driven manner as an integrated part of the clustering process. Note that in the intensity measurement dimension for this data we allow for time-shifts, but we do not allow intensity measurement offsets since there is no a priori reason to believe that the intensities are offset relative to each other.
9.2
Cyclone Results
We compare the clustering performance of four different methods on the cyclone data: (1) standard Gaussian mixtures with simple first-observation alignment, (2) Gaussian mixtures where lat-lon measurement offsets are estimated via EM, (3) method 2 followed by a simple one-pass within-cluster time-shift alignment, and (4) joint clustering and alignment (in both time and measurement axes) using EM, as proposed in the paper. The one-pass alignment technique of Method 3 takes each of the returned clusters (in turn) from Method 2 and runs Method 4 (within each cluster with the number of clusters set to 1), separately aligning the clusters in time. For the purposes of presenting the figures we denote Method 1 as [−] (which denotes no alignments at all), Method 2 as [X, Y ] (which denotes separate offsets estimated for 20
−5.25 −5.3
average per−point logP
−5.35 −5.4 −5.45 −5.5 −5.55 −5.6 −5.65 Alignment [X,Y,T] Alignment [X,Y] [T] Alignment [X,Y]
−5.7 −5.75 3
4
5
6 # of clusters
7
8
9
Figure 10: Cross-validated logP scores on cyclone data. 50 Alignment [X,Y] Alignment [X,Y] [T] Alignment [X,Y,T]
45
Mean variance
40 35 30 25 20 15 10 3
4
5
6 # of clusters
7
8
9
Figure 11: Average within-cluster variance on cyclone data. 7 Trivial Prediction No Alignment Alignment [X,Y,T]
6.5
Mean Squared Error
6 5.5 5 4.5 4 3.5 3 2
3
4
5 6 # of clusters
7
8
9
Figure 12: Mean squared error of one-step ahead prediction on cyclone data 21
Translation in [X,Y]
Translation in [X,Y,T]
Cluster # 5
Cluster # 4
Cluster # 3
Cluster # 2
Cluster # 1
Conventional Mixture
Figure 13: Clustering results for standard mixture of Gaussians (column 1), mixture of Gaussians with lat-lon translation (column 2) and mixture with both measurement and time axes alignment (column 3)
22
both the latitude and longitude measurement dimensions, i.e. X and Y ), Method 3 as [X, Y ], [T ] (which denotes measurement offsets are first estimated simultaneously in latitude and longitude space during clustering, and then followed by estimation of time-shifts after clustering), and Method 4 as [X, Y, T ] (which denotes alignments that are simultaneously estimated in latitude, longitude, and time, all during clustering). Figure 10 shows a plot of logP scores for these methods. The scores are obtained using 10-fold cross-validation with the number of clusters varied from 3 to 9. All methods are allowed 10 random starts of EM at each fold and initialization is carried out by selecting K random curves as the initial K cluster means. Method 1 performed poorly enough that its logP scores are not included in the figure. Method 2 performs much better than Method 1 because of its data-driven alignment in measurement space. Method 3 improves on Method 2 by taking the curves within each cluster in Method 2 and aligning them in time. Finally, the “full” joint clustering and alignment method (Method 4) systematically outperforms all of the others. Of note, is that our proposed method 4 results in a higher score at K = 3 than the standard method (method 1) even when it is allowed to reach K = 9. Figure 11 shows the mean within-cluster variance for Methods 2, 3, and 4, over the same K-values, trained on all of the cyclone data. This plot again demonstrates the superior performance of Method 4 in that it finds the most compact clusters. Figure 12 shows a significant increase in one-step-ahead prediction accuracy for the cyclone trajectories, which is important in atmospheric science. To obtain each point on the plot, we used the model that was learned from the training data to make predictions of the test curve dynamics. We predicted the point on the curve at time t + 1 given the curve up to time t, for all test curves and all values of t, and averaged the mean squared prediction error. The prediction error achieved by the models can be compared to the solid line that shows the error of the trivial prediction (i.e., using the measurement at time t as a prediction for time t + 1). Figure 13 shows the types of clusters that each method discovers. The measured cyclone trajectories in lat-lon space, clustered and aligned by the corresponding algorithms, are shown by black curves; the thick white line in the center of each cluster corresponds to the estimated cluster mean curve. The results were obtained by running Methods 1, 2, and 4 on the complete set of cyclone data with the number of clusters set to 5. We display (from left-to-right) the five clusters from Method 1 in column one, those for Method 2 in column two, and Method 4 in column three. The elements in each column were chosen so as to line-up similar looking clusters across the rows. The clusters in column one all emanate from a common genesis point. This is due to the first-observation alignment enforced by Method 1. In contrast, Method 2 (column 2) allows for a data-driven alignment in measurement space and thus the clusters in column two seem more natural than those in column one. The full joint clustering and alignment of Method 4 appears to produce in even more compact and distinct clusters, as shown in column three. From this picture is reasonable to suggest that we are getting a clustering that is somewhat more interpretable from a scientific point-of-view.
23
10
Conclusions
In this paper we addressed the general problem of clustering multi-dimensional curve data where we allow for curve-specific shifts in both the independent variable (typically time) and the measurement variables. We proposed a general mixture model framework for this problem and demonstrated on two real-world data sets that the methodology systematically leads to lower variance clusters (compared to ignoring alignments), better predictions in terms of both density estimation and mean-squared error on unseen curves, and generally leads to more interpretable results (which is important from a scientific viewpoint). Space limitations prevented a full discussion of many other aspects of this problem. For example, it is quite easy to allow for multiplicative amplitude scaling using this same mixture framework and our experiments to date indicate that it also leads to systematically better clustering results. Nonlinear deformations, such as non-linear warping of the time-axis, are somewhat more difficult to handle; however, we believe that by extending our current mean curve model to a more general (but highly constrained) class of hidden Markov models we can handle a large class of time-warping deformations in a systematic probabilistic manner. We hope to report on these extensions in future work.
24
Appendix Appendix I: E and M step equations In this section, we provide the E and M step equations used to find maximum likelihood estimates of parameter values for model specified by Equations 1 through 5. We use the same notation as introduced in Section 4. Wherever appropriate, we drop the normalizing constants in the equations, and specify distributions up to some constant of proportionality. E-step During the E-step, we estimate for each observed curve Xi the distribution of the latent variables Zi (cluster membership) and ϕi (amount of shifting), given current estimates of the parameters Θ = {α, γ, µ, C}: P (Zi = k, ϕi = m|Yi , Θ). For simplicity of notation, we denote P (Zi = k, ϕi = m|Yi , Θ) by P (k, m|Yi , Θ). P (k, m|Yi , Θ) ∝ P (Yi |k, m, Θ)P (k, m|Θ) = αk γk,m
D �
P (Yid |k, m, Θ)
(12)
d=1
The conditional likelihood of observation Yid is given by �
�
P (Yid |k, m, Θ) = N Yid − δid (k, m)|µdk (am : am + Li − 1), Ckd (am : am + Li − 1) (13) d where δi (k, m) is the optimal offset as in Equation ( 5). The value of the offset can be found analytically: δid (k, m) =
Li � � 1 � Yid (j) − µdk (am + j − 1) Li j=1
(14)
M-step In the M-step, one finds the parameter values that maximize the expected loglikelihood with respect to the distribution of the latent variables. �N �M m=0 P (k, m|Yi , Θ) α ˆ k = �K i=1 �N �M k=1
i=1
�N
γˆk,m = �M
i=1
m=0
µ ˆdk (j)
m=0
P (k, m|Yi , Θ)
P (k, m|Yi , Θ) i=1 P (k, m|Yi , Θ)
�N
M � � 1 = Yid (j − am + 1)P (k, m|Yi , Θ) P (k, j) m=0 i:am ≤j≤bi
(15)
(16) (17)
m
Cˆkd (j, j) =
M � �2 � � 1 Yid (j − am + 1) − µ ˆdk (j) P (k, m|Yi , Θ) P (k, j) m=0 i:am ≤j≤bi m
25
(18)
where P (k, j) is the total probability mass of points at position j within cluster k: P (k, j) =
M �
�
P (k, m|Yi , Θ)
m=0 i:am ≤j≤bim
and bim is the rightmost point on the grid for curve i given alignment m: bim = am + Li − 1 .
26
(19)
Appendix II: Bayesian smoothing and MAP estimates of parameter values in the EM algorithm There are two steps involved in parameter estimation when we use a Bayesian hierarchical model: 1. Updating and sampling from the posterior distribution of hyperparameters, given data and current estimates of component parameters; 2. Finding MAP estimates of the component parameters, given data and current values of hyperparameters. Updating the posterior distribution on hyperparameters In what follows, we assume the following parametric form for the hyperprior Gamma distribution Γ(A, B): P (x|A, B) =
B A A−1 x exp − x Γ(A) B
(20)
First, we show how to estimate the posterior probability of the variance σ 2 of the normal distribution that links together two consecutive cluster means. In what follows, we assume that the variances σ 2 are the same for all clusters, and we pull together the differences between consecutive means in all clusters to estimate the parameters of its posterior distribution. The equations below can be easily modified to handle the case of a single value of the variance per cluster. To find the posterior conditional distribution P (ν|Y, Θ) of the hyperparameters ν = σ12 , we note that it is independent of the actual data: P (ν|Y, Θ) ∝ P (Y|ν, Θ)P (ν|Θ) = P (Y|Θ)P (ν|Θ) ∝ P (ν|Θ)
(21)
since the likelihood of the data is defined by Θ only and is independent of ν. Moreover, the distribution of ν only depends on current estimates of the cluster means: P (ν|Θ) ∝ P (µ, C, α, γ|ν)P (ν) ∝ P (µ|ν)P (ν)
(22)
since C, α and γ are a priori independent of ν. Since P (µ|ν) is a multivariate normal distribution, and P (ν) is a Gamma distribution, we can use the conjugacy property and find that the posterior conditional distribution of ν d is also a Gamma distribution. We allow the hyperparameters to be independent for each of the D different dimensions of observed curves, and obtain the following parameter update equations: ˆ d) P (ν d |Y, Θ) = Γ(Aˆd , B
(23)
1 Aˆd = Ad + (K ∗ (T − 1)) 2
(24)
27
ˆd = B
1 1 Bd
+
�K
(25)
2
k=1
�T −1 (µdk (t+1)−µdk (t)) 2
t=1
Finding MAP estimates of the component parameters In this section, we describe how to find MAP estimates of the component parameter values, given fixed values of hyperparameters. It is known that the MAP estimates can be found by an EM algorithm, which optimizes the expected posterior parameter probability (rather than the expected likelihood) with respect to the distribution of latent variables at the M-step. Thus, we augment the objective function to be optimized at the ith iteration of the EM Φ(Θ) by the log prior: Φ(Θ) = E[p(Z,ϕ|Θi−1 )] (P (Y|Θ)) + log(Θ) We assume that the prior factorizes as shown in Equation 6, and thus the estimates of cluster and shift probabilities are found as standard MAP estimates of the corresponding Dirichlet distribution, independently of all other parameters. It is easy to obtain closed form expressions for parameter values when performing maximum likelihood estimates: all parameters can be estimated independently from one another. When we introduce dependence between the consecutive means, the derivatives with respect to cluster centers are coupled: M �
∂Φ(Θ) = ∂µdk (j)
�
�
�
Yid (j − am + 1) − µdk (j)
m=0 i:am ≤j≤bim µdk (j + 1) − µdk (j) 2 [σkd (j + 1)]
+
P (k, m|Yi , Θ)
Ckd (j) +
µdk (j) − µdk (j − 1) 2
[σkd (j)]
(26)
The expressions for the derivative with respect to the variances within the clusters remain independent from one another given the values of the means. As before, we assume that the precision C d1(j) is a priori a Gamma distribution with parameters Ckd (j)
k
Gd and F d :
�
P
1 d Ck (j)
�
∝ Γ(Gd , F d )
(27)
Setting the derivatives of the posterior with respect to the variances to zero yields the following expression for the variance Ckd (j) given the value of the cluster mean µdk (j):
Ckd (j) =
2 Fd
+
�M
m=0
�
�
i:am ≤j≤bim
�2
Yid (j − am + 1) − µdk (j) P (k, m|Yi , Θ)
P (k, j) + 2 ∗ (Gd − 1) 28
(28)
Note that setting derivatives with respect to the cluster means to zero (Equation 26) leads to a non-linear system of equations with a tri-diagonal structure: every equation mentions the means at the two neighbor points (except for the points at the beginning and the end of the curve). However, if we assume the values of the variances Ckd (j) to be fixed, the system reduces to a linear system whose coefficients and solution can be obtained in time linear with respect to the number of variables (i.e. cluster means). This leads to an iterative procedure for finding the MAP estimates of cluster means and variances: 1. Initialize the MAP estimates with maximum likelihood estimates; 2. Find the values of the cluster means assuming the variances are fixed; cluster means are found by solving a linear tri-diagonal system of equations obtained by setting derivatives (26) to zero; 3. Update the values of the variances according to (28) so that the corresponding derivatives are set to zero; 4. Repeat steps 2 and 3 until convergence. In practice we have found that this iterative procedure converges within the first few iterations to a fixed point, and thus yields a highly efficient M-step.
29
References [1] J. Aach and G.Church. Aligning gene expression time series with time warping algorithms. BIOINF: Bioinformatics, 17, 2001. [2] J. D. Banfield and A. E. Raftery. Model-based Gaussian and non-Gaussian clustering. Biometrics, 49:803–821, 1993. [3] R. Blender, K. Fraedrich, and F. Lunkeit. Identification of cyclone-track regimes in the North Atlantic. Quart J. Royal Meteor. Soc., 123:727–741, 1997. [4] H. Chui, J. Zhang, and A. Rangarajan. Unsupervised learning of an atlas from unlabeled point-sets. IEEE Trans. Pattern Analysis and Machine Intelligence, submitted, 2003. [5] R. G. Cowell, A. P. Dawid, S. L. Lauritzen, and D. J. Spiegelhalter. Probabilistic Networks and Expert Systems. Springer, New York, 1999. [6] A. P. Dempster, N. M. Laird, and D. B. Rubin. Maximum likelihood from incomplete data via the EM algorithm. J. Royal Stat. Soc. B, 39:1–38, 1977. [7] W. S. DeSarbo and W. L. Cron. A maximum likelihood methodology for clusterwise linear regression. Journal of Classification, 5(1):249–282, 1988. [8] J. Diebolt and C. P. Robert. Estimation of finite mixture distributions through Bayesian sampling. Journal of the Royal Statistical Society B, 2:363–375, 1994. [9] M. B. Eisen, P. T. Spellman, P. O. Brown, and D. Botstein. Cluster analysis and display of genome-wide expression patterns. Science, 95(25):14863–68, 1998. [10] C. Fraley and A. E. Raftery. Model-based clustering, discriminant analysis, and density estimation. Journal of the American Statistical Association, 97(458):611– 631, 2002. [11] B. J. Frey and N. Jojic. Transformation-invariant clustering using the EM algorithm. IEEE Trans. Pattern Analysis and Machine Intelligence, 25(1):1–17, January 2003. [12] S. Gaffney and P. Smyth. Trajectory clustering with mixtures of regression models. In Surajit Chaudhuri and David Madigan, editors, Proceedings of the Fifth ACM SIGKDD International Conference on Knowledge Discovery and Data Mining, pages 63–72, N.Y., August 15–18 1999. ACM Press. [13] S. J. Gaffney, A. Robertson, and P. Smyth. Clustering of extra-tropical cyclone trajectories using mixtures of regression models. In Seventh ACM SIGKDD International Conference on Knowledge Discovery and Data Mining, Fourth Workshop on Mining Scientific Datasets, 2001.
30
[14] S. J. Gaffney and P. Smyth. Curve clustering with random effects regression mixtures. In C. M. Bishop and B. J. Frey, editors, Proceedings of the Ninth International Workshop on Artificial Intelligence and Statistics, Key West, FL, January 3–6 2003. [15] S. Gold, A Rangarajan, C.-P. Lu, S. Pappu, and E. Mjolsness. New algorithms for 2D and 3D point matching: pose estimation and correspondence. Pattern Recognition, 31(8):1019–1031, 1998. [16] S. Gold, A. Rangarajan, and E. Mjolsness. Learning with preknowledge: Clustering with point and graph matching distance measures. Neural Computation, 8(4):787–804, 1996. [17] J. A. Hartigan and M. A. Wong. Algorithm AS 136: a K-means clustering algorithm. Appl. Stat., 28:100–108, 1978. [18] G. M. James and C. A. Sugar. Clustering for sparsely sampled functional data. Journal of the American Statistical Association, to appear, 2003. [19] P. N. Jones and G. J. McLachlan. Fitting finite mixture models in a regression context. Austral. J. Statist., 34(2):233–240, 1992. [20] A. Kneip and T. Gasser. Statistical tools to analyze data representing a sample of curves. Annals of Statistics, 20(3):1266–1305, 1992. [21] N. M. Laird and J. H. Ware. Random effects models for longitudinal data. Biometrics, 38:963–974, 1982. [22] P. J. Lenk and W. S. DeSarbo. Bayesian inference for finite mixtures of generalized linear models with random effects. Psychometrika, 65(1):93–119, 2000. [23] J. S. Liu. Monte Carlo Strategies in Scientific Computing. Stats. Springer, 2001. [24] J. Mateos, A. Katsaggelos, and R. Molina. A Bayesian approach for the estimation and transmission of regularization parameters for reducing blocking artifacts. IEEE Transactions on Medical Imaging, 9(7):1200–1215, July 2000. [25] G. J. McLachlan and K. E. Basford. Mixture Models: Inference and Applications to Clustering. Marcel Dekker, New York, 1988. [26] G. J. McLachlan, R. W. Bean, and D. Peel. A mixture model-based approach to the clustering of microarray expression data. Bioinformatics, 18(3):413–422, March 2002. [27] E. U. Mumcuoglu, R. M. Leahy, and S. R. Cherry. Bayesian reconstruction of PET images: methodology and performance analysis. Phus. Med. Biol., 41:1777– 1807, 1996. [28] R. M. Neal. Bayesian Learning for Neural Networks. Number 118 in Lecture Notes in Statistics. Springer, New York, USA, 1996. 31
[29] J. O. Ramsay and X. Li. Curve registration. J. Royal Stat. Soc. B, 60:351–363, 1998. [30] J.O. Ramsay and B. W. Silverman. Functional Data Analysis. Springer-Verlag, New York, NY, 1997. [31] S. Richardson and P. J. Green. On Bayesian analysis of mixtures with an unknown number of components (with discussion). Journal of the Royal Statistical Society, Series B, 59(4):731–792, 1997. [32] P. Smyth. Model selection for probabilistic clustering using cross-validated likelihood. Statistics and Computing, 10(1):63–72, 2000. [33] P. T. Spellman, G. Sherlock, M. Q. Zhang, V. R. Iyer, K. Anders, M. B. Eisen, P. O. Brown, D. Botstein, and B. Futcher. Comprehensive identification of cell cycle-regulated genes of the yeast Saccharomyces cerevisiae by microarray hybridization. Molec. Biol. Cell, 9(12):3273–3297, December 1998. [34] K. Wang and T. Gasser. Alignment of curves by dynamic time warping. Annals of Statistics, 25(3):1251–1276, 1997. [35] K. Wang and T. Gasser. Synchronizing sample curves nonparametrically. Annals of Statistics, 27:439–460, 1999. [36] K. Y. Yeung, C. Fraley, A. Murua, A. E. Raftery, and W. L. Ruzzo. Model-based clustering and data transformations for gene expression data. Bioinformatics, 17(10):977–987, 2001.
32