BIOINFORMATICS APPLICATIONS NOTE Phylogenetics
Vol. 28 no. 20 2012, pages 2689–2690 doi:10.1093/bioinformatics/bts492
Advance Access publication August 20, 2012
treePL: divergence time estimation using penalized likelihood for large phylogenies Stephen A. Smith1,* and Brian C. O’Meara2 1
Department of Ecology and Evolutionary Biology, University of Michigan, Ann Arbor, MI, 48109 and 2Department of Ecology and Evolutionary Biology, University of Tennessee, Knoxville, TN, 37996 USA
Associate Editor: David Posada
ABSTRACT
2
Summary: Ever larger phylogenies are being constructed due to the explosion of genetic data and development of high-performance phylogenetic reconstruction algorithms. However, most methods for calculating divergence times are limited to datasets that are orders of magnitude smaller than recently published large phylogenies. Here, we present an algorithm and implementation of a divergence time method using penalized likelihood that can handle datasets of thousands of taxa. We implement a method that combines the standard derivative-based optimization with a stochastic simulated annealing approach to overcome optimization challenges. We compare this approach with existing software including r8s, PATHd8 and BEAST. Availability: Source code, example files, binaries and documentation for treePL are available at https://github.com/blackrim/treePL. Contact:
[email protected] Supplementary information: Supplementary data are available at Bioinformatics online.
2.1
Received on April 14, 2012; revised on July 31, 2012; accepted on August 1, 2012
1 INTRODUCTION Divergence times make phylogenetic hypotheses easier to interpret in light of other information on geology, biogeography and co-diversification. A number of methods exist for transforming branch lengths to be proportional to time. However, many of these methods do not scale well for phylogenies with thousands of taxa. The number of species included in published phylogenies has exploded (Goloboff et al., 2009; Smith et al., 2009). With the increase in the size of phylogenies, there is the need to develop divergence time methods that are capable of handling larger datasets. Here, we present a method, implemented in the software treePL, for calculating divergence time estimates using penalized likelihood (Sanderson, 2002) on large phylogenies. Penalized likelihood uses a semi-parametric approach that allows for different rates on different branches but has a smoothing parameter, set using cross-validation, that affects how much rate differences over the tree are penalized. Our approach attempts to overcome the problem of local minima, a problem amplified by including more taxa.
*To whom correspondence should be addressed.
METHODS Penalized likelihood
The optimality criterion used in this article is the penalized likelihood framework described in Sanderson (2002). Note that though this is framed as a likelihood method, it is possible to interpret this as a maximum a posteriori estimate in a Bayesian context given particular priors (Thorne and Kishino, 2005). It is also possible, following Sanderson’s modifications to r8s, to use a related penalty that uses the differences of log rates rather than differences of untransformed rates (the additive penalty). This has been implemented in treePL, but analyses below use the original additive penalty.
2.2
The algorithm
Divergence time estimation, and penalized likelihood especially, presents a number of optimization challenges. One challenge is the large number of parameters and the ratio of free parameters to observations. This can be dampened by a large penalty function, but still presents a parametric optimization problem. The second challenge is the presence of barriers placed by both the user and the hierarchical nature of phylogenies. We present a first step to overcoming these problems with extremely large phylogenies. Our algorithm includes two main phases: a greedy hill-climbing phase and a stochastic phase. This combination is meant to both speed optimization and avoid local optima. The greedy phase of the optimization step consists of two gradientbased optimization rounds. The first round of optimization uses gradient values from an exact gradient calculator with math derived from Sanderson (2002). The second round of optimization uses auto-differentiation (Gay, 2005; Griewank et al., 1996). Auto-differentiation, because it has the same complexity as the original function, often continues hill climbing after the exact gradient calculator fails. However, we have found, empirically, that alone it is not as efficient and requires more rounds and restarts than combining exact gradients and auto-differentiation. We found that a stochastic phase, in this case a partial simulated annealing procedure, is helpful in easing the parameters away from local optima. We consider it partial as the step does not consist of a full simulated annealing run. Instead, the phase consists of thousands of stochastic optimization generations followed by intermittent greedy phases. Although this additional step may lengthen convergence time, the result will often improve. The performance of optimization methods can vary dramatically by dataset. We have provided a ‘priming’ step that will run through each optimization option and report those that show the greatest difference in starting and stopping likelihood scores. Although this can help, researchers should replicate analyses and experiment with settings to assure convergence. We have also provided a ‘wiggle’ option that will report divergence times that are within two log likelihood units of the best likelihood, suggested by Edwards (1992) as a confidence window. This allows for the visualization of nodes that are particularly uncertain, but
ß The Author 2012. Published by Oxford University Press. All rights reserved. For Permissions, please e-mail:
[email protected]
Downloaded from https://academic.oup.com/bioinformatics/article-abstract/28/20/2689/203074 by University of Michigan user on 12 June 2018
2689
treePL
does not account for all sources of uncertainty (e.g. calibration uncertainty or branch length errors).
2.2.1 Cross-validation The penalized likelihood approach requires the identification of a smoothing parameter that affects the penalty for rate variation over the tree. A cross-validation procedure is used to determine the best smoothing parameter. We provide two options for cross-validation: leave one out cross-validation (LOOCV) and random subsample and replicate cross-validation (RSRCV). The LOOCV approach is described in Sanderson (2002) and requires iteratively removing each terminal node, recalculating rates and dates, and recording the error between the predicted value from the estimate and the observed value. RSRCV randomly samples, with replacement, multiple terminal nodes, recalculates rates and dates with these terminal nodes removed and calculates the average error over the sampled nodes. RSRCV replicates this procedure a number of times, with 10 times being typical. Potential sets of terminal nodes that cause the removal of internal nodes (such as a set of terminal nodes that form a clade) are not allowed. This procedure is much faster than LOOCV and produces similar results. Cross-validation can be unstable, but subsampling procedures such as RSRCV may improve this behavior (Kohavi, 1995). 2.2.2 Implementation The above algorithm is implemented in treePL, which is open source and available at https://github.com/blackrim/treePL. Auto-differentiation uses RAD (Gay, 2005; Griewank et al., 1996) on a single cores and ADOL-C for multiple cores. Likelihood calculations and cross-validation analyses may be distributed on multicore machines using the OpenMP library.
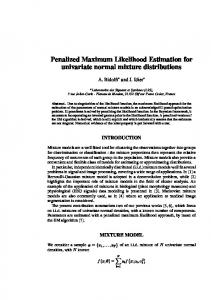
Fig. 1. The performance of r8s, treePL and PATHd8 on the simulated datasets as measured by R2 of estimated node ages against known ages. The inset shows average runtimes of r8s, treePL and PATHd8 in minutes on simulated datasets. Error bars represent 95% confidence intervals
ACKNOWLEDGEMENTS 3
SIMULATIONS
We test the performance of treePL, r8s and PATHd8 (Britton et al., 2007) on simulated datasets with up to 10 000 taxa. Two empirical examples, including comparisons to BEAST, may be seen in the Supplementary Materials, as can details of the simulations. To measure the performance of each method, we measured the R2 of the estimated node ages against the known node ages (Fig. 1). r8s and treePL perform quite similarly and both perform better than PATHd8. Some of the slight performance decrease of treePL as tree size increases may be explained by numerical error with treePL adding nonzero values to effectively zero branch lengths. The poor performance of PATHd8 for many of these trees may be a result of how it resolves conflicting dates and rates. In these cases, PATHd8 allows the conflicting branches to have the same height, thus sinking the branch to its parent, leading to a zero branch length. The time it took to run each analysis was also recorded (Fig. 1 inset). PATHd8 analyses are almost instantaneous. treePL is far fasterthanr8sbutslowerthanPATHd8.Nevertheless,r8sperforms wellforsmallerdatasets.TheruntimefortreePLishighlydependent on the nature of the dataset, the settings for the stochastic phase of the run, and the optimization method used for the greedy phase. Parallelization in treePL was not used for the simulation runs. The simulated analyses demonstrate that, at least under the particular settings of the simulator, r8s and treePL perform well with treePL being significantly faster than r8s (see Supplemental Materials for performance with empirical datasets). Both programs perform better than PATHd8 in terms of accuracy when compared with the ‘true’ simulated tree. The simulated analyses also demonstrate that divergence-time analysis with penalized likelihood is reasonable on trees of over 10 000 taxa.
The authors acknowledge the ‘Floral assembly’ working group at NESCent, helpful discussions with Michael Alfaro, Jeremy Beaulieu, Jonathan Eastman, and David Tank and treePL testers. Funding: National Evolutionary Synthesis Center (NESCent), NSF #EF-0905606. iPlant Collaborative NSF #EF-0735191 (to S.A.S.). Conflict of Interest: None declared.
REFERENCES Britton,T. et al. (2007) Estimating divergence times in large phylogenetic trees. Syst. Biol., 56, 741–752. Edwards,A.W.F. (1992) Likelihood. 2nd edn. Johns Hopkins University Press, Baltimore, MA. Gay,D.M. (2006) Semiautomatic differentiation for efficient gradient computations. In Bucker,H.M. et al. (eds) Automatic Differentiation: Applications, Theory, and Tools. Lecture Notes in Computational Science and Engineering. Springer, New York, NY, 147–158. Goloboff,P.A. et al. (2009) Phylogenetic analysis of 73060 taxa corroborates major eukaryotic groups. Cladistics, 25, 1–20. Griewank,A. et al. (1996) Algorithm 755: ADOL-C: a package for the automatic differentiation of algorithms written in C/Cþþ. ACM Trans. Math. Software, 22, 131–167. Kohavi,R. (1995) A study of cross-validation and bootstrap for accuracy estimation and model selection. In Proceedingsof the 14th International Joint Conference on A.I.. Vol. 2, Morgan Kaufmann Publishers Inc. San Francisco, CA, USA, Canada, pp. 1137–1143. Sanderson,M.J. (2002) Estimating absolute rates of molecular evolution and divergence times: a penalized likelihood approach. Mol. Biol. Evol., 19, 101–109. Smith,S.A. et al. (2009) Mega-phylogeny approach for comparative biology: an alternative to supertree and supermatrix approaches. BMC Evol. Biol., 9, 37. Thorne,J.L. and Kishino,H. (2005) Estimation of divergence times from molecular sequence data. In Nielsen,R. (ed.) Statistical Methods in Molecular Evolution. Springer-Verlag, New York, pp. 233–256.
2690 Downloaded from https://academic.oup.com/bioinformatics/article-abstract/28/20/2689/203074 by University of Michigan user on 12 June 2018