TreeVersity: Interactive Visualizations for Comparing Hierarchical Datasets John Alexis Guerra-Gómez University of Maryland, College Park CATT Laboratory & Human Computer Interaction Lab 301.405.0722
[email protected]
Audra Buck-Coleman University of Maryland, College Park Department of Art 301.405.1458
[email protected] Michael L. Pack University of Maryland, College Park Center for Advanced Transportation Technology Laboratory 301.405.0722
[email protected]
Catherine Plaisant University of Maryland, College Park Human Computer Interaction Lab 301.405.6707
[email protected] Ben Shneiderman University of Maryland, College Park Human Computer Interaction Lab Department of Computer Science 301.405.2680
[email protected]
Corresponding Author: John Alexis Guerra-Gómez Word Count: 4,999 + 10 figures = 7,499 words
Abstract Transportation datasets of all kinds are hierarchical in nature, and therefore easily represented in tree structures. Visually comparing the changes in these hierarchical datasets over time can be extremely difficult, even when the trees are relatively small. TreeVersity is a novel interactive visualization that allows users to detect and analyze changes in the structure and value of various components of the tree. TreeVersity uses dual comparison techniques (side-by-side and explicit differences) coupled with a tabular representation to help users understand and explore changes to the tree over time. It uses carefully selected color palettes to show positive/negative, absolute and relative value changes; and glyphs that preattentively show these changes. This paper illustrates the value of this visualization through several short case studies using Federal transportation budget data, airline maintenance budgets, transportation publication data, and hypothesizes about TreeVersity’ s relevance for future congestion trend analysis. Video demonstrations of this research can be viewed at http://tinyurl.com/treeversity
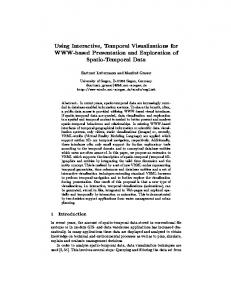
Figure 1: TreeVersity comparison interface. On the top are the two original trees being compared (budgets for 2011 and 2012). At the bottom the DiffTree shows the amount of change for each node. The glyph called "the bullet" points up to denote increase.
Introduction Hierarchies like those shown in Figure 2↓, help us organize and understand information. Many have researched visualizing, navigating and understanding tree structures. Techniques such as node link representations [37], TreeMaps [25], Radial representations [8] and Icicle trees [26] are now often used in scientific and non-scientific publications. However, visualizing just a single tree representing a snapshot in time has limitations. Significantly less research has been conducted on how to compare tree structures that change over time.
Figure 2: Example datasets viewed as hierarchies
Users might find themselves asking:
Where are the significant gains and losses in a complex budget proposal?
How and where has congestion changed both nationally and locally?
How have airline maintenance budgets shifted from year to year, and have those changes affected safety?
The answers to these questions could be visualized though the identification of change on each node—the individual elements of the tree, each having a type (e.g. State), a name (e.g. Maryland), and a value (e.g. a budget of US$200 Million dollars for the State). These changes can be of two types: topological differences (e.g. what nodes appear, disappear or move), and node attribute value differences (increases and decreases). Most related work has focused on one or the other type of change, but not both. Despite the substantial work on topological differences between trees, none of these solutions addresses the problem of comparing changes in node values. Thus, we propose TreeVersity, a
novel tree comparison tool able to address differences in both node values and changes in topology. In this paper, we extend our work described first from the design perspective in [18]. We present it now from an Information Visualization point of view, with significant improvements such as new filtering techniques (DiffScatterPlot see Section 3.4.1↓), animated transitions to reuse screen space, colored table nodes for easy ranking and matching, and support for moved nodes. The contributions of our work include:
Design and implementation of TreeVersity, an interactive information visualization tool for comparing trees by looking at changes both on topology and node value differences (Tree comparison Types 0,1,2,3,4 see section 1.1↓)
Application of the tool using three different data domains, Federal transportation budget data, airline maintenance budgets and transportation publication data.
Design and implementation of the Bullet, a visualization glyph that allows the representation of five dimensions of tree node change, including direction of the change (positive, negative or neutral), absolute differences, percentage changes, change relative to other nodes, and topological differences (created, removed and moved nodes).
Usability experiment that suggests that users are able to understand and explore all the five dimensions of tree node change on an example tree comparison using TreeVersity.
The rest of the paper is organized as follows: First we define the types of tree comparisons addressed by TreeVersity. Then, we present TreeVersity and offer detailed explanations of its different components. Next we present three brief transportation hierarchical datasets from which important information can be gleaned through the use of TreeVersity. We describe a usability study that show that users where able to understand this types of differences using our system without previous training.
Tree Comparison Types Much work has been done on visualizing [25, 26, 27, 38] and exploring [37, 19, 6] single tree structures; however, the problem of comparing two trees is significantly harder. We have identified and classified the following types of tree comparison (Figure 3↓) :
Type 0: Topological differences between two trees where the nodes only contain a label. Example: Finding created, moved and removed topics between two versions of
the TRB research publications hierarchical categorization system, without looking for number of papers.
Type 1: Positive and negative changes in leaf node values with aggregated values in the interior nodes (i.e. trees that can be visualized with a treemap[25]) and no changes in topology. Example: Comparing the change on the number of workers on the traffic agencies of the country, grouped by Agencies, Counties and Regions, given that no Agencies are created or removed.
Type 2: Positive and negative changes in leaves and interior node values with no changes in topology. Example: Comparing the salaries in the Department of Transportation’s organizational chart between two years, when no reorganization has occurred.
Type 3: Positive and negative changes in leaf node values with aggregated values in the interior nodes and with changes in topology. Example: Again finding changes in the TRB research publications hierarchical categorization system, but looking at changes in the number of papers published by topic and at created, removed nodes.
Type 4: Positive and negative changes in leaves and interior node values, with changes in topology. Example: Comparing the number of TRB’s website visits between two months using the file hierarchy as a natural organization. Some pages might be created or removed, and each page in the hierarchy has an independent number of visits.
Figure 3: Types of tree comparison problems. Current literature has addressed Types 0 and 1, with only one attempt at Type 3 [46]. TreeVersity supports all five cases, with emphasis on Types 1-4, the ones that include node value changes.
Dimensions of node changes According to related work and our own research, analysts that want to perform these types of tree comparisons want to be able to find and understand the following dimensions of tree node changes:
Direction of change: positive, negative or neutral (no change).
Absolute change: the actual amount of change, e.g. the Department of Transportation budget will be decreased by 5.99 billion dollars between 2012 and 2013.
Percentage change: the absolute change with respect to the original value, such as the cut in the Department of Transportation represents a 1.32% decrease with respect to its budget in 2012.
Relative change: how does a node change compare to the changes of other nodes in the tree, e.g. The cut in the Department of Transportation ($-5.99 Billion, -1.32%) will be considerably smaller than the expected decrease in the Department of Labor’s budget ($-52.66 Billion, -29.84%).
Topology change: Nodes that are created, removed, or moved. e.g. The Bureau of Engraving and Printing ($140 million dollars) is scheduled to be removed from the Department of Treasury on 2013.
Researchers have proposed a significant number of solutions for comparing trees on topology (Type 0) [9, 37, 11, 13, 16, 42, 1, 23, 2, 32, 34, 36, 15, 31, 7, 28, 14, 17, 5] or for visualizing changes in node values with aggregated values in the interior nodes (Type 1). Only one project [46] has attempted combining both types of differences at the same time (Type 3). For a more comprehensive description of the related work please refer to [47].
TreeVersity TreeVersity is a tree comparison tool that tackles a richer set of problems by combining a novel visualization technique, interface design with coordinated views, interaction techniques and comparison algorithms to support all five types of tree comparisons. TreeVersity was developed using Java and the Prefuse visualization library [48]
Interface design TreeVersity combines juxtaposition and aggregation techniques [30] along with interconnected views (Figure 1↑). The top of TreeVersity shows a side-by-side comparison of the two original trees. Below them a third aggregated view called DiffTree shows the differences between the original trees. The three views are interconnected: selecting one node highlights and centers the two other corresponding nodes in the other views.
TreeVersity also displays the differences between trees in a tabular representation (at the top left of Figure 1↑). The table lists all the nodes currently displayed, also with tightly coupled highlighting. The columns include the name of the node, level in the tree, and absolute and relative differences of each attribute. Sorting columns allows the rapid selection of nodes with extreme values (e.g. largest relative difference).
Visualization Technique The compared trees seen in the top of Figure 4 use rectangular icons with color and size redundantly representing the attribute values of each node. To build the DiffTree seen in the bottom of Figure 4, TreeVersity computes the difference in all the attributes for each original node. A positive difference indicates that the value on the right is larger than the one on the left. A node present on the left but not on the right is considered a removed node and its value in the DiffTree will appear as negative, assuming the value of absent nodes as zero. Users can filter out specific nodes by differential amounts and/or by topological characteristics (created, removed or present in both trees). The nodes are sorted according to the amount of change (absolute or relative). The DiffTree (seen in the lower half of Figure 4) uses a novel glyph visualization—the Bullet—to represent differences between the two original trees. The Bullet glyph encodes the cardinality of the change, the amount of change, and the creating/deletion. The shape’s direction represents the cardinality of the change: down for negative and up for positive in the vertical layout and left for negative and right for positive in the horizontal layout. The bullet size represents the amount of change. Color is used to encode both the cardinality and amount of change in the nodes. Users can select from preset color palettes that are binned in five steps to ease differentiation and accommodate visual preferences. The colors in the DiffTree are deliberately different from those in the original trees because they usually need very different value ranges. Gray rectangles represent nodes where the amount of change is zero. Finally, thick black or white borders are added around the bullet to denote removed or newly created nodes (white for added nodes, black for removed). By default both size and color are redundantly encoding the absolute amount of change (e.g. the amount in dollars in the case of a budget), but users can switch to relative change (i.e. percent change), or assign color and size to different characterization of the changes.
Tree #2
Tree #1
DiffTree
Bullets
Created Node
Removed Node Figure 4: DiffTree construction. For each node, a “bullet” is created in the DiffTree whose size represents the absolute change and the color the relative change on it.
Filtering Users can filter the nodes by topological change, by range of values, and by maximum depth. Topological change allows users to see only the nodes that were created, or removed, or that are present on both trees. With the filter-by-node-variables range, users can keep visible only nodes whose values fall within a specific range, using an absolute or relative amounts of change. Finally, the filter by maximum depth hides all the nodes that are deeper than a specified maximum depth. Another way of filtering uses a visualization called the DiffScatterPlot, seen in the callout of Figure 5, which lays out in a scatter-plot the summary of all the changes in the tree distributing dots according to their absolute amount change on the yaxis, and to their percentage of change in the x-axis. Users drag a bounding rectangle with the mouse to select nodes of interest. This technique is especially useful for selecting outliers.
After the filtering operation, any nodes that do not fit the new selection criteria will be hidden from all the views (including the table). Through animation, the empty space is reclaimed for the remaining nodes, making better use of screen.
Overview All three visualizations offer panning and zooming options for navigation. When analyzing trees with thousands of nodes, a zoomed out (macro) view of the whole tree can produce a cluttered mass of nodes. To reduce clutter, TreeVersity distributes the distance between the layers of nodes to fit the screen. This option is especially useful to understand the structure of the compared trees and of the DiffTree.
Navigation Users can focus on a subtree comparison. This is done by double clicking on the root node of the subtree of interest. After navigating into a subtree all the views will be updated to display only the nodes on it; this is particularly useful in de-cluttering the screen. A navigation panel records navigated nodes and allows users to return to a previously navigated state.
Use Case 1: Airline Maintenance Budgets TreeVersity was used to analyze the changes in maintenance budgets of different airlines that operate in the US. The dataset, provided by the U.S. Dept. of Transportation, contained the reported amount of money spent by the airlines for maintenance by quarters and years, and included attributes such as the regions where the airlines operate and their net incomes. Two hierarchies where built at the request of the DOT analysts: first grouping the airlines by region of operation (A: Atlantic, L: Latin America, D: Domestic, P: Pacific, I: International) and then by the carriers. Then the tree was flipped. A total of 67 carriers were compared between 2011 and 2010. The analysts started by asking which airlines changed their budget the most when grouped by regions, so using the DiffScatterPlot, TreeVersity filtered those changing the most, both in absolute and in percentage differences. After the filter, only 8 out of the 67 carriers remained (see Figure 5). Looking at these airlines, it was immediately apparent that PSA and Compass Airlines were big outliers in their percentage changes, with +305.86% and +230.96% respectively. The analysts realized that both companies had been involved in mergers which would be a likely explanation for the big increase. One analyst commented that "It’s great that we could identify this airlines..." and "... if it weren’t for this visualization we wouldn’t have noticed this". They also complimented the aesthetic quality of the framework’s design.
DOT analysts also noted that Delta and Southwest Airlines presented significant absolute increases, and that American Airlines was the biggest decreasing carrier. They then noted that it would be beneficial to compare the maintenance budgets by aircraft type to see how expenditures for Boeing 747 and 767compared to Airbus or other manufacturers. A Multidimensional In-depth Long-term Case Study [40] is being planned with the DOT staff to measure insight development using TreeVersity in their datasets over a longer period of time.
Outliers
Figure 5: Airlines that change their maintenance budget the most between 2011 and 2010 by region. Airlines were filtered by those that incremented their budgets in more than $27,000 or more than 200% or that reduced their budgets in more than $13,500. The budgets are grouped by regions, the nodes at the first level in the tree. D stands for Domestic and A for Atlantic. The values in the regions represent the average amount of change in all the airlines in that region. The root node shows the average overall.
Application Case 2: Change in passengers flying from US Airports A second case study was performed on a dataset containing the total number of enplanements (number of passengers boarding planes) in each U.S. Airport, by state and by month. The data
provided by the Bureau of Transportation Statistics contained 65,535 records from 1990 to 2003. The hierarchies for each year were grouped by Month, State, and Airport. Figure 6 (top) shows the DiffTree of the year 2000 compared to 2001 by Month and then by State. The nodes in the tree are sorted by the absolute amount of change, and color is used for the change in percentage with respect to 2000. The four dark subtrees on the left show the significant decrease on the number of enplanements that occurred from September to December due to the September 11th attacks and subsequent changes in flight regulations, while the months prior to the attack like January and August showed significant increases in enplanements. Performing a more in-depth analysis, Figure 6 (middle) shows the changes on the enplanements by State and then by Airport for the month of September only. The prominent yellow to red colors shows that decreases were reported by all States in almost all the Airports; however, some green nodes in the visualization reveal that even after 9/11, some Airports actually reported increases in their number of passengers boarding. Figure 6 (bottom) shows all the airports that reported increases over 300 passengers, with Minot (MOT) in North Dakota reporting on September 2001 an increase of more than 442% on the number of enplanements compared to the same month on 2000.
Application Case 3: National Transportation Library (NTL) Publication Data A third case study was developed analyzing NTL’s publications database including 52,135 papers published between 1968 and 2010. Initial explorations revealed that the number of papers published fluctuates significantly between consecutive years (The changes between years from 2001 to 2010 were +224, -621, +737, +289, -864, +1,724, -61, -529, +271, +1,379). In order to make a more representative comparison two periods of five years, 2001 to 2005 and 2005 to 2010 were chosen. The compared datasets included 5,566 papers published for the first five years and 10716 for the five years after. 962 papers didn’t include any author information, so, they appear as null authors in the visualizations. The papers were grouped by subject area and then by author. Only authors that published more than five papers per time period were considered to reduce the number of nodes on the trees that were in the order of 84,112 without the filtering.
Sept
Oct
Nov
Dec
Jun
May
Feb
Jul
Mar
Apr
Aug
Jan
Figure 6: Top: Change in number of passengers by month and State between 2001 and 2000, sorted by Absolute Change. Middle: California, Texas, Illinois, Florida and New York saw the biggest absolute decreases. Most airports decreased, but there are some showing increases (green edges). Bottom: Airports increasing in more than 300 passengers in September 2001 compared to September 2000. Airports like MOT in North Dakota, didn’t seem affected by 09/11, they reported an increase of 442%.
The overview of the publications subjects and authors on Figure10↓, show that most of the subjects presented increases in the second part of the decade, especially with respect to common subjects like "Highways". However some subjects like Geotechnology showed
decreases. While no subjects disappeared, there were four new topics, some of which have shown significant gains like "I15: Environment" with a total increase of 662 papers. Looking at the change on the level of the Authors by Subject, Figures 12↓13↓14↓ show the authors that decreased, increased and maintained their rate of production. For sake of maintaining anonymity, these author names have been covered up in these graphics.
Figure 7 Overview of the change in the number of publications subject and authors. The DiffTree shows that Highways is the subject area with the biggest number of authors.
Figure 8: Three DiffTrees showing subject area changes(Top), authors that are showing decreases in publications (middle), and authors that are showing significant increases in NTL publications (bottom).
Figure 9: DiffTree showing the most consistent research authors—people that published about the same number of papers (less than 80% change) between two 5-year periods: 2001 to 2005 and 2005 to 2010.
User Study In addition to the real-life use cases presented earlier, a user study was conducted with 8 participants to evaluate if users could understand the visual encodings and the basic interface organization of Treeversity without training. All participants correctly interpreted most of interface components of TreeVersity and were able to perform comparison tasks and find significant changes in the dataset. For details on the experiment please refer to: After the test participants were asked three questions about the usefulness of TreeVersity: q1: How useful do you think TreeVersity is to detect differences in the budget? q2: How effective do you think the colored Bullets are to codify the changes? q3: How useful do you find the three interconnected views to understand the changes? The answers, were recorded on a 7 point Likert scale, were 1 was "Not useful" and 7 "Very useful". The results shown Figure 10↓, suggest that users found TreeVersity useful for the task of comparing the Budgets.
Figure 10: Usability Study questionnaire results.
Conclusions Comparing trees is very challenging—especially when trees are large and complex. TreeVersity allows users to easily identify differences between trees, see patterns and spot exceptions. A usability test confirmed that even without significant training, users could operate the interface and understand the visual encodings embedded in the bullet glyph. Three case studies analyzing the US airline maintenance budgets, US airport enplanements, and National Transportation Library publications data were presented—illustrating just a few of TreeVersity’s features. Ongoing research with TreeVersity includes further simplifying the user interface with respect to filtering options, enhancing labeling of nodes especially when there are significant numbers of nodes on a single screen, and creating automated reports that guide users through the most significant differences between the trees. Researchers are also studying the node limits of tree comparisons to determine how much information can be both displayed on the screen and comprehended by a user.
Lastly, researchers are exploring the best way to allow the
simultaneous comparison of more than two trees or the aggregation of multiple years of trees. Researchers are now preparing a complex national dataset of hundreds of thousands of miles of congestion and bottleneck data for use in TreeVersity. It is expected that a hierarchical set of
congestion measures for every single segment of every single road in every single state for the United States would work well in TreeVersity, and allow national analysts to better understand quarterly, yearly, or decade long changes and trends in congestion while better prioritizing national transportation project funding decisions.
Acknowledgements We want to thank the Fulbright International Science and Technology Scholarship and the Center for Integrated Transportation Systems Management (a Tier 1 Transportation Center at the University of Maryland) for funding this research. We also thank Patricia Hu, Amanda Wilson, Martin Akerman at the U.S. Dept. of Transportation for taking the time to work with us to applying TreeVersity in real world problems. Lastly, we thank Michael VanDaniker and Tom Jacobs at the CATT Lab for their suggestions and feedback.
References [1] N. Amenta, J. Klingner: ―Case study: Visualizing sets of evolutionary trees‖, , pp. 71–74, 2002. [2] D. Auber, M. Delest, J. P Domenger, P. Ferraro, R. Strandh: ―EVAT: Environment for vizualisation and analysis of trees‖, IEEE InfoVis Poster Compendium, pp. 124–125, 2003. [3] G. Battista: ―Algorithms for drawing graphs: an annotated bibliography‖, Computational Geometry, pp. 235–282, 1994. URL http://linkinghub.elsevier.com/retrieve/pii/092577219400014X. [4] Philip Bille: ―A survey on tree edit distance and related problems‖, Theoretical Computer Science, pp. 217—239, 2005. URL http://www.sciencedirect.com/science/article/B6V1G4FF68TJ-1/2/01da3ee1e6b602d737851fde3040a149. [5] S. Bremm, T. von Landesberger, M. Hess, T. Schreck, P. Weil, K. Hamacherk: ―Interactive visual comparison of multiple trees‖, , pp. 31—40, 2011. [6] S.K. Card, D. Nation: ―Degree-of-interest trees: A component of an attention-reactive user interface‖, , pp. 231–245, 2002. [7] Stuart K Card, Bongwon Suh, Bryan A Pendleton, Jeffrey Heer, John W Bodnar: ―Timetree: exploring time changing hierarchies‖, , pp. 3–10, 2006. URL http://scholar.google.com/scholar?hl=en&btnG=Search&q=intitle:time+tree:+exploring+time+cha nging+heirarchies#0. [8] D. Fisher, R. Dhamija, M. Hearst: ―Animated exploration of dynamic graphs with radial layout‖, , pp. 43 — 50, 2001. URL http://ieeexplore.ieee.org/lpdocs/epic03/wrapper.htm?arnumber=963279. [9] George W Furnas, Jeff Zacks: ―Multitrees: enriching and reusing hierarchical structure‖, , pp. 330–336, 1994. ACM ID: 191778. [10] M. Ghoniem, J. D Fekete: ―Animating treemaps‖, , 2001. [11] M. Graham, J. B Kennedy, C. Hand: ―A comparison of set-based and graph-based visualisations of overlapping classification hierarchies‖, , pp. 41–50, 2000.
[12] M. Graham, J. Kennedy: ―A survey of multiple tree visualisation‖, Information Visualization, 2009. [13] M. Graham, J. Kennedy: ―Combining linking and focusing techniques for a multiple hierarchy visualisation‖, , pp. 425–432, 2001. [14] M. Graham, J. Kennedy: ―Exploring multiple trees through DAG representations‖, IEEE Transactions on Visualization and Computer Graphics, pp. 1294–1301, 2007. [15] M. Graham, J. Kennedy: ―Extending taxonomic visualisation to incorporate synonymy and structural markers‖, Information Visualization, pp. 206–223, 2005. [16] M. Graham, M. F Watson, J. B Kennedy: ―Novel visualisation techniques for working with multiple, overlapping classification hierarchies‖, Taxon, pp. 351–358, 2002. [17] Martin Graham, Jessie Kennedy: ―Multiform Views of Multiple Trees‖, Proceedings of the 2008 12th International Conference Information Visualisation, pp. 252–257, 2008. URL http://portal.acm.org/citation.cfm?id=1439280.1440153. ACM ID: 1440153. [18] John Alexis Guerra Gómez, Audra Buck-Coleman, Catherine Plaisant, Ben Shneiderman: ―Tree Versity: Visualizing Multivariate Data‖, , 2012. [19] J. Heer, S.K. Card: ―DOITrees revisited: scalable, space-constrained visualization of hierarchical data‖, , pp. 421–424, 2004. [20] I. Herman, G. Melancon, M. S Marshall: ―Graph visualization and navigation in information visualization: A survey‖, IEEE Transactions on Visualization and Computer Graphics, pp. 24– 43, 2000. URL http://ieeexplore.ieee.org/lpdocs/epic03/wrapper.htm?arnumber=841119. [21] I. Herman, G. Melançon, M.S. Marshall: ―Graph visualization and navigation in information visualization: A survey‖, Visualization and Computer Graphics, IEEE Transactions on, pp. 24– 43, 2000. [22] Danny Holten, Jarke J. van Wijk: ―Visual Comparison of Hierarchically Organized Data‖, Computer Graphics Forum, pp. 759—766, 2008. URL http://onlinelibrary.wiley.com/doi/10.1111/j.1467-8659.2008.01205.x/full.
[23] J. Y Hong, J. D'Andries, M. Richman, M. Westfall: ―Zoomology: comparing two large hierarchical trees‖, Poster Compendium of IEEE Information Visualization, 2003. [24] S. J\ürgensmann, H.J. Schulz: ―Poster: a visual survey of tree visualization‖, Proceedings of IEEE Information Visualization (Salt Lake City, USA, 2010), IEEE Press, . [25] B. Johnson, B. Shneiderman: ―Tree-maps: A space-filling approach to the visualization of hierarchical information structures‖, , pp. 284 — 291, 1991. URL http://portal.acm.org/citation.cfm?id=949654&dl=. [26] J. B. Kruskal, J. M. Landwehr: ―Icicle Plots: Better Displays for Hierarchical Clustering‖, The American Statistician, pp. 162 — 168, 1983. URL http://scholar.google.com/scholar?hl=en&btnG=Search&q=intitle:Icicle+Plots:+Better+Displays+ for+Hierarchical+Clustering#0. [27] J. Lamping: ―The Hyperbolic Browser: A Focus+Context Technique for Visualizing Large Hierarchies‖, Journal of Visual Languages & Computing, pp. 33–55, 1996. URL http://linkinghub.elsevier.com/retrieve/pii/S1045926X96900038. [28] B. Lee, G. G Robertson, M. Czerwinski, C. S Parr: ―CandidTree: visualizing structural uncertainty in similar hierarchies‖, Information Visualization, pp. 233–246, 2007. [29] T. Margush, F. R. McMorris: ―Consensusn-trees‖, Bulletin of Mathematical Biology, pp. 239—244, 1981. URL http://www.springerlink.com/content/3311mu4180803341/. [30] Michael Gleicher, Danielle Albers, Rick Walker, Ilir Jusufi, Charles D. Hansen, Jonathan C. Roberts: ―Visual Comparison for Information Visualization‖, Information Visualization, 2011. URL http://graphics.cs.wisc.edu/Papers/2011/GAWJHR11. [31] M. J Mohammadi-Aragh, T. J. Jankun-Kelly: ―MoireTrees: Visualization and interaction for multi-hierarchical data‖, , 2005. [32] D. R Morse, N. Ytow, D. M. Roberts, A. Sato: ―Comparison of multiple taxonomic hierarchies using TaxoNote‖, , pp. 126–127, 2003. [33] Tamara Munzner, François Guimbretière, Serdar Tasiran, Li Zhang, Yunhong Zhou: ―TreeJuxtaposer: scalable tree comparison using Focus+Context with guaranteed visibility‖, , pp. 453—462, 2003. URL http://portal.acm.org/citation.cfm?id=1201775.882291.
[34] Tamara Munzner, François Guimbretière, Serdar Tasiran, Li Zhang, Yunhong Zhou: ―TreeJuxtaposer: scalable tree comparison using Focus+Context with guaranteed visibility‖, ACM Transactions on Graphics, pp. 453, 2003. URL http://portal.acm.org/citation.cfm?doid=882262.882291. [35] D. Nation, D. Roberts, S.K. Card: ―Browse Hierarchical Data with the Degree of Interest Tree‖, submitted to CHI, 2002. [36] C. S Parr, B. Lee, D. Campbell, B. B Bederson: ―Visualizations for taxonomic and phylogenetic trees‖, Bioinformatics, pp. 2997, 2004. [37] C. Plaisant, J. Grosjean, B. B Bederson: ―SpaceTree: supporting exploration in large node link tree, design evolution and empirical evaluation‖, , pp. 57–64, 1998. URL http://ieeexplore.ieee.org/lpdocs/epic03/wrapper.htm?arnumber=1173148. [38] G.G. Robertson, J.D. Mackinlay, S.K. Card: ―Cone trees: animated 3D visualizations of hierarchical information‖, , pp. 189–194, 1991. [39] Hans-Jorg Schulz, Steffen Hadlak, Heidrun Schumann: ―Point-based tree representation: A new approach for large hierarchies‖, , pp. 81–88, 2009. URL http://ieeexplore.ieee.org/lpdocs/epic03/wrapper.htm?arnumber=4906841. [40] Ben Shneiderman, Catherine Plaisant: ―Strategies for evaluating information visualization tools: multi-dimensional in-depth long-term case studies‖, , pp. 1–7, 2006. URL http://doi.acm.org/10.1145/1168149.1168158. [41] Ben Shneiderman: ―Tree visualization with Tree-maps: A 2-d space-filling approach‖, ACM Transactions on Graphics, pp. 92–99, 1991. [42] Michael Spenke: ―Visualization and interactive analysis of blood parameters with InfoZoom‖, Artificial Intelligence in Medicine, pp. 159—172, 2001. URL http://www.sciencedirect.com/science/article/pii/S0933365700001056. [43] C. Stockham, L.-S. Wang, T. Warnow: ―Statistically based postprocessing of phylogenetic analysis by clustering‖, Bioinformatics, pp. S285—S293, 2002. URL http://bioinformatics.oxfordjournals.org/content/18/suppl_1/S285.short.
[44] J. L Thorley, R. D.M Page: ―RadCon: phylogenetic tree comparison and consensus‖, Bioinformatics, pp. 486, 2000. [45] M. Wattenberg: ―Visualizing the stock market‖, , pp. 188–189, 1999. [46] Ying Tu, Han-Wei Shen: ―Visualizing Changes of Hierarchical Data using Treemaps‖, Visualization and Computer Graphics, IEEE Transactions on, pp. 1286—1293, 2007. [47] J. A. Guerra Gomez, C. Plaisant, B. Shneiderman, and A. Buck-Coleman. Interactive visualizations for comparing two trees with structure and node value changes. Technical Report HCIL-2011-22, University of Maryland, 2011 http://www.cs.umd.edu/localphp/hcil/tech-reportssearch.php?number=2011-22 [48] J Heer, S K. Card, and J A. Landay. 2005. prefuse: a toolkit for interactive information visualization. In Proceedings of the SIGCHI conference on Human factors in computing systems (CHI '05). ACM, New York, NY, USA, 421-430. DOI=10.1145/1054972.1055031 http://doi.acm.org/10.1145/1054972.1055031