Trust-aware Recommender Systems Paolo Massa
Paolo Avesani
IRST/FBK Via Sommarive 18 Povo (TN), Italy
IRST/FBK Via Sommarive 18 Povo (TN), Italy
[email protected]
[email protected]
ABSTRACT Recommender Systems based on Collaborative Filtering suggest to users items they might like. However due to data sparsity of the input ratings matrix, the step of finding similar users often fails. We propose to replace this step with the use of a trust metric, an algorithm able to propagate trust over the trust network and to estimate a trust weight that can be used in place of the similarity weight. An empirical evaluation on Epinions.com dataset shows that Recommender Systems that make use of trust information are the most effective in term of accuracy while preserving a good coverage. This is especially evident on users who provided few ratings.
Categories and Subject Descriptors H.3.3 [Information Storage and Retrieval]: Information filtering
General Terms Algorithms, Experimentation
1. INTRODUCTION Recommender Systems (RS) [10] have the goal of suggesting to every user the items that might be of interest for her. In particular, RSs based on Collaborative Filtering (CF) [1] rely on the opinions expressed by the other users. In fact CF tries to automatically finds users similar to the active one and recommends to her the items liked by these similar users. This simple intuition is effective in generating recommendations and widely used [10]. However RSs based on CF suffer some inherent weaknesses that are intrinsic in the process of finding similar users. In fact, the process of comparing two users with the goal of computing their similarity involves comparing the ratings they provided to items. And in order to be comparable, it is needed that the two users rated at least some items in common. However in a typical domain, for example in the domain of movies or books, the
Permission to make digital or hard copies of all or part of this work for personal or classroom use is granted without fee provided that copies are not made or distributed for profit or commercial advantage and that copies bear this notice and the full citation on the first page. To copy otherwise, to republish, to post on servers or to redistribute to lists, requires prior specific permission and/or a fee. RecSys’07, October 19–20, 2007, Minneapolis, Minnesota, USA. Copyright 2007 ACM 978-1-59593-730-8/07/0010 ...$5.00.
number of items is very large (in the order of the millions) while the number of items rated by every single user is in general small (in the order of dozens or less). This means that it is very unlikely two random users have rated any items in common and hence they are not comparable. Another important and underconsidered weakness is related to the fact that RS can be easily attacked by creating ad hoc user profiles with the goal of being considered as similar to the target user and influence the recommendations she gets. In order to overcome these weaknesses, we propose to exploit trust information explicitly expressed by the users. Users are allowed to state how much they consider every other user trustworthy that, in the context of RSs, is related to how much they consider the ratings provided by a certain user as valuable and relevant. This additional information (trust statements) can be organized in a trust network and a trust metric can be used to predict the trustworthiness of other users as well (for example, friends of friends). The idea here is to not search for similar users as CF does but to search for trustable users by exploiting trust propagation over the trust network. The items appreciated by these users are then recommended to the active user. We call this technique, Trust-aware Recommender System. While in other papers we explored portions of this process, the goal of this paper is to present a complete evaluation of Trust-aware Recommender System, by comparing different algorithms, ranging from traditional CF ones to algorithms that utilise only trust information with different trust metrics, from algorithms that combine both trust and similarity to baseline algorithms. The empirical evaluation is carried on a real world, large dataset. We have also evaluated the different algorithms against views over the dataset (for example only on users or items satisfying a certain condition) in order to hightlight the relative performances of the different algorithms. The paper is structured as follows. Section 2 presents in more details the motivations for our proposal while Section 3 actually describes the proposal, focusing on the concept of trust, introducing the proposed architecture of Trust-aware Recommender Systems and commenting on related works. Section 4 is devoted to the experiments in which we compared different algorithms and the experimental results are then summarized and discussed in Section 5. Section 6 concludes the paper.
2.
MOTIVATIONS
Recommender Systems are a technique able to cope with the Information Overload problem. Information Overload
refers to the fact that, for example, there are too many books, movies or songs to be able to experience all of them and make an informed decision about which ones we should read, watch or listen to. RSs suggest to every user few items she might like. Collaborative Filtering is a RS technique that exploits a simple intuition: items appreciated by people similar to someone will also be appreciated by that person. While Content-based RSs require a description of the content of the items, Collaborative Filtering has the advantage to rely just on the opinions provided by the users expressing how much they like a certain item in the form of a rating. Based on these ratings, the CF system is able to find users with a similar rating pattern and then to recommend the items appreciated by these similar users. In this sense, it does not matter what the items are (movies, songs, scientific papers, jokes,. . . ) since the technique considers only the ratings of the users and so the technique can be applied in every domain and does not require editors to describe the content of the items. The typical input of CF is represented as a matrix of ratings, in which the users are the rows, the items the column and the values in the cells represent the rating expressed by a user about an item. The CF algorithm can be divided in two steps. The first step is the similarity assessment and consists into comparing the ratings provided by a pair of users (rows in the matrix) in order to compute their similarity. The most used and effective technique for the similarity assessment is to compute the Pearson correlation coefficient [1]. The second step is the actual rating prediction and consists into predicting the rating the active user would give to a certain item. The predicted rating is the weighted sum of the ratings given by other user to that item, where the weights are the similarity coefficient of the active user with the other users. In this way the rating expressed by a very similar user has a larger influence on the rating predicted for the active user. The formula for the second step is the following
pa,i = ra +
Pk
wa,u (ru,i − ru ) Pk u=1 wa,u
u=1
(1)
where pa,i represents the predicted rating what active user a would possibly provide for item i, ru is the average of the rating provided by user u, wa,u is the user similarity weight of a and u as computed in first step and k is the number of users whose ratings to item i are considered in the weighted sum (called neighbours). According to Equation 1, a user can be considered as neighbour for the active user only if it is possible to compute the similarity weight of her and the active user. In this sense the first step is very important in order to be able to generate recommendations. Two users can be compared with a correlation coefficient only if they have rated in common at least few items. Since the items can be millions (think for example, of all the books ever written or of all the movies ever filmed), it is often the case that a user has provided a rating only about a tiny percentage of the items. This results in a high sparsity of the ratings matrix and no overlap between the ratings provided by two random users. As a consequence it is often not possible to compute the similarity between two users. Data sparsity causes the first serious weakness of Collaborative Filtering. This weakness is especially evident on cold start users, users who provided few ratings, for instance users who just
started using the system. For these users, CF tends to fail in generating recommendations since it is not able to compare them with other users and to find possible neighbours. This is a relevant weakness since it is especially important to provide good recommendations to these users in order to give them incentives to keep using the system and provide more ratings. Moreover, as we will see in the following, they tend to be a significant portion of the users. Even when it is possible to compute a similarity weight, because of data sparsity, this is often derived from few overlapping ratings and it is hence a noisy and unreliable value. This results in unaccurate ratings predictions. The last weakness we briefly comment about here is related to attacks to Recommender Systems [8]. The simplest attack is the copy-profile attack: the attacker can copy the ratings of target user and fool the system into thinking that the attacker is in fact the most similar user to target user. In this way every additional item the attacker rates highly will probably be recommended to the target user. These weaknesses are described in more detail in [5]. We describe in next section how our proposal alleviates these weaknesses.
3.
OUR PROPOSAL: TRUST-AWARE RECOMMENDER SYSTEMS
In this section we summarize our proposal that has been already presented elsewhere [5]. We start by introducing basic concepts about trust networks and trust metrics. We then present the logical architecture of Trust-aware Recommender Systems. We conclude this section by comparing our proposal with related work in literature.
3.1
Trust networks and trust metrics
In decentralized environments where everyone is free to create content and there is no centralized quality control entity, evaluating the quality of this content becomes an important issue. This situation can be observed in online communities (for example, slashdot.org in which millions of users posts news and comments daily), in peer-to-peer networks (where peers can enter corrupted items), or in marketplace sites (such as eBay.com, where users can create “fake” auctions) [4]. On these environments, it is often a good strategy to delegate the quality assessment task to users themselves. The system can ask the users to rate other users: in this way, a user can express her level of trust in another user she has interacted with, i.e. issue a trust statement such as “I, Alice, trust Bob as 0.8 in [0,1]”. The system can then aggregate all the trust statements in a single trust networks representing the relationships between users. Trust metrics are algorithms whose goal is to predict, based on the trust network, the trustworthiness of “unknown” users, i.e. users in which a certain user didn’t express a trust statement. Their aim is to reduce social complexity by suggesting how much an unknown user is trustworthy. There are many different trust metrics [2, 11, 6, 9]. An important classification of trust metrics is in global and local ones [6]. Local trust metrics take into account the very personal and subjective views of the users and predict different values of trust in other users for every single user. Instead global trust metrics predict a global “reputation” value that approximates how the community as a whole considers a certain user. In this way, they don’t take into account the
subjective opinions of each user but average them across standardized global values. PageRank [9], for example, is a global trust metric. In the next section we will see how trust metrics can play a role in the context of Recommender Systems, essentially we propose them for replacing or integrating the users’ similarity assessment of step 1.
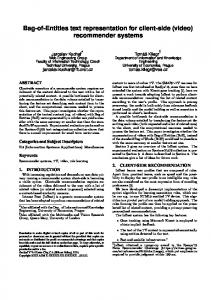
3.2 Architecture of TaRS In this section we present the architecture of our proposed solution: Trust-aware Recommender Systems. Figure 1 shows the different modules (black boxes) as well as input and output matrices of each of them (white boxes). There are two input information: the trust matrix (representing all the community trust statements) and the ratings matrix (representing all the ratings given by users to items). The output is a matrix of predicted ratings that users would assign to items. The difference with respect to traditional CF systems is the additional input matrix of trust statements. The two logical steps of CF remain the same. The first step finds neighbours and the second step predicts ratings based on a weighted sum of the ratings given by neighbours to items. The key difference is in how neighbours are identified and how their weights are computed. The weight wa,i in Equation 1 can be derived from the user similarity assessment (as in traditional CF) or with the use of a trust metric. In fact in our proposed architecture for the first step there are two possible modules able to produce these weights: Trust Metric module or Similarity Metric module. They produce respectively the Estimated Trust matrix and the User Similarity matrix: in both, row i contains the neighbours of user i and the cell of column j represents a weight in [0, 1] about how much user j is relevant for user i (trustable or similar). This is the weight wa,i in Equation 1 and represents how much ratings by user i should be taken into account when predicting ratings for user a (second step). A more detailed explanation of the architecture can be found in [5]. In Section 4 we are going to present experiments we have run with different instantiations of the different modules. For the Trust Metric module we have tested a local and a global trust metric. As local trust metric we have chosen MoleTrust [6], a depth-first graph walking algorithm with a tunable trust propagation horizon that allows us to control the distance to which trust is propagated. As global trust metric we have chosen PageRank [9], probably the most used global trust metric. For the Similarity Metric module we have chosen the Pearson Correlation Coefficient since it is the one that is reported to be performed best in [1]. About the Rating Predictor module (second step), we experimented with selecting only weights from the Estimated Trust matrix or the User Similarity matrix and with combining them. For comparison purposes, we have also run simple and baseline algorithms that we will describe in next section. Now we briefly comment on how our proposal alleviates the before mentioned weaknesses. Due to the propagation of trust over the social network it is possible to compute the trust weight in more users than if user similarity was used and hence the problem of data sparsity is reduced. This is especially evident on cold start users. In fact, users with just one expressed trust statement can benefit from ratings provided by trusted users, and users trusted by them, and accordingly recommendations are computable even if they
Figure 1: Trust-Aware Recommender System Architecture. have provided very few ratings. Just providing a trust statement is hence an effective way of bootstrapping RSs for new users. While neighbours chosen according to the similarity computed on few overlapping ratings might be not the best predictors, this is not the case with users explicitly indicated as trusted by the active user. Attacks are addressed by a trust-aware technique given that the fake identities used for the attacks are not trusted explicitly by the active users (and by the users she trusts). Thus the ratings they have introduced in order to game the system are not considered and do not affect the recommendations generated for the active user. A more detailed description of weaknesses and how Trust-aware RSs alleviates them is in [5].
3.3
Related work
There have been some proposals to use trust information in the context of Recommender Systems. We report here the most significant ones. In a paper titled “Trust in recommender systems” [7], O’Donovan and Smyth propose algorithms for computing Profile Level Trust and Item Level Trust. Profile Level Trust is the percentage of correct recommendations that this producer has contributed. Item level trust is a profile level trust that depends on a specific item. As also reviewers note, this quantity represents more a “competence” measure and in fact reflects a sort of global similarity value. While in their work trust values are derived from ratings (of the Movielens dataset), in our proposal trust statements are explicitly expressed by users. The PhD thesis of Ziegler [11] concentrates on RSs from different points of research. About the integration of trust, he proposes a solution very similar to ours, i.e neighbours formation by means of trust network analysis. He has designed a local trust metric, Appleseed [11], that computes the top-M nearest trust neighbours for every user. He has evaluated algorithms against a dataset derived from AllConsuming (http://allconsuming.net), a community of 3400 book readers, with 9300 ratings and 4300 trust statements. Only positive trust statements are available. Ziegler found that hybrid approaches (using taxonomies of books and hence based on content-based features of books) outperforms the trust-based one which outperforms purely content-based one. Performances on users who provided fewer than five ratings were not studied. Golbeck’s PhD thesis [2] focus on trust in web-based social networks, how it can be computed, and how it can be used in applications. She deployed an online Recommender System, FilmTrust (http://trust.mindswap.org/filmTrust/) in which users can rate films and write reviews and they can also ex-
press trust statements in other users based on how much they trust their friends about movies ratings. Trust statements in FilmTrust are weighted: users could express their trust in other user on a ten level basis. Golbeck designed a trust metric called TidalTrust [2] working in a breadth-first fashion similarly to MoleTrust but without a tunable trust propagation horizon. Even if on a dataset of just 300 members, it is interesting to note that her findings are similar to ours that will be reported in the next section.
4. EMPIRICAL VALIDATION In this Section we present experiments we have conducted for evaluating the performances of Trust-aware Recommender Systems. In particular we compare different instantiations of the modules of our proposed architecture (see Figure 1), so that the evaluated systems range from simple algorithms used as baselines to purely Collaborative Filtering ones, from systems using only trust metrics, both global and local, to systems that combine estimated trust and user similarity information. First we describe the dataset used and introduce the evaluation strategy we followed, then we present the actual experiments results.
4.1 Epinions.com Dataset The dataset we used in our experiments is derived from the Epinions.com Web site. Epinions is a consumers opinion site where users can review items (such as cars, books, movies, software, . . . ) and also assign them numeric ratings in the range 1 (min) to 5 (max). Users can also express their Web of Trust, i.e. reviewers whose reviews and ratings they have consistently found to be valuable and their Block list, i.e. a list of authors whose reviews they find consistently offensive, inaccurate, or not valuable 1 . Inserting a user in the Web of Trust equals to issuing a trust statement of value 1 in her while inserting her in the Block List equals to issuing a trust statement of value 0 in her. Intermediate values such as 0.7 are not expressible on Epinions. In order to collect the dataset, we wrote a crawler that recorded ratings and trust statements issued by a user and then moved to users trusted by that users and recursively did the same. Note however that the block list is kept private in Epinions in order to let users express more freely so it is not available in our dataset. Our dataset consists of 49, 290 users who rated a total of 139, 738 different items at least once. The total number of reviews is 664, 824. The total number of issued trust statements is 487, 181. Rating matrix sparsity is defined as the percentage of empty cells in the matrix users × items and in the case of the collected dataset is 99.99135%. The mean number of created reviews is 13.49 with a standard deviation of 34.16. It is interesting to have a look at what we have called “cold start users”. They are the large majority of users. For example, 26,037 users expressed less than 5 reviews and represent 52.82% of the population. The mean number of users in the Web of Trust (friends) is 9.88 with a standard deviation of 32.85. Another interesting point is the distribution of ratings. In our dataset, 45% of the ratings are 5 (best), 29% are 4, 11% are 3, 8% are 2 and 7% are 1 (worst). The mean rating is hence 3.99. Note that almost half of the ratings are a 5, i.e. the maximum possible value. 1
This definition is from the Epinions.com Web of Trust FAQ (http://www.epinions.com/help/faq/?show=faq wot)
The characteristics we briefly described are very different from those of the Movielens dataset2 , the most commonly used dataset for RSs evaluation. In particular, in Movielens dataset all the users are guaranteed to have voted at least 20 items while in Epinions more than half of them have voted less than 5 items (cold start users). This also means the sparsity is much higher in Epinions and so finding overlapping on provided ratings between users and hence possible neighbours (step 1 of CF) is even harder. While on Epinions most of the rating values are 5 and 4, in Movielens all the different values are more balanced. This affects how different algorithms perform as we will see in the following sections.
4.2
Evaluation measures
The most used technique for evaluating Recommender Systems is based on leave-one-out. Leave-one-out is an offline technique that can be run on a previously acquired dataset and involves hiding one rating and then trying to predict it with a certain algorithm. The predicted rating is then compared with the real rating and the difference in absolute value is the prediction error. The procedure is repeated for all the ratings and an average of all the errors is computed, the Mean Absolute Error (MAE) [3]. A first problem with MAE is that it weighs every error in the prediction of a rating in the same way. For example, let us suppose that our dataset contains only 101 users: one user provided 300 ratings while all the remaining 100 users provided just 3 ratings each. We call the first user a “heavy rater” and the other users “cold start users”. In this way our dataset contains 600 ratings. The leave-one-out methodology consists in hiding these 600 ratings one by one and then trying to predict them. Typically CF works well for users who already provided a lot of ratings and poorly on users who provided few ratings. A probable situation is that the error over the predictions of the heavy rater is small while the error over the predictions of the cold start users is high. However in computing the Mean Absolute Error, the heavy raters weigh just as much as all the other users since she provided a very large number of ratings. This does not reflect the real situation in which actually there is one user that is probably satisfied with the prediction error (the heavy rater) and 300 users who are not satisfied (the cold start users). For this reason, the first additional measure we introduce is Mean Absolute User Error (MAUE). The idea is straightforward: we first compute the Mean Absolute Error for every single user independently and then we average all the Mean Absolute Errors related to every single user. In this way, every user has the same weight in the Mean Absolute User Error computation. This is really important since Epinions dataset contains a large share of cold start users. Another important measure that is often not reported and studied in evaluation of RSs is coverage. Herlocker et al. in their solid review of Recommender Systems evaluation techniques [3] underline how it is important to go “beyond accuracy” in evaluating RSs and count coverage as one step in this direction but also note how few works have investigated it. Coverage simply refers to the fraction of ratings for which, after being hidden, the RS algorythm is able to produce a predicted rating. It might in fact be the case that some RS techniques are not able to predict the rating 2
Distributed by Grouplens group at University of Minnesota and available http://www.cs.umn.edu/Research/GroupLens/
the at
a user would give to an item. Again we believe that coverage was understudied by many research efforts because in Movielens, the most used dataset for evaluation of RSs, the coverage over ratings tends to be close to 100%. This is due to the fact that all the users are guaranteed to have voted at least 20 items and that there are some items that are rated by almost every user. Instead on a very sparse dataset that contains a large portion of cold start users and of items rated just by one user, coverage becomes an important issue since many of the ratings become hardly predictable. While the percentage of predictable ratings (ratings coverage) is an important measure, it suffers the same problem we highlighted earlier for Mean Absolute Error, it weighs heavy raters more. Following the same argument as before, we introduce also the users coverage, defined as the portion of users for which the RS is able to predict at least one rating. A possibility given by a very large dataset of ratings is to study performances of different RS techniques on different portions of the input data (called “views”). It is possible for example to compute MAE or Users coverage only on ratings given by users or items which satisfy a certain condition. The views we are going to report results about in this paper are the following: cold start users, who provided from 1 to 4 ratings; heavy raters, who provided more than 10 ratings; opinionated users, who provided more than 4 ratings and whose standard deviation is greater than 1.5; black sheep, users who provided more than 4 ratings and for which the average distance of their rating on item i with respect to mean rating of item i is greater than 1; niche items, which received less than 5 ratings; controversial items, which received ratings whose standard deviation is greater than 1.5. We introduced these views because they are better able to capture the relative merits of the different algorithms in different situations and to better represent their weaknesses and strengths.
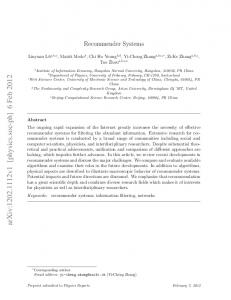
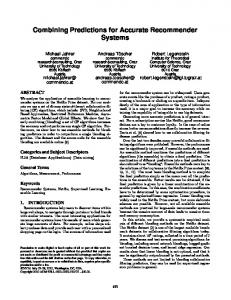
4.3 Results of the Experiments Every different instantiation of the Trust-aware Recommender System architecture is evaluated with regard to the measures we have defined (MAE, MAUE, ratings coverage, users coverage), also focusing the analysis on the different views previously introduced, such as, for example, cold start users and controversial items. In the following we discuss the experiments’ results which are condensed in Table 1 and 2. Figure 2 and 3 presents graphically just one of the measures reported in the tables, precisely the row labeled “Cold users” (i.e. MAE and ratings coverage on predictions for cold start users and MAUE and users coverage) in order to give the reader a visual grasp of the relative benefits of the different techniques.
4.3.1
Simple algorithms seem very effective
As a first step in our analysis we tried a very simple algorithm that returns always 5 as the predicted rating a user would give to an item. We call this algorithm Always5. This trivial algorithm is not meaningful from a RS point of view since, for instance, it does not allow to differentiate and prioritize the different items. However it allowed us to start exploring which MAE a simple algorithm would achieve. The MAE over all the ratings is 1.008. This result is not too bad, especially if we compare it with more complex algorithms as we will do in the following. Another trivial algorithm that predicts as rating the mean of the ratings pro-
vided by one user is very effective as well achieving a MAE of 0.9243. The reason for such good performances is that in our dataset most of the rating values are in fact 5 and this is a notable difference with respect to other datasets, for instance MovieLens, on which these trivial algorithms work very badly. But in our case we have two very simple and not personalized algorithms that seem to performs enough well. This fact suggested to us that just presenting the Mean Absolute Error over all the ratings is not a useful way to compare different algorithms. We introduced the evaluations views explained in Section 4.2 in order to have an evaluation technique better able to capture the relative merits of the different algorithms in different situations and to better represent their weaknesses and strengths. In fact on the controversial items view for instance, these trivial algorithms perform very badly.
4.3.2
Collaborative Filtering outperformed by simple average
Another trivial algorithm is the one that predicts as a rating for a certain item the unweighted average of all the ratings given to that item by all the users but the active user. It is a non-personalized technique that is like assigning 1 as similarity or trust weight to all the users in the second step of CF (Equation 1 with wa,i always equal to 1). For this reason we call it TrustAll. To our surprise, TrustAll outperformed standard Collaborative Filtering algorithms, achieving a MAE of 0.821 (against 0.843 of standard CF ). On the other hand, on MovieLens dataset, we observe the expected result: MAE of CF is 0.730 while MAE of TrustAll is 0.815. Moreover, the number of predictable Epinions ratings (the coverage) is 51.28% for CF and 88.20% for TrustAll, while on Movielens ratings they are both close to 100%. The reason for these important differences is in the datasets. The Epinions dataset contains mostly 5 as rating value and most of the users provided few ratings (cold start users). We believe these facts, not observed in other RS datasets, allowed us to study certain characteristics of RS algorithms that were previously unexplored. The problem with CF in our dataset is that the Pearson correlation coefficient (similarity weight output of the first step of CF) is often not computable because of data sparsity and hence only the ratings of a small percentage of the other users can be utilized when generating a recommendation for the active user. Since there is not too much variance in rating values (most of them are 5), an unweighted average is usually close to the real value. On cold start users, the balance is even more for TrustAll. The coverage of CF on cold start users is only 3.22% while the coverage of TrustAll is 92.92% and the MAE of CF is 1.094 while the MAE of TrustAll in 0.856. Note that in the real-world Epinions dataset, cold start users make up more than 50% of total users. In fact for a cold start user the first step of CF fails almost always since it is very unlikely to find other users which have rated the same few items and hence the similarity weight is not computable. However these results are not totally dismissive of CF, in fact, on controversial items, CF outperforms TrustAll (MAE of 1.515 against 1.741). In this case, CF is able to just consider the opinions of like minded users and hence to overcome the performances of TrustAll, a technique that, not being personalized, achieves greater error. This means that when it is really important to find the like-minded neighbours CF is needed and effective. Also note that the error over rat-
Mean Absolute Error / Ratings Coverage Algorithms CF MT1 MT2 MT3 TrustAll 0.843 0.832 0.846 0.829 0.821 51.28% 28.33% 60.47% 74.37% 88.20% 1.094 0.674 0.833 0.854 0.856 3.22% 11.05% 25.02% 41.74% 92.92% 0.850 0.873 0.869 0.846 0.845 57.45% 30.85% 64.82% 77.81% 92.92% 1.515 1.425 1.618 1.687 1.741 45.42% 25.09% 60.64% 81.01% 100.0% 0.822 0.734 0.806 0.828 0.829 12.18% 8.32% 24.32% 20.43% 55.39% 1.200 1.020 1.102 1.096 1.105 50% 23.32% 57.31% 74.24% 92.80% 1.235 1.152 1.238 1.242 1.255 55.74% 23.66% 59.21% 76.32% 97.03%
Mean Absolute User Error / Users Coverage Views Algorithms CF MT1 MT2 MT3 TrustAll All 0.938 0.790 0.856 0.844 0.843 40.78% 46.64% 59.75% 66.31% 98.57% Cold 1.173 0.674 0.820 0.854 0.872 users 2.89% 17.49% 30.61% 42.49% 96.63% Heavy 0.903 0.834 0.861 0.834 0.820 raters 86.08% 79.78% 88.42% 89.42% 100.00% Contr. 1.503 1.326 1.571 1.650 1.727 items 15.76% 11.74% 21.66% 27.85% 37.16% Niche 0.854 0.671 0.808 0.843 0.848 items 10.77% 10.27% 20.73% 32.83% 52.04% Opin. 1.316 0.938 1.090 1.092 1.107 users 61.20% 60.74% 76.51% 79.85% 100.00% Black 1.407 1.075 1.258 1.285 1.300 sheep 67.78% 60.83% 75.34% 77.70% 100.00%
Table 1: Accuracy and coverage measures on ratings, for different RS algorithms on different views.
Table 2: Accuracy and coverage measures on users, for different RS algorithms on different views.
ings received by controversial items is greater than the error over all the ratings, meaning that it is harder to predict the correct ratings for these items.
facts have the following reason: CF works well, both in terms of coverage and in terms of error, for heavy raters (users who already provided a lot of ratings) while it performs very poorly on cold start users. On many important views such as controversial items and opinionated users MT1 outperforms both CF and TrustAll.
Views All Cold users Heavy raters Contr. items Niche items Opin. users Black sheep
4.3.3
Trusted users are good predictors
In this subsection we start comparing performances of RS algorithms that use only trust information (top box in Figure 1) with standard CF (bottom box). We start by using only the users explictly trusted by the active user, i.e. not propatagating trust or setting the propagation horizon at 1 for the local Trust Metric MoleTrust. We call this algorithm MT1. In general, RSs based on trust propagation work better with cold start users. They don’t use the (few) ratings information for deriving a similarity measure to be used as weight for that user, but use the trust information explicitly provided by the user. In this way, even for a user with just one friend, it is possible that her friend has rated the items she rated and hence a prediction is possible. It is also possibly the case that that friend has tastes very similar to the current user and hence the error is small. In fact, the MAE of MT1 over cold start users is 0.674 while the MAE of CF is, as already discussed, 1.094. The difference in error is very high and particulary relevant since it is important for a RS to be able to provide personalized recommendations as soon as possible to users who have not yet provided many ratings so that these users appreciate the system and keep using it, providing more ratings. Moreover cold start users are a very large portion of the users in our dataset. Let us now compare performances of CF and MT1 over all the ratings. The MAUE achieved by MT1 and CF is respectively 0.790 and 0.938. About prediction coverage, while CF is able to predict more ratings than MT1 (ratings coverage is 51.28% vs. 28.33%), MT1 is able to generate at least a prediction for more users (users coverage is 46.64% vs. 40.78%). Summarizing, MT1 is able to predict fewer ratings than CF but the predictions are spread more equally over all the users (which can then be at least partially satisfied) and, about errors, CF performs much worse than MT1 when we consider the error achieved over every single user in the same way and not depending on the ratings she provided. These
4.3.4
Propagating trust with a Local Trust Metric
In the previous section we analyzed performances of RS algorithms that consider only trust information but don’t propagate trust. Here we analyze how trust propagation using the local Trust Metric Moletrust performs. We name MT2, MT3 and MT4 the algorithms which propagate trust up to distance 2, 3 and 4 respectively. Of course propagating trust allows to reach more users and hence predict a trust score for more of them (see graphs and data in [5]). It is interesting to briefly report the number of neighbours that can be identified by the different first steps in the Trust-aware Recommender System architecture. The average number of directly trusted users (MT1) is 9.88, while the average number of comparable users (users for which the Pearson Correlation coefficient is computable) is 160.73. However just propagating trust a few steps helps to increase significantly the number of neighbours that can be considered for the rating predictions. Propagating at distance 2 (friends of friends) is possible to reach 399.89 users and increasing the trust propagation horizon to 3 and 4 allows to reach respectively 4, 386.32 and 16, 333.94 users [5]. This pattern is even more evident on cold start users [5]. Since by propagating trust it is possible to reach more users and hence to compute a predicted trust score in them and to count them as neighbours, the prediction coverage of the RS algorithm increases. In fact the larger the trust propagation horizon, the greater the coverage (see columns MT1, MT2 and MT3 of Table 1 and 2). For instance, on all ratings, the ratings coverage increases from 28.33% for MT1, to 60.47% for MT2, to 74.37% for MT3. By continuing to propagate trust (i.e. expanding the trust propagation horizon) it is possible to consider more and more users as possible neighbours and hence to arrive at 88.20%, the rat-
100 MAE 1.2
Ratings coverage
CF 1.094
TrustAll 92.92% 80
1 MT2 0.833
MT3 0.854
TrustAll 0.856 Ratings coverage
MAE
0.8 MT1 0.674 0.6
60
MT3 41.74% 40 MT2 25.02%
0.4
20
MT1 11.05%
0.2 CF 3.22% 0
0 0
1
2
3 Algorithms
4
5
6
0
1
2
3 Algorithms
4
5
6
Figure 2: MAE on cold start users for some representative algorithms.
Figure 3: Ratings coverage on cold start users for some representative algorithms.
ings coverage of TrustAll which considers every user who provided a rating. The downside of this is that the error increases as well. For example, on cold start users, the MAUE is 0.674 for MT1, 0.820 for MT2 and 0.854 for MT3. These results say that by propagating trust it is possible to increase the coverage (generate more recommendations) but that it also considers users who are worse predictors for the current user so that the prediction error increases as well. The trust propagation horizon basically represents a tradeoff between accuracy and coverage.
(Figure 1), the “rating predictor” module takes as input both the Estimated Trust matrix and the User Similarity matrix. The idea is that the weight of a neighbour used in Equation 1 can be derived both from the user similarity value computed by the Similarity Metric (Pearson Correlation Coefficient in our case) and the predicted trust value computed by a Trust Metric. We have already commented on the number of users for which it is possible to compute a similarity weight or a predicted trust in previous subsection [5]. However in order to devise a way of combining these two matrices, it is interesting to analyze how much they overlap. As previously reported, the number of users reachable in one step (the ones used by MT1) are on average 9.88 and the number of users in which a user similarity coefficient is computable are on average 160.73. The two matrix rows overlap only on 1.91 users on average, that is only for 1.91 users we have both a predicted trust and a user similarity. The number of users reachable propadating trust up to distance 2 is 399.89. Comparing it again with the number of users in which a similarity coefficient is computable (160.73), the average number of users present in both lists is 28.84. These numbers show how Pearson Correlation coefficient and MoleTrust address different portions of the user base in which they are able to compute a weight. So, in order to combine these weights, we tested the simple technique of computing a weighted average when there are two weights available and, in case only one is available, of using that. We call this technique CF+MTx : for example the systems that combine CF and MT1 is called CF+MT1. The results are not very good. When comparing CF+MT1 with CF and MT1 for example, we see that the coverage is greater than the coverage of the two techniques. This is of course the expected situation since CF+MT1 considers both the users in which it is possible to predict a trust score (as MT1 does) and the users in which it is possible to compute a user similarity (as CF does). However the error of CF+MTx is in general in between of CF and MTx, that is worse than MTx and better than CF. The problem is that, as we reported earlier, CF is almost always not able to find good neighbours and hence making an average of the users who are similar and of the users that are trusted produces worse results that just considering trusted users. Since techniques that used only trust were superior in previous tests
4.3.5
Global Trust Metrics not appropriate for Recommender Systems
An additional experiment we performed is about testing the performance of global Trust Metrics as algorithms for predicting the trust score of unknown users. A global trust metric predicts for every user the same trust scores in other users. This technique, like TrustAll, is hence not personalized. We have chosen to run PageRank [9] as global trust metric and to normalize the output value in [0,1]. We call the Recommender System that uses PageRank for its Trust Metric module, PR. PR performs similarly to TrustAll, even slightly worse (MAE of 0.847 and 0.821 respectively). This means that a global Trust Metric is not suited for a Recommender System whose task is to leverage individual different opinions and not to merge all of them into a global average. We also tried to restrict the neighbours to just the first 100 users as ranked by PageRank but this algorithm (called PR100 ) while of course reducing the coverage, reports even larger errors (MAE of 0.973). The reason behind these bad performances is that globally trusted users (as found by PageRank) tend to be peculiar in their rating patterns and provide more varied ratings so that averaging them generates larger errors. Summarizing we can say that global trust metrics are not suited in the task to find good neighbours, especially because the task of RSs is to provide personalized recommendations while global trust metrics are unpersonalized.
4.3.6
Combining Estimated Trust and User Similarity
In the architecture of Trust-aware Recommender Systems
to CF-based ones, we also try to just use the predicted trust score when both the weights were available but the results are very similar.
5. DISCUSSION OF RESULTS In this section we summarize and discuss the most important results of the presented experiments. The first important result it that considering only the ratings of directly trusted users is the technique that, in general, achieves the smallest error with an acceptable coverage. The comparative improvement over the other techniques is particularly evident with regard to controversial items and black sheep, two of the most important and challenging views. With regard to cold start users, standard CF techniques totally fail and are not able to generate any recommendation. Instead by considering ratings of trusted users we achieve a very small error and are able to produce a recommendation for almost 17% of the users. We can therefore state that providing a single trust statement is an easy, effective and reliable way of bootstrapping the Recommender System for a new user. It is important to underline that the evidence is based on experiments carried on a real world, large dataset. In particular the Epinions datasets allowed us to explore topics which were not addressed before by research papers, such as cold start users and other views. Using our local Trust Metric MoleTrust in order to propagate trust allows users trusted by trusted users (at distance 2 from active user in the directed trust network), or even further away users, to be considered as possible neighbours. In this way, the coverage increases significantly, but the error increases as well. This means that ratings of users at distance 2 (or more) are less precise and less useful than ratings of users at distance 1, i.e. directly trusted by the active user. However it is an open issue to see if different local trust metrics are able to extract just some of the other users such that their ratings are really effective in improving the recommendation accuracy. In fact, this method can be used to evaluate the quality of different trust metrics, i.e. a better trust metric is the one that is able to find the best neighbours and hence to reduce the prediction error. As last point we would like to highlight how Collaborative Filtering, the state of the art technique, performed badly in our experiments, especially on cold start users (which in our dataset are in fact more than 50%). The reason of this has to be found in the characteristics of the datasets used for evaluation. In previous research evaluations the most used dataset was MovieLens, while we used a dataset derived from the online community of Epinion.com. As we have already commented they present very different characteristics. It is still an open point to understand how much the different datasets influence the evaluation of different algorithms’ performances.
6. CONCLUSIONS In this paper we have presented our proposal for enhancing Recommender Systems by use of trust information. We have presented a deep empirical evaluation on a real world, large dataset of the performances of different algorithms ranging from standard CF to algorithms powered with local or global trust metrics, from combination of these to baseline algorithms. We have also segmented the evaluation only on certain views (cold start users, controversial items, etc.) over the dataset in order to better highlight the relative merits of
the different algorithms. The empirical results indicate that trust is very effective in alleviating RSs weaknesses. In particular the algorithm powered with MoleTrust local trust metric is always more effective than CF algorithms which surprisingly performs even worse than simple averages when evaluated on all the ratings. This difference is especially large when considering cold start users, for which CF is totally uneffective. The trust propagation horizon represents a tradeoff between accuracy and coverage, i.e. by increasing the distance to which trust is propagated by the local trust metric the prediction coverage increases but the error increases as well. Results also indicates that global trust metrics are not appropriate in the context of RSs. Given that the user similarity assessment of standard CF is not effective in finding good neighbours, the algorithms that combines both user similarity weight and predicted trust weights are not able to perform better than algorithms that just utilize trust information.
7.
REFERENCES
[1] J. Breese, D. Heckerman, and C. Kadie. Empirical analysis of predictive algorithms for collaborative filtering. In Proceedings of the Fourteenth Conference on Uncertainty in Artifi cial Intelligence, Madison, WI, July 1998. Morgan Kaufmann. [2] J. Golbeck. Computing and Applying Trust in Web-based Social Networks. PhD thesis, University of Maryland, 2005. [3] J. L. Herlocker, J. A. Konstan, L. G. Terveen, and J. T. Riedl. Evaluating collaborative filtering recommender systems. ACM Trans. Inf. Syst., 22(1):5–53, 2004. [4] P. Massa. A survey of trust use and modeling in current real systems, 2006. Chapter in “Trust in E-Services: Technologies, Practices and Challenges”, Idea Group, Inc. [5] P. Massa and P. Avesani. Trust-aware collaborative filtering for recommender systems. In Proc. of Federated Int. Conference On The Move to Meaningful Internet: CoopIS, DOA, ODBASE, 2004. [6] P. Massa and P. Avesani. Trust metrics on controversial users: balancing between tyranny of the majority and echo chambers, 2007. International Journal on Semantic Web and Information Systems. [7] J. O’Donovan and B. Smyth. Trust in recommender systems. In IUI ’05: Proceedings of the 10th international conference on Intelligent user interfaces, pages 167–174, New York, NY, USA, 2005. ACM Press. [8] M. P. O’Mahony, N. J. Hurley, and G. C. M. Silvestre. Recommender systems: Attack types and strategies. In Proceedings of the 20th National Conference on Artificial Intelligence (AAAI-05), Pittsburgh, Pennsylvania, USA, 9–13, Jul 2005. AAAI Press. [9] L. Page, S. Brin, R. Motwani, and T. Winograd. The pagerank citation ranking: Bringing order to the web. Technical report, Stanford, USA, 1998. [10] P. Resnick and H. Varian. Recommender systems. Communications of the ACM, 40(3):56–58, 1997. [11] C.-N. Ziegler. Towards Decentralized Recommender Systems. PhD thesis, Albert-Ludwigs-Universit¨ at Freiburg, Freiburg i.Br., Germany, June 2005.