This study presents CFD results for a 2-stage turbine. The stator-well cavity for the second row of stationary vanes .... plified case of zero blade tip clearance.
Proceedings of the 8th International Symposium on Experimental and Computational Aerothermodynamics of Internal Flows Lyon, July 2007
Paper reference : ISAIF8-008
TURBINE STATOR-WELL FLOW MODELLING Virginie N.D. Autef1, John W. Chew1, Nicholas J. Hills1 and Ivan L. Brunton2 1
2
University of Surrey School of Engineering (H5) Guildford, GU2 7XH, UK
Rolls-Royce plc PO Box 31, Derby DE24 8BJ, UK
In axial gas turbines, hot air from the main annulus path tends to be ingested into the turbine disc cavities. This leads to overheating which will reduce the disc’s life time or lead to serious damage. Often, to overcome this problem, some air is extracted from the compressor to cool the rotor discs. This also helps seal the rim seals and to protect the disc from the hot annulus gas. However, this will deteriorate the overall efficiency. A detailed knowledge of the flow interaction between the main gas path and the disc cavities is necessary in order to optimise thermal effectiveness against overall effi-
ciency due to losses of the cooling air from the main gas path.
Keywords:
The aim of this study is to provide better understanding of the flow in a turbine stator-well, and evaluate the use of different CFD methods for this complex, 3-dimensional unsteady flow. This study presents CFD results for a 2-stage turbine. The stator-well cavity for the second row of stationary vanes is included in the calculation and results for both turbine performance and stator-well sealing efficiency are presented.
Turbomachine, axial turbine, cavity, efficiency, cooling, thermal effectiveness
Introduction The turbomachinery industry has to face continual pressure to improve performance. A 1% improvement in efficiency can save millions of pounds, as typically 1% improvement in specific fuel consumption is approximately worth 560 tonnes of fuel per aircraft per annum for a wide bodied airliner [1]. Some flow features that used to be ignored in approximate design calculations now have to be considered in detail. This is particularly the case for secondary air systems and cavity flows. With recent computer developments, the capability of computational fluid dynamics (CFD) is increasing, allowing more geometry features to be modelled as well as fully
3-dimensional unsteady flows. The improved representation of the physics is expected to lead to improved engine design. Cavity flows between a rotating disc and a fixed stator [2-5] and more particularly the interaction between the main annulus flow and the cavity rim seal [6-11] have been the subject of many studies. Hot air from the annulus is ingested into the cavity, and will reduce the disc life. A common practice to reduce the amount of ingress is to inject coolant air extracted from the compressor into the cavity. However, as this creates parasitic losses in engine performance, its use has to be optimised. The ingestion has been shown to depend on the external flow [12]. It is strongly influenced by the swirl velocities [13],
Virginie AUTEF http://www.lmfa.ec-lyon.fr/ISAIF8/
Proceedings of the 8th International Symposium on Experimental and Computational Aerothermodynamics of Internal Flows
2
Nomenclature C n P Po ro t
percentage of main annulus flow rate mass flow rate (kg/m3) local unity vector normal to the surface static pressure (Pa) total pressure (Pa) outer radius of the cavity (m) time (s)
T
static temperature (K)
in
T
blade passing period (s)
L
To
total temperature (m)
out
m&
Tcoolant Tdisc Tgas u
relative total coolant flow temperature at the entrance of the cavity (K) rotor disc temperature (K) relative total air temperature behind the exit of rotor 1 (K) velocity vector (m/s)
the rotor blades [5 and 7] and the rim seal geometry [6]. The flow in the cavity may be complex, three-dimensional and unsteady. The flow pattern is also strongly affected by the amount of coolant flow injected into the cavity. Until recently, the disc cavity and main gas path flows have generally been treated separately. In the present contribution CFD is evaluated and used for combined disc cavity/main gas path modelling. It is considered that this will allow better flow modelling, with the potential of capturing cavity/main annulus interaction effects earlier in the engine design and development programme.
Greek letters
!
Sealing efficiency cooling effectiveness rotational speed (rad/s)
! !
Subscripts 1 c
main annulus inlet coolant inflow inward mass flow through the rim seal labyrinth seal flow outward mass flow through the rim seal
Abbreviations TSW
turbine stator well
MP
mixing plane
SP AO
sliding plane annulus only
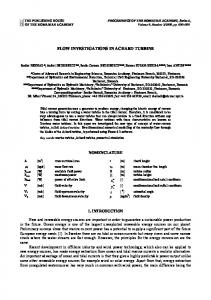
blades. Cooling can be supplied through 39 equispaced cooling holes as shown in Fig. 1. The hub line is inclined at an angle of 6°. The simulations will consider the simplified case of zero blade tip clearance. The TSW is composed of a short inner foot, two rotor-stator cavities linked together by a labyrinth seal and to the main annulus flow by two rim seals. The geometry was designed so that the labyrinth seal clearance could be altered easily. The geometry being 1/39th periodic, only a 1/39th model will be represented. Rotor 1
NGV 2
Rotor 2
The scope of the present paper is to provide a better understanding of the flow behaviour in the main annulus flow of a 2-stage turbine and a turbine stator well (TSW), as presented in Fig. 1. The results section presents the main aerodynamics of the flow and considers the impact of flow modelling on the turbine efficiency. The effect of the geometry (cavity, labyrinth seal flow clearance) will be evaluated. Steady and unsteady results will be compared. The influence of the coolant flow on the cavity flow pattern, the ingestion and the turbine efficiency are also presented.
Model description Geometry and mesh The geometry studied is a two-stage axial-flow turbine, based on an existing rig [14]. Each turbine stage comprises 39 Nozzle Guide Vanes (NGV) and 78 rotor
Labyrinth seal
NGV 1
Cooling air holes
TSW
Fig. 1
Model geometry.
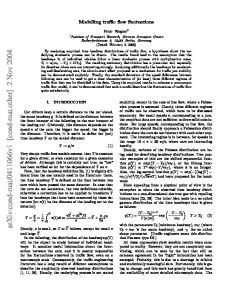
The model and mesh, presented in Fig. 2, are the same as used by Dixon et al. [14], and tested by those authors for mesh dependency. Its 2 million cells provided a mesh with y+ values within the accepted range for use with the k " ! turbulent model with standard wall function, except in the labyrinth seal region. In this region, further refinement was necessary to correctly resolve the local velocities, resulting in y+ values below the accepted range for this model. The Spalart-Allmaras turbulence model was selected for this work, but no further mesh testing was done. An annulus only model was also built for this study to evaluate the influence of the cavity. The
Virginie AUTEF et al.
Turbine stator-well flow modelling
geometry was identical to the main model, but without the TSW.
3
Results Uncooled TSW
CFD modelling The CFD program chosen for this work was a modified version of the Rolls-Royce time-marching code Hydra [15]. Mixing plane techniques were used for steady calculations, and sliding planes for unsteady calculations. 100 times steps per NGV passing period were specified for the latter. To ensure convergence, flow residuals were monitored. Momentum, mass flow and enthalpy balances were also checked. The unsteady calculations were run long enough to stabilise flow variables at monitored points. Using multigrid acceleration, typical convergence times were three days on 8 parallel processors for steady calculations and two weeks for unsteady calculations. The design rotational speed is 10,630rpm. The boundary conditions chosen are appropriate for subsonic inlet and outlet flow conditions in the main annulus. The main inlet total pressure was 255,000Pa and the total temperature 443K. The outlet static pressure was set to 109,785Pa. The boundary condition for the coolant inlet hole also assumed subsonic inflow, with a total temperature of 300K. The total pressure necessary to get the desired inlet mass flow was obtained by using a trial and error method. The Spalart-Allmaras variable was set to 0.000176165m2/s at the inlets, which corresponds to a turbulent to laminar viscosity ratio of 10. The walls were considered adiabatic with no-slip conditions. The outer casing walls of the rotating zones were considered stationary.
Table 1 presents the main results of this subsection in which the TSW coolant flow is zero. Five different models were investigated: two full unsteady models, one with normal and one with reduced labyrinth seal clearance, a full steady model and two annulus only models, steady and unsteady. Mass flows parameters (m & To1 Po1 ) were in good agreement with experimental data [16]. Two ways of calculating adiabatic efficiencies were considered. The actual work was either based on computed enthalpy change or torque. Theoretically these should give identical results, but some discrepancies were observed, especially for the steady cases. This is considered to be due to slight mass flow imbalances in the CFD solutions. The highest turbine efficiency is obtained with the unsteady calculation with the reduced seal clearance. Taking the seal away by simulating only the annulus blade row reduces the efficiency according to the unsteady model, while providing a larger seal clearance also reduces the efficiency. Steady and unsteady annulus-only simulations predict similar efficiency but, when the cavity is included, a higher efficiency is given by the unsteady calculations than the steady calculations. This suggests a significant unsteady interaction between the main passage and the cavity.
Interface planes
Fig. 2
CFD geometry and mesh, close-up on the rotor blades.
4
Proceedings of the 8th International Symposium on Experimental and Computational Aerothermodynamics of Internal Flows
Table 1
Turbine performance.
Mass flow parameter
Enthalpy based adia-
Torque based adiabatic
m& To1 Po1 ( kg.K-1.s-1. Pa-1)
batic efficiency %
efficiency %
Unsteady
0.00033659
89.09583361
88.77957131
Unsteady, reduced lab. seal clearance
0.00033489
90.63401474
90.57233389
Steady
0.00033381
84.71223195
83.93174113
Unsteady AO
0.00032999
86.91523198
86.92508157
Steady AO
0.00033267
87.51445042
87.03225829
Experiment [16]
0.000339
Instantaneous circumferentially averaged radial profiles are presented in Fig. 3, on a cross-section behind the first rotor, just upstream of the first seal, for the five calculations presented in Table 1. For the full unsteady models with regular labyrinth seal clearance, four different profiles at four different physical times spread in a blade passing period are presented. Looking at the radial flow profiles in the annulus from the five calculations presented in Table 1, it appears that as the flow goes through the first stator, the profiles obtained are relatively consistent between the different models. As the flow goes through the first rotor blade row, some larger differences appear. As can be seen in Fig. 3, the curves start to split in two different families: mixing plane, and sliding plane calculations. The mixing plane calculation tends to have a smaller core region and the sliding planes calculations have much stronger near-wall gradients. Time variations are small in comparison to differences between the steady and unsteady models. There is no obvious evidence of the seal affecting the upstream flow, whereas there is a very clear impact on the hub boundary layer just downstream of the first seal. As shown in Fig. 4, two new families can be noticed in this near-wall region: calculations with or without a cavity. Similar effects occur around the downstream seal. In the second stage, the mixing plane/sliding plane family effect is accentuated, and the scatter between the curves increases as the flow is going down the annulus. The highest amplitude difference is to be found around the annulus mid-radius. Interestingly, the results indicate strong sensitivity to whether or not the cavity is included in the model.
Fig. 3
Instantaneous radial profiles of absolute tangential
velocities at the exit of rotor 1 and just before the upstream rim seal.
Fig. 4
Instantaneous radial profiles of absolute whirl angle just after the upstream rim seal.
Virginie AUTEF et al.
Turbine stator-well flow modelling
Coolant flow simulations Total pressures varying for different flow rates and a fixed total temperature of 300K were specified at the inlet of the coolant holes. The selection of flow rates covers configurations from strong ingestion to completely cooled discs. Main flow features As shown in Fig. 5, the amount of coolant flow supplied affects the labyrinth seal flow. The smallest seal flow rate (0.78% of the main annulus mass flow) is obtained with the reduced seal clearance model, as expected. The seal flow increases with the coolant flow rate, ranging from 1.32% to 1.80% for the mixing plane calculations, and 1.66% to 2.12% for the sliding plane calculations over the range of coolant flow rates simulated. At identical coolant flow rates, the sliding plane calculations predict around 0.35% more leakage than the mixing plane calculations.
Fig. 5
Effect of the coolant flow on the labyrinth seal flow.
The flow pattern in the upstream cavity showed high sensitivity to cooling, and as the cooling air is being supplied by cooling holes, it will naturally create some strong asymmetries in the cavity. Fig. 6 shows the cavity flow pattern on a cut plane going through the cooling hole. The configuration shown on the left corresponds to a very strong ingestion case. The coolant flow being too low to satisfy the labyrinth seal flow demand, the complement is sucked into the upstream cavity from the main gas path. There is a very small recirculation near the upstream seal, and a main recirculating core region covering the entire cavity. The disc entrainment creates a pumping effect, with strong outward radial velocity on the back of the disc. The coolant air having a relatively low radial velocity is quickly deflected and directly ingested through the labyrinth seal. The rotor disc remains totally uncooled, which is consistent with rotor disc adiabatic temperature.
5
As the coolant mass flow increases, this supplies the labyrinth seal, resulting in less annulus flow being ingested through the upstream rim seal into the cavity. This corresponds to the configuration shown on the right in Fig. 6. It is to be noticed that as the coolant mass flow increases, the labyrinth seal flow increases slightly. As the radial velocities of the coolant flow increases, the coolant flow penetrates further outward in the cavity and impinges upon the stator foot, reducing the size of the main re-circulation zone and suppressing the small near-seal recirculation as the flow in the cavity becomes stronger. The lower part of the cavity starts benefiting from the cooling flow, the disc temperature dropping slightly at low radius compared to the uncooled model.
Fig. 6 Flow pattern in the upstream cavity, steady calculation, Cc = 0.43% (left) and Cc = 1.13% (right).
By further increasing the coolant flow rate, a distinct recirculation zone appears. The flow recirculates around the lockplate shoulder of the disc before being ingested through the labyrinth seal. The size of this zone increases with the coolant flow rate. Once the coolant flow rate is larger than the labyrinth flow seal requirement, and the radial velocity is strong enough, the flow penetrates up to the centre of the cavity and part of the coolant flow is sucked into the rotor disc boundary layer before being ejected out of the cavity to the main annulus flow. The flow in the downstream cavity is presented in Fig. 7. Whatever the coolant flow rate supplied, the vortex pattern stays similar, only the strength of the vortex changes slightly. The flow exiting of the labyrinth seal arrives with strong axial and tangential velocities; the swirl coming from the upstream cavity and the moment exerted by the rotating fins in the labyrinth seal. The fluid flows onto the upstream face of the downstream
Proceedings of the 8th International Symposium on Experimental and Computational Aerothermodynamics of Internal Flows
6
disc, and is entrained into its boundary layer, the axial velocity being transformed into outward radial velocity. Arriving at the outer radius of the cavity, some of the flow turns back into the main annulus flow. This strong flow stream leaves a large but weak vortex filling most of the cavity. A small vortex can also be found behind the stator foot.
close to the rotor wall. There is very little unsteadiness in the cavity, and the strongest amplitude frequency (in the stationary frame) is at the blade passing frequency for the lower flow rates. For the highest simulated coolant flow rate of Cc = 2.12%, there seems to be some natural unsteadiness of frequency around 0.2 to 0.3 of blade passing frequency. This may be linked to unsteadiness in the rim seal. As identified in earlier studies [7, 8], rim seal flows may well be inherently unsteady for low net rim seal throughflow rates, as occurs at this coolant flow rate.
Flow direction
Fig. 7
Flow in the downstream cavity, steady calculation, Cc = 0.425%.
Unsteady effects The main flow patterns in the unsteady calculations are identical to the steady flow pattern exposed above. However, at the same coolant flow rate, the degree of coolant jet penetration and overall level of swirl in the upstream cavity could vary significantly between steady and unsteady solutions. The most noticeable unsteadiness affecting the stator well flow was found in the rim seal where asymmetric pressure and velocity profiles (Fig. 8) linked to the NGV position were identified (fixed position in the NGV frame). The high pressure region in Fig. 8 matches the trailing edge of the NGV. No such asymmetry could be transferred through the interface planes in the steady calculations, as data are circumferentially averaged through the mixing planes. Some very strong unsteadiness can also be seen behind the rotor blades. Successive wakes travelling downstream as the rotor blades pass the NGVs can clearly be seen behind the second set of rotor blades (secondary flows). Combined unsteady effects of the blades and NGVs affect the seal flow. This is confirmed by Fourier transforms of static pressures at three different monitoring points. The first point, situated near the upstream rim seal in the rotating zone, shows strongest unsteadiness linked to the NGV frequency (half of the blade frequency). The second point is situated in the downstream rim seal. Unsteadiness is again strongest at the NGV frequency. The third point is in the cavity, at mid-radius,
Fig. 8
Instantaneous static pressure (top) and axial velocity (bottom) in the upstream rim seal, Cc=2.15%.
Cooling effectiveness The cooling effectiveness ! is presented in Fig. 9 against the cooling flow presented as percentage of the main inlet annulus flow Cc. These parameters are defined as: Tgas ! Tdisc (1) "= Tgas ! Tcoolant and
C c = 100 .
m& c m& 1
(2)
with Tgas the relative total air temperature behind the exit of rotor 1, Tcoolant the relative total coolant flow temperature at the entrance of the cavity and Tdisc the rotor adia-
Virginie AUTEF et al.
Turbine stator-well flow modelling
batic disc temperature. ro in Fig. 9 is the outer radius of the cavity. The cooling effectiveness does not seem to be strongly affected by unsteadiness, though steady results tend to predict slightly higher effectiveness (better disc cooling) than unsteady ones in the upstream cavity. Since there is always some coolant flow ingested through the labyrinth seal, the downstream disc benefits even from low coolant flow, (high gradient at low Cc), which explains the different trends between the upstream and downstream cavities.
7
flow than the unsteady cases. Moreover, the labyrinth seal flow tends to slightly increase as the coolant mass flow increases. (ii)
The flow ingested in the cavity, through the rim seal, is assumed to come from the main annulus but in fact may contain coolant flow being re-ingested.
Fig. 10
Sketch of the upstream cavity.
The designations m& c and m& L correspond to coo-
Fig. 9
Cooling effectiveness against cooling mass flow on the upstream and downstream rotor discs.
Mainstream gas ingestion Flow can be ingested from the main annulus into both the upstream and downstream cavities, but the most critical rim seal in this configuration is the upstream one. As work is done in the main annulus, the temperature drops considerably, and by the time the flow reaches the second seal, its temperature is already considerably lower. Moreover, as mentioned previously, the downstream cavity will benefit even from small coolant flow rates, leading to overall lower temperature on the upstream disc of the downstream cavity. This ingestion study will concentrate on the upstream cavity.
lant and labyrinth seal mass flows, and the inward and outward mass flows through the rim seal are defined as in [16] by: 1 (3) m& in = ! # .(u.n " u.n ).dS 2 S 1 and (4) m& out = ! " .(u.n + u.n ).dS 2 S where S is a cutting surface through the rim seal, and n the local unity vector normal to the surface (outward direction). Assuming that m& c is only composed of flow coming from the coolant inlet, and m& in only of flow coming from the main annulus inlet, the average concentration of coolant flow in the upper section of the cavity can be estimated by:
!
2T
0
"=
!
2T
0
m& c . dt
(m& c + m& in ). dt
=
m& c m& c + m& in
(5)
Following other workers [17] and as explained below, an estimate of the sealing efficiency can be obtained based on the mass flow through the rim seal. Considering the upstream cavity, as shown in Fig. 10, this method has however two main restrictions: (i)
The splitting of outflow between labyrinth seal flow and upstream seal is not considered. This is quite limiting in this particular case, especially since the steady cases predict a lower labyrinth
Fig. 11
Evaluation of ingestion in the upstream cavity with the mass flow ratio through the rim seal ! .
8
Proceedings of the 8th International Symposium on Experimental and Computational Aerothermodynamics of Internal Flows
Fig. 11 presents a comparison of the mass flow ratio
! (sealing effectiveness) between the MP and SP cases. MP calculations predict lower ingestion than the SP calculations for a given coolant flow rate. This is consistent with what has been seen in Fig. 5. Since the labyrinth seal takes higher mass flow in the SP calculations than in the MP ones, it has to ingest more flow from the annulus (through the upstream seal) to complement the flow already coming from the cooling hole. Turbine performance effects Annulus mass flows are plotted against coolant mass flows in Fig. 12. Looking at the calculations for the annulus inlet flow only, it can be observed than the main flow rate does not stay constant but decreases slightly as the coolant mass flow rates increases, in both steady and unsteady calculations. Unsteady calculations predict overall higher annulus flow rates than steady calculations, but follow similar trends. Modelling the cavity seems to increase the main annulus flow rate, both the steady and unsteady calculations with the cavity predicting higher flow rates than the annulus only models.
The highest efficiency is obtained from the model with the reduced seal clearance, which also corresponds to the lowest labyrinth seal flow. Unsteady calculations with regular seal clearance always predict higher efficiency than steady calculations by approximately 5%. The efficiency of unsteady calculations also decreases as the coolant flow increases. However, there is very little effect at small flow rates. Agreement between the two efficiency methods is very good in all the unsteady calculations, and as a general rule the level of convergence obtained on momentum and mass balances on the cavity and global model are also better than the steady calculations. The large difference in efficiency between steady and unsteady calculations is not fully understood. It may be associated with some flow separation in the steady calculations.
Fig. 13
Influence of coolant mass flow on efficiency.
Conclusion
Fig. 12
Mass flow parameter m & To Po .
Turbine efficiencies are presented in Fig. 13. These are isentropic efficiencies taking account of both the main annulus and coolant inlet flows. The enthalpy based method seems to always predict around 0.75% higher efficiencies than the torque based method for steady calculations with coolant flow. Penalties in efficiency when introducing coolant flow rates are relatively low at low to medium flow rates, but then get worse with higher coolant rates. A coolant flow rate of around 1.5% would possibly appear as a good compromise between efficiently cooling the rotor discs, and more especially the upstream disc as it requires higher coolant flow rates to cool, and reducing turbine efficiency.
Using a model of the whole turbine including the stator well and a model of the annulus only to evaluate the influence of the cavity, flow predictions were successfully obtained from the CFD code Hydra using the Spalart-Allmaras turbulence model. Mass flow and adiabatic turbine efficiencies were obtained for both steady and unsteady simulations. Annulus only simulations predicted lower efficiencies than the full model, and showed little difference in efficiency between steady and unsteady models. Reducing the labyrinth seal clearance increased the efficiency. The unsteady model of the full geometry predicted higher efficiency and showed unsteady interaction between the main annulus flow and the cavity. Such unsteadiness was particularly noticeable in the upstream seal. A coolant flow was then introduced via coolant holes to cool the rotor discs. The influence of this coolant flow on the cavity flow and main annulus flow efficiency was studied. The flow pattern in the upstream cavity was affected by the amount of coolant flow supplied through the cooling hole. At low flow rates, all the cooling flow
Virginie AUTEF et al.
Turbine stator-well flow modelling
was directly sucked into the downstream cavity, through the labyrinth seal. As coolant flow rate increased, the flow requirements of the labyrinth seal flow were satisfied, allowing some coolant flow to penetrate into the upstream cavity and cool the upstream rotor disc. Distinct recirculation zones could be seen in both cavities. The downstream cavity flow pattern was not influenced much by the variation in cooling flow, as the variation of flow rate through the labyrinth seal was quite small. Increasing the coolant flow rate increased the cooling of both upstream and downstream discs; the downstream disc benefiting most at the lower cooling flow rate. However, increasing cooling efficiency adversely affects the overall turbine efficiency and the balance between those two has to be studied carefully, in connection with the resulting disc temperatures. It may be concluded that the calculated turbine performance is sensitive to both the modelling assumptions and the cooling flow. The trends predicted by steady and unsteady models were generally consistent. Two different methods of calculating the turbine efficiency were used: an enthalpy based method and a torque based method. The enthalpy based method always seemed to predict higher efficiencies than the torque based method. Consistency between those two methods was very good for the unsteady calculations, but discrepancies were noticed for steady calculations which might be explained by small mass flow imbalances. Results presented in this project were found to be in relatively good agreement with the few experimental data matching the running conditions chosen here which were available at the time of execution of this project. This study contributes to the understanding of cavity flows, and their interaction with the main annulus. It also gives insight into the use of cooling flow and its effect on efficiency.
Acknowledgements This work was funded by Rolls-Royce plc and EPSRC. The authors are grateful to colleagues at Rolls-Royce for their technical support and permission to publish this paper, and to Susanne Svensdotter for her useful comments on a draft of this paper. The authors would also like to thanks Peter Childs, Vassilis Stefanis and Sussex University for their experimental data.
References [1] Young, C.: Rolls-Royce, Private communication, (2006).
9 [2] Staub, F. W.: Rotor cavity flow and heat transfer with inlet swirl and radial outflow of cooling air, 92-GT-378, Proceedings of ASME International Gas turbine and Aeroengine Congress and Exposition, Cologne, Germany, (1992). [3] Djaoui, M., Dyment, A., Debuchy, R.: Heat transfer in a rotor-stator system with a radial inflow, Eur. J. B-Fluids, vol. 20, pp. 371-398, (2001). [4] Beretta, G.P., Malfa, E.: Flow and heat transfer in cavities between rotor and stator discs, Int. J. of Heat and Mass transfer, vol. 46, Issue 15, pp. 2715-2726, (2003). [5] Bohn, D.E., Decker, A., Ma, H. and Wolff, M.: Influence of sealing air mass flow on the velocity distribution in and inside the rim seal of the upstream cavity of a 1.5-stage turbine, GT2003-38459, Proceedings of ASME Turbo Expo 2003, Atlanta, Georgia, USA, (2003). [6] Bohn, E.D., Decker, A., Ohlendorf, N. and Jakoby, R.: Influence of an axial and radial rim seal geometry on hot gas ingestion into the upstream cavity of a 1.5-stage turbine, GT2006-90453, Proceedings of ASME Turbo Expo 2006, Barcelona, Spain, (2006). [7] Boudet, J., Autef, V.N.D., Chew, J.W., Hills, N.J. and Gentilhomme, O.: Numerical simulation of rim seal flows in axial turbines, The Aeronautical Journal, pp. 373-383, (2005). [8] Boudet, J., Hills, N.J. and Chew, J.W., Numerical simulation of the flow interaction between turbine main annulus and disc cavities, GT2006-90307, Proceedings of the ASME turbo expo 2006, Barcelona, Spain, (2006). [9] Cao, C. and Chew, J. W., Millington, P. R., Hogg, S. I.: Interaction of rim seal and annulus flows in an axial flow turbine, Transaction of the ASME, J Engineering for Gas Turbine and Powers, Vol. 126, pp 786-793, (2004). [10] Scanlon, T., Wilkes, J.: A simple method for estimating ingestion of annulus gas into a turbine rotor stator cavity in the presence of external pressure variations, GT2004-53097, Proceedings of ASME Turbo Expo 2004, Vienna, Austria, (2004). [11] Jakoby, R., De Vito, L., Larson, J., Lindblad, K., Zierer, T., Bohn, D., Decker, A., Funcke, J.: Numerical simulation of the unsteady flow field in an axial gas turbine rim seal configuration, GT2004-53829, proceeding of the ASME turbo expo 2004, Vienna, Austria, (2004). [12] Phadke, U.P., and Owen, J.M.: Aerodynamic aspect of the rim sealing of gas rotor-stator systems parts 1-3. Int J.Heat and Fluid Flow, vol.9, pp.98-117, (1988). [13] Hills, N.J., Chew, J.W., Green, T., and Turner, A.B.: Aerodynamics of turbine rim seal ingestion, 97-GT-268, Proceedings of ASME Turbo Expo 1997, Orlando, USA, (1997).
10
Proceedings of the 8th International Symposium on Experimental and Computational Aerothermodynamics of Internal Flows
[14] Dixon, J. A., Brunton, I. L., Scanlon, T. J., Wojciechowski, G., Stefanis, V. and Childs, P. R. N.: Turbine stator well heat transfer and cooling flow optimization, GT2006-90306, proceeding of the ASME Turbo Expo 2006, Barcelona, Spain, (2006). [15] Hills, N. J.: Achieving high parallel performance for an unstructured turbomachinery code, The Aeronautical Journal, to be published, (2007). [16] Georgakis, C., Whitney, C., and Woollatt, G., Turbine stator well CFD studies: Effect of upstream egress ingestion, GT2007-27406, Draft for the ASME Turbo expo
2007, Montréal, Canada, (2007). [17] Boudet, J.: Numerical simulation of rim seal flows in axial turbines, PUMA DARP project, deliverable D2-24C, University of Surrey internal report, TFSUTC/2005/05, (2005).