exception of Mason and Brown's SGS model with backscattering option) were highly dissipative near the surface and were unable to reproduce the correct ...
20 Turbulent Flow Modeling 20.1 Introduction..............................................................................................................................273 20.2 Principles....................................................................................................................................274 20.3 Methods of Analysis.................................................................................................................275 Direct Numerical Simulation • Large-Eddy Simulation • Reynolds-Averaged Navier–Stokes Modeling
20.4 Applications...............................................................................................................................278 Atmospheric Dispersion • Wind Energy • Evapotranspiration • Tropical Cyclones
Sukanta Basu North Carolina State University
20.5 Major Challenges......................................................................................................................281 References..............................................................................................................................................281
20.1 �Introduction To this date, we neither have a rigorous definition of turbulence nor a universal theory for it. Nevertheless, there is a consensus in the scientific community that a set of partial differential equations, known as the Navier–Stokes (N–S) equations, likely contains all the ingredients to accurately model turbulence. It is also agreed upon that most of the turbulent flows we encounter in our natural environment and also in engineering practice portray a few generic characteristics including: three-dimensionality; strong unsteadiness; propensity toward intense mixing and dissipation; occurrence of fine-scale intermittency; co-existence of coherent structures and random fluctuations; chaoticity and associated (un)predictability; and presence of a wide range of spatio-temporal scales. Even though modeling turbulent flows merely involves numerically solving the N–S equations, it is a rather challenging task and numerous scientists and engineers have been confronting it for the past 100 years or so. The persistence is not at all surprising given the immense importance of turbulence in a multitude of scientific fields. Currently, turbulence modeling activities in both academia and the industry are expanding at an incredible rate. The ongoing exponential growth in the (highperformance) computing capacity is at the root of this expansion, without any doubt. Thus, at the advent of petascale computing, the time is opportune to document the past achievements, the present status, and the future challenges of turbulent flow modeling. This chapter attempts to provide such information in a succinct manner. In contrast to other excellent reviews on this subject (e.g., Reynolds 1976;
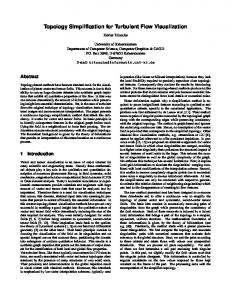
Rogallo and Moin 1984; Pope 2000), this chapter is focused on environmental flows rather than engineering flows. While the fundamental methodologies for modeling engineering and environmental turbulent flows are essentially the same, the latter one is often more difficult to model due to its high Reynolds number (Re) and also because of complex interactions among several physical processes (e.g., interactions among turbulence, radiative transfer, and cloud microphysics in atmospheric flows). Figure 20.1 visually bears witness to this assertion. These wake vortex streets over Alaska’s Aleutian Islands are strikingly similar to von Karman vortex streets observed in several engineering flows involving bluff bodies. Over the years, several successful simulations of von Karman vortex streets have been reported in the engineering literature. In contrast, realistic simulations of island wake vortex streets do not exist in the atmospheric science literature,* because they require the faithful representation of a multitude of flow phenomena, including: unstable atmospheric boundary layer turbulence; marine stratocumulus clouds; stably stratified turbulence in capping inversion layer; and mountain waves (Young and Zawislak 2006). There is no dearth of equally intriguing turbulent flows in various fields of environmental fluid mechanics (e.g., meteorology, limnology, and oceanography). Thus, a comprehensive account of modeling of all these diverse types of turbulent flows is beyond the scope of this chapter. Instead, we describe the basics of turbulent flow modeling by drawing numerous illustrations from the field of atmospheric boundary layers (ABLs). * To the best of our knowledge, only a handful of idealized simulations have been performed so far.
Handbook of Environmental Fluid Dynamics, Volume Two, edited by Harindra Joseph Shermal Fernando. © 2013 CRC Press/Taylor & Francis Group, LLC. ISBN: 978-1-4665-5601-0.
273
274
Handbook of Environmental Fluid Dynamics, Volume Two
FIGURE 20.1 Formation of wake vortices over Alaska’s Aleutian Islands. The cloud patterns clearly emphasize the underlying multiscaling traits of atmospheric flows. This satellite image was acquired by Landsat 7’s Enhanced Thematic Mapper plus sensor. (Image courtesy of USGS National Center for EROS, Sioux Falls, SD, and NASA Landsat Project Science Office, Greenbelt, MD.)
Owing to its high Re, ABL plays a critical role in advancing fundamental turbulence research. For decades, it has been a favorite playground for the theoretical physics community for testing a variety of universal scaling and similarity hypotheses. At the same time, ABL has immense practical importance as wide ranges of industrial (e.g., stack gas dispersion; wind energy generation), biological (e.g., pollen transport and deposition), natural (e.g., dust devil formation), and meteorological (e.g., cloud formation) activities take place in this turbulent layer.
20.2 �Principles The N–S equations for incompressible flows can be written as (using Einstein’s summation notation) follows:
∂2ui ∂ui ∂(uiu j ) 1 ∂p =− +ν + Fi + ∂x j ∂x j ∂x j ρ ∂x i ∂t
(20.1)
where t is the time xj is the spatial coordinate in the j direction uj is the velocity component in that direction p is the dynamic pressure ρ is the density ν is the kinematic viscosity Fi is a forcing term (e.g., geostrophic wind or imposed mean pressure gradient) The individual terms of Equation 20.1, from left to right, represent inertia, advection, pressure gradient force, viscous stress, and forcing, respectively. For high Re flows, the influence of molecular viscosity is quite insignificant (except very close to the
surface), so the viscous stress term is often neglected. For ABL simulations, terms describing buoyancy and rotational influences are usually included in Equation 20.1. Direct numerical simulation (DNS) is a method to solve the N–S equations (Equation 20.1) without any averaging, any filtering, or any other approximations. Owing to its precise representation of the N–S equations, DNS-generated datasets are considered to be of extremely high fidelity and are utilized to provide a better physical understanding of various types of turbulent flows (see for a recent example). Quite often, these datasets are used as complement to (or even substitute of) laboratory measurements. Furthermore, these datasets play a key role in the development, improvement, and validation of turbulence parameterizations. In DNS, all the scales of turbulent motions, from the energy-containing integral scale (L) to the energy-dissipating Kolmogorov scale (η), are computed. It is straightforward to show that L/η ~ Re 3/ 4, where Re is referenced to L. For geophysical turbulence (like ABL turbulence; Re ∼ 108), L is on the order of 1 km, whereas η is on the order of 1 mm. Therefore, to perform the DNS of ABL turbulence, one would need to have on the order of 106 (or more) grid points in each of the three co-ordinate directions. There is little doubt that the amount of computational resources needed to perform this kind of highperformance simulation will not be available to us in the foreseeable future. So, for the time-being, the only options we have are (1) to be complacent with the DNS of low/medium Re flows (i.e., L/η on the order of 103) and extrapolate the results to high Re number flows via heuristic arguments (e.g., the Reynolds number similarity hypothesis); or (2) to employ computationally less expensive methods (e.g., large-eddy simulation) which solve the N–S equations with certain approximations. In large-eddy simulation (LES), the larger scales of motion (more energetic; called resolved scale) are solved explicitly and the smaller ones (less energetic; called subgrid scale or SGS) are modeled. The separation of large and small scales is achieved via spatial filtering. When Equation 20.1 is filtered, one arrives at
∂τij ∂2u�i ∂u�i ∂(u�iu� j ) 1 ∂�p =− +ν + F�i − + ∂x j ∂x j ∂x j ∂x j ρ ∂x i ∂t
(20.2)
where tilde denotes a spatial filtering operation using a filter of characteristic width Δf (considerably larger than Kolmogorov scale η). The effects of the SGS (smaller than Δf) on the evolution of u˜i appear in the rightmost term of Equation 20.2. The SGS stress term, τij is defined as
�iu� j τij = u� iu j − u
(20.3)
This term arises due to the inherent nonlinearity of the advection term of Equation 20.1, which does not commute with the linear filtering operation. During the past decades, numerous SGS models have been proposed in the literature (Geurts 2003; Sagaut 2004). Each SGS model is based on distinct assumption(s). However, they share one common trait: they all attempt to
275
Turbulent Flow Modeling
mimic the forward energy cascade process by artificially draining energy from the resolved scales. Instead of only modeling the smaller scales of turbulence (as in LES), one can opt for a further parsimonious representation by modeling the entire spectrum of scales (from integral scale to Kolmogorov scale). This approach is known as Reynolds averaged Navier–Stokes (RANS) modeling. In this approach, one is solely interested in statistically averaged flow fields and not the instantaneous ones. In RANS modeling, every dependent variable in the N–S equations (i.e., Equation 20.1) is first decomposed into (ensemble or temporal) mean and turbulent fluctuations around the mean. This step is known as Reynolds decomposition. Then, the Reynolds averaging operation is invoked, which leads to the following RANS equations:
• The required grid-resolution for DNS is on the order of the Kolmogorov scale (η). The temporal resolution is always commensurate with the spatial resolution to avoid any numerical instability issues. • In DNS, more than 99.98% of the computational effort is usually devoted to resolving the dissipation range of turbulence (Pope 2000). In other words, less than 0.02% of the computational cost is attributed to the inertial range. • Prescribing realistic turbulent inflows for DNS is a challenging task. For this reason, periodic boundary conditions are used whenever feasible. • No-slip boundary conditions are used at solid walls.
20.3 �Methods of Analysis
Illustrative example In this section, we will briefly describe the DNS of neutrally stratified Ekman layer flows. In the following sections, we will use the same flow in order to compare different turbulence modeling methods. Over the past two decades, Coleman and his co-workers simulated neutrally stratified Ekman layer flows with increasing Re. Coleman et al. (1990) considered Re = 400 and 500 (based on geostrophic wind speed and the laminar Ekman layer depth). In 1999 and 2006, they conducted follow-up runs with Re = 1000 and 2000, respectively. This increasing trend is more or less consistent with the turbulence modeling community’s current belief that the Re achievable by DNS can be doubled every 5–6 years. For Re = 500, 1000, and 2000 runs, Coleman et al. used 128 × 128 × 50, 384 × 384 × 85, and 1024 × 1792 × 200 grid points, respectively. As theoretically expected, with increasing Re, the logarithmic region of the velocity profile was more pronounced (Figure 20.2a). Based on Figure 20.2b, Coleman et al. (2006) claimed that the value of the von Karman constant should be equal to 0.38 and not 0.4. Based on the high-fidelity DNS runs, they were also able to formulate Re-dependent similarity relationships for geostrophic drag coefficient (the ratio of surface friction velocity and geostrophic wind) and surface shear angle. Even though most of these results are rigorously valid only for low Re Ekman flows, their heuristic extrapolations (if hold) could have serious ramifications for ABL turbulence.
20.3.1 �Direct Numerical Simulation
20.3.2 �Large-Eddy Simulation
Key references The review paper by Moin and Mahesh (1998) provides a comprehensive account of the direct numerical simulation (DNS) of different types of turbulent flows (e.g., homogeneous isotropic turbulence; shear-free boundary layers) and also discusses associated computational issues. The readers are also encouraged to consult the recent report by Coleman and Sandberg (2009) for further technical details on DNS.
Key references The following references are recommended for a thorough description of large-eddy simulation (LES) and its various attributes Sagaut (2004), Geurts (2003), and Meneveau and Katz (2000).
∂(ui′u′j ) ∂2ui ∂ui ∂(uiu j ) 1 ∂p =− +ν + Fi − + ∂x j ∂x j ∂x j ∂x j ρ ∂x i ∂t
(20.4)
where overbar denotes the Reynolds averaging operation. ui′u′j , called the Reynolds stress, is parameterized by a turbulence closure model. As with the SGS models in LES, numerous RANS closure formulations exist in the literature (see Wilcox 1998). In the case of LES, the SGS models are only applied to scales which are much smaller than the flow-dependent integral scales. Thus, in theory, these models should be universally applicable for different types of turbulent flows without much modification. However, we are yet to discover any such universal SGS model. The hope still lingers on. On the other hand, since, by design, the RANS closure models are supposed to capture all the turbulent scales, they cannot be universal. As a result, these models are always tuned for different applications. There are some who believe that RANS is a methodology of the past and that LES will soon replace it. A recent article by Hanjalic (2005), aptly titled: “Will RANS survive LES? A view of perspectives,” elaborates on this contentious topic.
Salient computational features • Spectral methods or high-order finite difference schemes are typically used for DNS. • The required computational domain for DNS is a few times larger than the integral scale of the flow under consideration.
Salient computational features • The numerical methods and the lateral boundary conditions used for LES are quite similar to those used in DNS. • In LES, the dynamical complexity of turbulent flows under consideration is reduced by spatial low-pass filtering. The most commonly used filters are spectral cutoff, Gaussian, and box filters. The coarser the filter width (Δf), the higher the dependence of the simulated results on the employed SGS model.
276
Handbook of Environmental Fluid Dynamics, Volume Two 0.5 20
10
(a)
0 100
101
102
zu*/v
103
104
(b)
5
0.3
0.2 101
4
Ψ
u/u*
z du u* dz
–1
0.4
3 2 101
102
2
103
103
10 zu*/v
FIGURE 20.2 (a) Inner scaling of mean velocity component aligned with surface shear stress. (b) Effective logarithmic parameters. The dotted, dashed, and solid lines represent Re = 400, 1000, and 2000, respectively. In (a), normalized velocity magnitude for Re = 2000 is also shown (dashdotted line). The subplot in the right panel represents ψ = u–/u * − (1/0.38) In (zu*/v). (From Coleman, G.N. et al., DNS of the turbulent Ekman layer at Re = 2000, Direct and Large-Eddy Simulation VI, Springer, Berlin, Germany, Part IV, pp. 267–274, 2006. With permission.)
• The rule of thumb is that an LES should resolve at least 80% of total energy anywhere in the flow. Sometimes (e.g., near wall region, under stably stratified condition), it is not feasible to resolve 80% of the total energy. This type of simulation is then called a very large-eddy simulation or VLES. At present, all the documented LES results of ABL flows are actually VLES results. • It is common practice to take the ratio of filter width (Δf) to grid spacing (Δg) to be equal to 1 or 2. Please refer to Chapter 9 of Geurts (2003) for detailed discussion on this ratio and its impact on error dynamics. • Quite often, uniform grids are used in LES because the effects of grid non-homogeneity and anisotropy on SGS modeling are yet to be fully understood. • In addition to forward cascade of energy (large to small scales), some SGS models do allow for local reverse energy transfer (known as backscatter). It has been established that certain filters (specifically the spectral cutoff filter) can spuriously enhance the backscatter of energy. • In contrast to DNS, no-slip lower boundary conditions are rarely used in LES. In order to utilize this boundary condition, one needs to resolve the small-scale, energycontaining eddies near the wall. This would require very high grid-resolution (comparable to DNS) near the wall and would be computationally very expensive. An alternate approach is to use a wall function (an empirical relationship between the wall shear stress and the velocity at wall-adjacent grid points) as the lower boundary condition. 20.3.2.1 �Subgrid-Scale Models The eddy-viscosity models are the most commonly used subgrid-scale (SGS) models in the environmental fluid mechanics community. These models use the gradient hypothesis and formulate the deviatoric part of the SGS stress tensor as follows:
1 τij − τ kk δ ij = −2 νt S�ij 3
(20.5)
where
1 ∂u� ∂u� j S�ij = i + 2 ∂x j ∂xi
(20.6)
is the resolved strain rate tensor and νt denotes the eddy viscosity. From dimensional analysis, the eddy viscosity can be interpreted as the product of a characteristic velocity scale and a characteristic length scale. Different eddy-viscosity formulations use different velocity and length scales. The most popular eddy-viscosity formulation is the Smagorinsky model (Smagorinsky 1963):
νt = (CS ∆ f )2 S�
(20.7)
where CS is the so-called Smagorinsky coefficient, which is adjusted empirically or dynamically to account for shear, stratification, and grid resolution, and
12 S� = (2S�ij S�ij ) (20.8)
is the magnitude of the resolved strain rate tensor. In contrast to the Smagorinsky-type eddy-viscosity model, the one-equation eddy-viscosity model utilizes
12
νt = CK lESGS (20.9)
where CK is a modeling coefficient l is a length scale (related to Δf) ESGS is the SGS turbulent kinetic energy (TKE) This modeling approach involves solving a prognostic equation for ESGS in addition to the filtered momentum equations. It is well known that the eddy-viscosity SGS models give a poor prediction of the SGS stresses on a local level. Their underlying assumption of strain rates being aligned with the SGS stress tensor is unrealistic. Furthermore, these SGS models are purely dissipative; that is, they do not allow backscatter. Recognizing
277
Turbulent Flow Modeling
the inherent deficiencies of the eddy-viscosity SGS models, turbulence modelers proposed numerous non-eddy-viscosity-type SGS models (e.g., the similarity model). An extensive review of these SGS formulations is given by Sagaut (2004). Unfortunately, the non-eddy-viscosity-type SGS models have their own set of limitations (e.g., the lack of adequate dissipation in the case of the similarity model), and thus, they did not succeed to substantially reduce the usage of the eddy-viscosity SGS models. 20.3.2.2 �Dynamic SGS Modeling The values of the eddy viscosity-type SGS coefficients (e.g., CS) are well established for homogeneous, isotropic turbulence. However, these parameters are expected to be dependent on mean shear and stratification. Traditionally, various types of wall-damping functions (e.g., van Driest’s model) and stability correction functions are used to account for these physical effects. An alternative approach is to use the dynamic SGS modeling approach of Germano et al. (1991). In this approach, one computes the value of the unknown SGS coefficients (e.g., CS) dynamically at every time and position in the flow. By analyzing the dynamics of the flow at two different resolved scales and assuming scale similarity as well as scale invariance of the model coefficient, one can optimize its value. Thus, the dynamic model avoids the need for a priori specification and tuning of the SGS coefficients because they are evaluated directly from the resolved scales in an LES. Given the generic nature of the dynamic modeling approach, it has been extended for non-eddy-viscosity-type SGS models as well. 20.3.2.3 �Testing of SGS Models The SGS models and their underlying hypotheses can be evaluated by two approaches: a priori testing and a posteriori testing (Geurts 2003). In a posteriori testing, LES computations are actually performed with specific SGS models and validated against reference solutions (in terms of mean velocity, scalar 0.100
0.080
and stress distributions, spectra, etc.). However, owing to the multitude of factors involved in any numerical simulation (e.g., numerical discretizations, time integrations, averaging, and filtering), a posteriori tests, in general, do not always provide much insight about the detailed physics of the SGS model. A complementary and perhaps more fundamental approach is to use data from direct numerical simulations, laboratory experiments or field observations to compute the “real” and modeled SGS tensors directly from their definitions and compare them subsequently. This approach, widely known as the a priori testing, does not require any actual LES modeling and is theoretically more tractable. In the recent past, the ABL community has organized several field campaigns (e.g., horizontal array turbulence study—HATS) exclusively for a priori testing. Illustrative example Andren et al. (1994) conducted an intercomparison of LES models for a neutrally stratified Ekman layer flow (similar to the DNS studies by Coleman et al.). Here, we only report results related to the non-dimensional velocity gradient (ϕM). According to the similarity theory, in the surface layer, ϕM should be equal to one (the dashed line in the right panel of Figure 20.3). Andren et al. (1994) found that the non-dynamic SGS models (with the exception of Mason and Brown’s SGS model with backscattering option) were highly dissipative near the surface and were unable to reproduce the correct behavior of ϕM (left panel of Figure 20.3). The contemporary dynamic SGS models (and their variants) offer major improvements over the non-dynamic models (right panel of Figure 20.3).
20.3.3 �Reynolds-Averaged Navier–Stokes Modeling Key references The book by Wilcox (1998) is an excellent resource for RANS modeling. Alfonsi (2009) provides a recent review of this topic. 0.1
Andren/Moeng Mason/Brown, bsct Nieuwstadt Schumann/Graf Mason/Brown, nbsct
0.09 0.08
PASDD–SM PASDD–WL LASDD–SM LASDD–WL
0.07
zf/u*
zfC/u*
0.060
0.040
0.06 0.05 0.04 0.03
0.020
0.02 0.01
(a)
0.000 0.00
0.50
1.00 ΦM
1.50
2.00
0 (b)
0
0.5
1 ΦM
1.5
2
FIGURE 20.3 (a and b) Panels show simulated non-dimensional velocity gradients reported by Andren et al. (1994) and Anderson et al. (2007), respectively. The dashed line in the right panel corresponds to the value of 1.
278
Salient features • In contrast to DNS and LES, RANS can be utilized for both steady and unsteady simulations. • Typically, RANS modeling does not involve more than second-order accurate numerical schemes. • Since, in RANS, only averaged quantities are needed for inflow boundary conditions, their prescription is of a much lesser challenge compared to DNS and LES. The prescription of lower boundary conditions is also straightforward in RANS. • In general, RANS closure models have difficulties in simulating complex flows with pronounced vortex shedding. • RANS closure models can be used as wall models in LES. 20.3.3.1 �RANS Closure Models The Reynolds averaged Navier–Stokes (RANS) closure models can be broadly classified into four classes: (1) algebraic models, (2) one-equation models, (3) two-equation models, and (4) Reynolds stress equation models.* Qualitatively, the RANS algebraic models are similar to the Smagorinsky SGS model used in LES. These models parameterize the deviatoric part of the Reynolds stress tensor as a function of the stress-rate tensor of the mean field. The most popular RANS algebraic models are Cebeci–Smith model and Baldwin– Lomax model. In one-equation models, one uses a prognostic equation for TKE. Again, this approach is qualitatively similar to the oneequation modeling approach for LES. In this approach, the dissipation term is parameterized by making use of scaling arguments. In two-equation models, one solves two prognostic equations related to turbulence length and time scales. One of the most widely used models of this type is the K − ε model. In this case, one solves for TKE and mean energy dissipation rate (ε). The turbulence length and time scales are then proportional to 32 TKE /ε and TKE /ε , respectively. The Reynolds stress equation models involve a large number of prognostic equations (corresponding to all the Reynolds stress terms and energy dissipation rate) and a long list of tuning coefficients. These models outperform simpler algebraic and K − ε models for turbulent flows which are far from equilibrium. However, the complexity of these models has deterred their wide usage in various practical applications. Illustrative example Xu and Taylor (1997) simulated an Ekman layer using the K − ε model. They reported that this widely used RANS closure model was unable to reproduce the well-known Ekman spiral. To the best of our knowledge, all the DNS and LES studies of Ekman layers have always reproduced the Ekman spiral. The inability of the K − ε model to reproduce this key ABL feature was rather
Handbook of Environmental Fluid Dynamics, Volume Two
surprising and underlines the limitations of certain popular RANS closure schemes for environmental flows. A new RANS closure scheme proposed by Xu and Taylor (1997) was able to remedy this problem.
20.4 �Applications In this section, a mélange of turbulent flow modeling examples are presented.
20.4.1 �Atmospheric Dispersion In order to protect public health and environmental assets from potentially harmful air pollutants, one needs detailed spatiotemporal characterizations of these pollutants in the ABL. Given the scarcity of field observations of pollutants, atmospheric dispersion models traditionally play critical roles in determining compliance with National Ambient Air Quality Standards and other regulatory requirements. It is needless to point out that the accuracy of these models strongly depends on the quality of the ABL turbulence simulations. Here, as an illustrative example, we discuss the atmospheric dispersion of Radon (222Rn) and its progeny (e.g., 218Po, 214Pb). According to the Environmental Protection Agency (EPA), Radon is the number one cause of lung cancer among non-smokers, with 21,000 victims each year in the United States. Vinuesa et al. (2007) studied the diurnal evolution of 222Rn decaying family using a dynamic LES model. They reported several interesting results related to the transport and mixing of Radon and its daughters. For example, they found that a departure from secular equilibrium† between Radon and its short-lived daughters prevailed in the stably stratified nighttime boundary layer (see Figure 20.4). This disequilibrium was attributed to the proximity of the Radon source and the weak vertical transport during stable condition. Since a significant fraction of Radon was fresh, the Radon and progeny mixture was deficient in daughters. The mixing induced by convective turbulence induced a fast restoration of the secular equilibrium during the morning transition.
20.4.2 �Wind Energy Energy production is one of the critical issues facing the world. Fortunately, the wind energy industry has witnessed a significant surge in recent years. However, to make wind a cost-effective and reliable alternative energy source, the industry will need to make significant advancements on several fronts, including turbine micro-siting, wind resource assessment, short-term wind forecasting, and turbine inflow generation. We believe that the state-of-the-art turbulent flow modeling frameworks have the potential to make noteworthy †
* Please note that the ABL community follows a different classification of RANS models, originally proposed by Mellor and Yamada (1982).
The secular equilibrium is the condition according to which the ratio of the activities of the nuclide participating to the decay chain is equal to one.
279
Turbulent Flow Modeling
150
200
0.984
150
0.969
100
0.954
21
0
3
6 9 Time (h)
12
15
18
0.907 0.819 0.731 0.642
50
0.925
18
1.000
100
0.940
50
(a)
1.000 Height (m)
Height (m)
200
(b)
18
0.558 21
0
3
6 9 Time (h)
12
15
18
FIGURE 20.4 (See color insert.) Time-height plots of activity ratios of 218Po (a) and 214Pb (b) with respect to 222Rn. The S1/S 0 activity ratios are significantly different from one during nighttime conditions. The time axis denotes local time. (From Vinuesa, J.-F., Atmos. Chem. Phys., 7, 5003, 2007. With permission.)
contributions to some of these areas. In the following, we elaborate on the problem of turbine micro-siting. For turbine micro-siting projects over complex topography, the wind industry is progressively opting for computational fluid dynamics (CFD) models instead of the traditional mass-consistent and linear models. All of these commercial CFD models (e.g., Meteodyn, WindSim) essentially utilize RANS closures. An alternative and arguably better approach would be to use LES models. At present, due to high computational costs, LES models have not gained popularity in the wind industry. With the increasing accessibility to highperformance computing resources, it is plausible to envisage that the LES models will eventually find their place in a variety of micro-siting projects. A recent study by Bechmann and Sørensen (2009) compared the abilities of a RANS model and a newly proposed hybrid RANS/LES model to capture the observed features of atmospheric flows over a hill. They showed that both the RANS and the hybrid models were able to simulate the relatively simple windward flow quite accurately (see Figure 20.5). However, in the complex wake region, these models gave very different results.
Speed-up
0.5
20.4.3 �Evapotranspiration Evapotranspiration (ET; directly related to latent heat flux) represents the loss of water from the Earth’s surface through the combined processes of evaporation (from soil and plant surfaces) and plant transpiration. Its reliable estimation at multiple spatio-temporal scales is of paramount importance for a multitude of fields, including (but not limited to) agriculture, forestry, ecology, and meteorology. Albertson et al. (2001) developed a coupled framework, involving a LES model, a land-surface model, and satellite remote sensing data, which showed great promise in the estimation of ET (and other surface turbulent fluxes) over heterogeneous land surfaces (Figure 20.6). 0.1
Observed RANS LES
0.08 TKE/u2ref (–)
1
In terms of mean velocity, the RANS model’s performance was superior (Figure 20.5a). On the other hand, the hybrid RANS/ LES model outperformed the RANS model in the case of TKE estimation (Figure 20.5b). From these results, it is quite evident that there is still room for improvements for the RANS and LES models for high Re atmospheric flows.
0
Observed RANS LES
0.06 0.04
–0.5 0.02 –1 (a)
–1000
–500 0 500 Distance from HT (m)
1000
(b)
0 –1000
–500 0 Distance from HT (m)
500
FIGURE 20.5 Comparison of observed velocity speed-up (a) and turbulence kinetic energy (b) to RANS and hybrid RANS/LES simulations. The dashed line shows the RANS results while the full lines are for the hybrid RANS/LES. Measurements are marked with diamonds. (From Bechmann, A. and Sørensen, N.N., Wind Energy, 13, 36, 2009. With permission.)
280
Handbook of Environmental Fluid Dynamics, Volume Two Rn
7000
560
6000
550
X (m)
5000
540 530
4000
H
7000
300
400
6000
6000 250
5000
510 500
2000
(a)
5000
4000
200
3000
4000
250
3000 150
2000
200
2000
150
490
1000 0
350 300
520 3000
LE
7000
480 0
1000 2000 Y (m)
1000
470
0 (b)
100 0
1000 2000 Y (m)
1000 0 (c)
100 0
1000 2000 Y (m)
FIGURE 20.6 Large-eddy model simulated net radiation (a), surface sensible heat flux (b), and surface latent heat flux (c) fields. (From Albertson, J.D. et al., Water Resour. Res., 37, 1939, 2001. With permission.)
20.4.4 �Tropical Cyclones Given that almost every landfalling tropical cyclone (TC; e.g., hurricane) causes tremendous amount of physical destructions, massive economic impacts, and staggering loss of lives, their accurate forecasting and simulation is of utmost importance for meteorologists and atmospheric scientists. At present, numerical weather prediction (NWP) models can reasonably capture some of the structural features of TCs, such as eyewall or rainbands. However, these NWP models always parameterize the effects of small-scale turbulence (utilizing the RANS approach).
(a)
Recently, Rotunno et al. (2009) provided improved understanding of the effects of small-scale turbulence on TC dynamics, by performing LES of an idealized TC using a new-generation NWP model known as the weather research and forecasting (WRF) model. They used six nested domains of grid resolutions: 15, 5, 1.67, 0.556, 0.185, and 0.062 km. Turbulence was only (partially) resolved in the finest grid (Δ = 0.062 km). In the coarser domains, it was almost entirely SGS. In Figure 20.7, the simulated flow structures resulting from two different grid resolutions are shown (taken from Norton et al. 2009). The structural differences in the vertical vorticity fields near the TC eyewall are
(b)
FIGURE 20.7 (See color insert.) Vertical vorticity resulting from lower (0.185 km grid; a) and higher (0.062 km grid; b) resolution WRF simulations. Region shown (in both panels) is approximately 35 km in diameter. Note that the internal structure of the higher-resolution simulation could not be anticipated from the lower-resolution results. (From Norton, A. and Clyne, J., Analysis and visualization of high-resolution WRF hurricane simulation using VAPOR, 10th WRF Users’ Workshop, Boulder, CO, 2009. With permission.)
Turbulent Flow Modeling
simply stunning. More importantly, Rotunno et al. (2009) found strong dependence of simulated TC intensity on the amount of resolvable turbulence. This crucial result highlights the need for high-resolution turbulent flow modeling for accurate forecasting and simulation of TC.
20.5 �Major Challenges All the turbulent flow modeling approaches suffer from different technical challenges, which need to be addressed. For example, in order to apply DNS over complex geometries, we need to find a better way to prescribe inflow conditions. In LES, we need to find improved wall models and more robust SGS models which are less sensitive to grid resolution. Several higher-order RANS closure models are not realizable. All these challenging issues and more are extensively covered by Wilcox (1998), Moin and Mahesh (1998), Piomelli (1999), Pope (2004), and others. For brevity, these challenges will not be reiterated here. The author believes that the most difficult challenge confronting the environmental turbulent flow modelers is in the arena of turbulent model validation. There is a general consensus that we do not have rigorous theoretical results for environmental flows. As mentioned earlier in this chapter, we will not be able to perform DNS of high Re environmental flows in the foreseeable future. At the same time, environmental flow observations will (almost) always be corrupted by non-turbulent motions, measurement noises, sensor limitations, etc. So, in the absence of “truth” (i.e., rigorous theories or high Re DNS data or precise observations), how should one conduct rigorous model validation studies? The author sincerely hopes that the new generation of scientists and engineers will be able to answer this question.
References Albertson JD, Kustas WP, Scanlon TM. 2001. Large-eddy simulation over heterogeneous terrain with remotely sensed land surface conditions. Water Resour. Res. 37: 1939–1953. Alfonsi G. 2009. Reynolds-averaged Navier-Stokes equations for turbulence modeling. Appl. Mech. Rev. 62: 040802. Anderson WC, Basu S, Letchford CW. 2007. Comparison of dynamic subgrid-scale models for simulations of neutrally buoyant shear-driven atmospheric boundary layer flows. Environ. Fluid Mech. 7: 195–215. Andren A, Brown AR, Graf J, Mason PJ, Moeng C-H, Nieuwstadt FTM, Schumann U. 1994. Large-eddy simulation of a neutrally stratified boundary layer: A comparison of four computer codes. Q. J. R. Meteorol. Soc. 120: 1457–1484. Bechmann A, Sørensen NN. 2009. Hybrid RANS/LES method for wind flow over complex terrain. Wind Energy 13: 36–50. Coleman GN. 1999. Similarity statistics from a direct numerical simulation of the neutrally stratified planetary boundary layer. J. Atmos. Sci. 56: 891–900. Coleman GN, Ferziger JH, Spalart PR. 1990. A numerical study of the turbulent Ekman layer. J. Fluid Mech. 213: 313–348.
281
Coleman GN, Johnstone R, Ashworth M. 2006. DNS of the turbulent Ekman layer at Re = 2000. Direct and LargeEddy Simulation VI, Springer, Berlin, Germany, Part IV, pp. 267–274. Coleman GN, Sandberg RD. 2009. A primer on direct numerical simulation of turbulence—Methods, procedures and guidelines, Technical Report AFM-09/01, University of Southampton, Southampton, U.K. Germano M, Piomelli U, Moin P, Cabot WH. 1991. A dynamic subgrid-scale eddy viscosity model. Phys. Fluids A 3: 1760–1765. Geurts BJ. 2003. Elements of Direct and Large-Eddy Simulation. R. T. Edwards, Inc., Philadelphia, PA, 329pp. Hanjalic K. 2005. Will RANS survive LES? A view of perspectives. J. Fluids Eng.-Trans. ASME 127: 831–839. Mellor GL, Yamada T. 1982. Development of a turbulence closure model for geophysical fluid problems. Rev. Geophys. 20: 851–875. Meneveau C, Katz J. 2000. Scale-invariance and turbulence models for large-eddy simulation. Annu. Rev. Fluid Mech. 32: 1–32. Moin P., Mahesh K. 1998. Direct numerical simulation: A tool in turbulence research. Annu. Rev. Fluid Mech. 30: 539–578. Norton A, Clyne J. 2009. Analysis and visualization of highresolution WRF hurricane simulation using VAPOR. 10th WRF Users’ Workshop, Boulder, CO. Piomelli U. 1999. Large-eddy simulation: Achievements and challenges. Prog. Aerosp. Sci. 35: 335–362. Pope SB. 2000. Turbulent Flows. Cambridge University Press, Cambridge, U.K. 771pp. Pope SB. 2004. Ten questions concerning the large-eddy simulation of turbulent flows. New J. Phys. 6, doi:10.1088/1367–2630/6/1/035. Reynolds WC. 1976. Computation of turbulent flows. Annu. Rev. Fluid Mech. 8:183–208. Rogallo RS, Moin P. 1984. Numerical simulation of turbulent flows. Annu. Rev. Fluid Mech. 16: 99–137. Rotunno R, Chen Y, Wang W, Davis C, Dudhia J, Holland GJ. 2009. Large-eddy simulation of an idealized tropical cyclone. Bull. Am. Meteorol. Soc. 90: 1783–1788. Sagaut P. 2004. Large Eddy Simulation for Incompressible Flows (2nd edn). Springer, Berlin, Germany, 426pp. Smagorinsky J. 1963. General circulation experiments with the primitive equations. Mon. Wea. Rev. 91: 99–164. Vinuesa J-F, Basu S, Galmarini S. 2007. The diurnal evolution of 222Rn and its progeny in the atmospheric boundary layer during the Wangara experiment. Atmos. Chem. Phys. 7: 5003–5019. Wilcox DC. 1998. Turbulence Modeling for CFD (2nd edn). DCW Industries, Inc., La Cãnada, CA, 540pp. Xu D, Taylor PA. 1997. An E − ε − l turbulence closure scheme for planetary boundary-layer models: The neutrally stratified case. Boundary-Layer Meteorol. 84: 247–266. Young GS, Zawislak J. 2006. An observational study of vortex spacing in island wake vortex streets. Mon. Wea. Rev. 134: 2285–2294.