remote sensing Article
Two Algorithms for the Detection and Tracking of Moving Vehicle Targets in Aerial Infrared Image Sequences Yutian Cao 1,2 , Gang Wang 1, *, Dongmei Yan 1 and Zhongming Zhao 1 Received: 28 October 2015; Accepted: 28 December 2015; Published: 31 December 2015 Academic Editors: Gonzalo Pajares Martinsanz, Norman Kerle and Prasad S. Thenkabail 1 2
*
Institute of Remote Sensing and Digital Earth, Chinese Academy of Sciences, No.9 Dengzhuang South Road, Beijing 100094, China;
[email protected] (Y.C.);
[email protected] (D.Y.);
[email protected] (Z.Z.) University of Chinese Academy of Sciences, No.19A Yuquan Road, Beijing 100049, China Correspondence:
[email protected]; Tel.: +86-010-8217-8960
Abstract: In this paper, by analyzing the characteristics of infrared moving targets, a Symmetric Frame Differencing Target Detection algorithm based on local clustering segmentation is proposed. In consideration of the high real-time performance and accuracy of traditional symmetric differencing, this novel algorithm uses local grayscale clustering to accomplish target detection after carrying out symmetric frame differencing to locate the regions of change. In addition, the mean shift tracking algorithm is also improved to solve the problem of missed targets caused by error convergence. As a result, a kernel-based mean shift target tracking algorithm based on detection updates is also proposed. This tracking algorithm makes use of the interaction between detection and tracking to correct the tracking errors in real time and to realize robust target tracking in complex scenes. In addition, the validity, robustness and stability of the proposed algorithms are all verified by experiments on mid-infrared aerial sequences with vehicles as targets. Keywords: moving target detection and tracking; symmetric frame differencing; mean shift; infrared image sequence; aerial platform
1. Introduction Detection and tracking of moving targets is a process that involves finding targets of interest in every frame of an image sequence. Infrared technology has been used in research into target detection and tracking because of its advantages, including the ability to penetrate through fog, 24-h all-weather observations and imaging, and lack of sensitivity to changes in light conditions. However, infrared images have relatively low contrast and signal-to-noise ratios (SNR) and also contain little target information, and so the detection and tracking of moving targets using infrared imagery is difficult. In addition, the use of moving imaging platforms such as aircraft gives rise to the problems of background motion and low target resolution [1,2], and correspondingly raises the requirements for the detection and tracking technology that is used. As far as studies to date are concerned, infrared moving target detection algorithms can be roughly divided into background modeling [3–5], optical flow [6–8] and frame differencing [9–11] methods. For example, Akula et al. [12] used an initial set of frames without targets to construct a statistical background model and proposed an adaptive contour-based background subtraction technique for accurate moving target detection in infrared image sequences by producing binarized thin contour saliency map. Xu et al. [13] intelligently combined the Lucas Kanade optical flow method and the frame differencing method to effectively detect infrared targets in simulations where the detector was either static or moving. Bhattacharya et al. [14] analyzed and solved the problem of the traditional symmetric Remote Sens. 2016, 8, 28; doi:10.3390/rs8010028
www.mdpi.com/journal/remotesensing
Remote Sens. 2016, 8, 28
2 of 21
frame differencing algorithm using only three frames for moving target detection, and proposed that the frames used in cumulative-differencing detection can be determined by the image conditions so that the target region in an infrared aerial sequence can be easily detected. In the field of infrared target tracking, good results have been obtained in previous research using region-based [15,16], contour-based [17,18], model-based [19,20] and feature-based [21,22] algorithms. For example, Ling et al. [23] defined the evaluation criterion for the tracking effect and searched for the relatively accurate region similar to the reference region by maximizing the eigenvalues of the covariance matrix of the local complexity when the tracking error was large. Based on active contours, Salah et al. [24] combined a kernel photometric tracking term and a model-free shape tracking term to track several objects independently and accurately in infrared image sequences. Using a particle filter, Tang et al. [25] described the infrared target as being sparsely represented in an over-complete dictionary and thus effectively suppressed the influence of background and noise on target tracking. Yilmaz et al. [26], in contrast, tracked infrared targets in aerial sequences using both the distribution and intensity of the local standard deviation as target features in order to build the dual kernel density estimation of the mean shift. There have been many studies of infrared target detection and tracking and much progress has been made. However, not enough research using aerial moving platforms has been done. In the face of problems such as platform motion and scene change, detection and tracking algorithms with a high accuracy and good real-time performance remain undeveloped. Especially when the imaging scene is complex and contains targets with different attributes and motion characteristics, the rapid detection and accurate location of every moving target of interest becomes a real challenge. In view of the problems described above and the imaging characteristics of aerial infrared sequences, especially those acquired by vertical photography, a moving target detection algorithm (Section 2) and an improved target tracking algorithm (Section 3) for vehicle targets in aerial infrared sequences are proposed in this paper. The validity of the new algorithms is tested using three real aerial mid-infrared sequences (Section 4) after registration. After an analysis of the experimental results (Section 5), the practical application of the proposed algorithms is evaluated (Section 6). 2. Moving Target Detection The movement of the observation platform leads to big changes in the imaged scene in aerial sequences. In other words, the region covered by each image in a sequence varies as the camera moves. This limits the number of frames that have regions in common and produces pixel-level differences between images even after registration is carried out to compensate for the background motion. These problems cause difficulties for target detection methods such as background modeling. The frame differencing algorithm can reduce these problems to some extent and calculations made in real-time moving target detection using this algorithm are remarkably efficient [14]. For this reason, in this paper the traditional frame differencing algorithm is improved and developed to produce a new infrared moving target detection algorithm for aerial sequences. The proposed algorithm is given the name Symmetric Frame Differencing Target Detection Based on Local Clustering Segmentation (SFDLC). Figure 1 shows the flow of target detection using SFDLC. Before introducing the SFDLC, it is necessary to discuss the traditional symmetric frame differencing algorithm (SFD). SFD [27] is an improved detection method of traditional frame differencing that uses differencing between two frames. It chooses three successive frames in the image sequence to carry out the difference operation. Thus, the SFD can eliminate background detection caused by movement to accurately extract the target location and contour information. Setting f k´1 , f k , f k+1 as the three successive frames, SFD is described by the following three equations: d 1 “ | f k ´ f k ´1 |
(1)
d 2 “ | f k `1 ´ f k |
(2)
Remote Sens. Sens. 2016, 2016, 8, 8, 28 28 Remote
3 of 21
d = d ⊗d d “ d11 b d22 where d is the difference image, and ⊗ signifies “AND” operation. where d is the difference image, and b signifies “AND” operation.
(3) (3)
Figure 1. 1. Flow Flow chart chart of of Symmetric Symmetric Frame Frame Differencing Differencing Target Target Detection Detection Based Based on on Local Local Clustering Clustering Figure Segmentation (SFDLC) for target detection in aerial infrared image sequence. Segmentation (SFDLC) for target detection in aerial infrared image sequence.
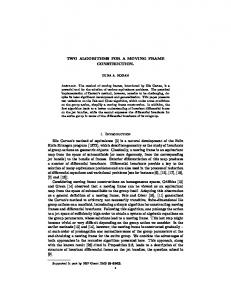
In most cases, cases,SFD SFDis is simple to use it performs moving target detection efficiently for In most simple to use and and it performs moving target detection efficiently for complex complex scenes. However, some situations in which traditional cannot produce scenes. However, there are there some are situations in which traditional SFD cannotSFD produce satisfactory satisfactory detection The first problem is that, because of the aerial platform, the detection results. The results. first problem is that, because of the motionofofthe themotion platform, camera aerial camera acquires images at a high frequency in order to acquire continuous, real-time acquires images at a high frequency in order to acquire continuous, real-time information about information about target. The real geographical and of motion the target the target. The realthe geographical location and statelocation of motion ofstate the target thus of change very thus little change very little between successive frames. In other words, the target displacement between the between successive frames. In other words, the target displacement between the successive frames after successive after registration is small, or the target is isslow-moving. is used to registrationframes is small, or the target is slow-moving. When SFD used to detectWhen these SFD “slow-moving” detect “slow-moving” targets, problems as thetargets “Hole arise Effect” and As false targetsinarise [28].2, targets,these problems such as the “Hole Effect” such and false [28]. shown Figure As shown in Figure 2, the diagonal-filled region of change caused by the motion of target is obtained the diagonal-filled region of change caused by the motion of target is obtained by differencing between by differencing between and fk-1. The vertical line-filled is obtained by differencing f k and f k´1 . The verticalfkline-filled region is obtained byregion differencing between f k and f k+1 .between Clearly, fthere k andis fk+1 Clearly, is a small area these of overlap between these two regions a detection “hole” a .small areathere of overlap between two regions and a detection “hole”and appears in the middle appears in the middle of the target detected in f k . of the target detected in f k .
3/20
successive frames after registration is small, or the target is slow-moving. When SFD is used to detect these “slow-moving” targets, problems such as the “Hole Effect” and false targets arise [28]. As shown in Figure 2, the diagonal-filled region of change caused by the motion of target is obtained by differencing between fk and fk-1. The vertical line-filled region is obtained by differencing between fRemote k and fk+1. Clearly, there is a small area of overlap between these two regions and a detection “hole” Sens. 2016, 8, 28 4 of 21 appears in the middle of the target detected in fk.
Remote Sens. 2016, 8, 28
Figure 2. “Slow-moving” target in three consecutive frames. In frame differencing result, the 3/20 Figure 2. “Slow-moving” target in three consecutive frames. In frame differencing result, the diagonal-filled region is obtained by differencing between f k and f k´1 ; the vertical line-filled region is diagonal-filled region is obtained by differencing between fk and fk-1; the vertical line-filled region is obtained by differencing between f k and f k+1 . obtained by differencing between fk and fk+1.
Because of the problem just described, this paper improves SFD by introducing the idea that clustering follows locating, and therefore proposes SFDLC to detect “slow-moving” targets in real time. On account of the grayscale consistency for a single target in the infrared image, SFDLC first locates the target by improved symmetrical differencing and then separates the entire target out by cluster analysis based on on the the preliminary preliminary location location result. result. The The SFDLC SFDLC algorithm algorithm can can be be described described in more detail as follows. as follows. Step 1.1.Image andand Binarization. The The difference images d1 anddd1 2 and are calculated by carrying ImageDifference Difference Binarization. difference images d2 are calculated by out symmetric differencing on three successive infrared images after registration, f , f and f carrying out symmetric differencing on three successive infrared images after registration, k+1 . k´1 k fk-1, fk and Then d1 and d2 are converted to binary images according to Equation (4),(4), which setssets a threshold T to fk+1. Then d1 and d2 are converted to binary images according to Equation which a threshold T distinguish between region of change caused by by thethe motion of target andand noise: to distinguish between region of change caused motion of target noise: # 0 0 di “ di = 255 255
i TT
(4) (4)
where TT was was set set as as 10 10 for for the the empirical empirical experimental experimental value. value. where Step 2. Region of Change Extraction and Description. to be be Step 2. Region of Change Extraction and Description. First First the the small small amount amount of of noise noise needs needs to removed by by median median filtering. filtering. Then Then the the non-zero non-zero pixel pixel blocks blocks in in dd1 and and dd2 are are extracted extracted to to represent represent removed 1 2 region of change caused by the motion of target, and the contours of these blocks are described by region of change caused by the motion of target, and the contours of these blocks are described by minimum enclosing rectangles (the dashed rectangles in Figure 3a). Due to the irregular shapes of minimum enclosing rectangles (the dashed rectangles in Figure 3a). Due to the irregular shapes of most most theregions real regions of change, use of minimum enclosing rectangles helpreal enlarge real of the of real of change, the usethe of minimum enclosing rectangles can helpcan enlarge regional regional contours to ensure a larger overlap (the red areas in Figure 3b) between the regions of contours to ensure a larger overlap (the red areas in Figure 3b) between the regions of change in d1 and in d1 and d2 produced by the same target. From the perspective of the traditional SFD dchange 2 produced by the same target. From the perspective of the traditional SFD algorithm, which may not algorithm, may not anyinoverlap asminimum that shown in Figure 2, using produce anywhich overlap such asproduce that shown Figure 2,such using enclosing rectangles is minimum a key way enclosing rectangles is a key way to generate d in Equation (3). to generate d in Equation (3).
Figure 3.3.(a) rectangles) of change produced by theby motion of target; Initial (a)Regions Regions(dashed (dashed rectangles) of change produced the motion of (b) target; (b)location Initial of the target (red areas). location of the target (red areas).
Step 3. Initial Location of the Target. The initial location of the moving target in fk is acquired from the calculation of d (the red areas in Figure 3b), which is the set of pixels corresponding to the overlap between the rectangles enclosing the areas of change in d1 and d2 Because d intersects with the real target to be detected in fk, in SFDLC, the location of d is taken as the initial location of the moving target.
Remote Sens. 2016, 8, 28
5 of 21
Step 3. Initial Location of the Target. The initial location of the moving target in f k is acquired from the calculation of d (the red areas in Figure 3b), which is the set of pixels corresponding to the overlap between the rectangles enclosing the areas of change in d1 and d2 Because d intersects with the real target to be detected in f k , in SFDLC, the location of d is taken as the initial location of the moving target. Step 4. Cluster Analysis. In order to extract the entire target in f k , a region of interest which is regarded as the likeliest area for the target to be present needs to be set first. In order to cover the initial location described in Step 3, this region is centered on d and defined as square because the direction of motion of the target is not yet set. The size of this region is determined by the size of the real target and also the image resolution, as described by Equation (5): L“
maxpl, w, hq ˆ2 c
(5)
where L is the side length of the region of interest; l, w, h are respectively the length, width and height of the target and c is the image resolution. Next, pixel clustering is carried out in the regions of interest centered on d using the K-means algorithm [29]. In this way, the regions of interest are divided into different clustering objects according to the different grayscales of the various targets in the infrared image. Also, the number of clustering categories used in the K-means algorithm is defined by the image. Because of the remote imaging distance and the uniform grayscale of the target, and as there are few occlusions, this number is usually set as 2 for vertical aerial photographs. Step 5. Target extraction. Because of the uniform grayscale of the target and the overlap between d and the target, the clustering objects that match d both in terms of grayscale category and location are taken to be the target candidates. On this basis, the target detection results are filtered out from the target candidates according to the possible area range of the real targets and these detected targets are represented in the final image, f k , by minimum enclosing rectangles. According to the above steps, SFDLC can be carried out to detect targets in every image of aerial infrared image sequence. 3. Moving Target Tracking Because of the lack of real-time information about the target, currently used tracking algorithms have difficulty in tracking infrared targets especially when the characteristics of the target and background change in complicated scenes. In this study, we aimed to produce a tracking method that is highly robust and accurate by drawing on the idea of Tracking Learning Detection (TLD) [30–32] and combining target tracking with real-time detection in order to realize real-time updating of the target model. Based on these ideas and the characteristics of infrared images, we investigated the use of kernel-based tracking theory [33], which has previously performed well in infrared target tracking [23,26]. As a result, a novel tracking algorithm referred to as the Kernel-Based Mean Shift Target Tracking Based on Detection Updates (MSDU) is proposed to realize stable target tracking in infrared aerial sequences. Kernel-based tracking theory, and the kernel-based mean shift target tracking (MS) algorithm, are based on the target features. Specifically, MS describes the target using a statistical distribution of features such as color; it takes the Bhattacharyya coefficient as the similarity measurement and searches for the pattern most similar to the target by gradient descent of the mean shift vector. In general, the MS algorithm involves little calculation, is highly robust and is well suited to tracking targets where there is little change in position. These characteristics are precisely the characteristics of targets in high-frequency aerial image sequences. However, MS easily produces the wrong convergence and finally leads to divergence when the overlap in features between the target and background is large or, in other words, when the contrast between target and background is low [26,34]. For better target tracking using infrared aerial sequences, the MSDU algorithm is proposed as an improvement of MS and brings the real-time target detection in the tracking process. In MSDU,
Remote Sens. 2016, 8, 28
6 of 21
the detection result is first used to discover and track the emerging target in good time; it is also used to selectively update the tracking model of the tracked target to produce improved tracking of the target and its trajectory. The theory relevant to the MSDU algorithm and the steps involved in the algorithm are discussed in detail below. 3.1. Target Description Based on the Kernel Function Histogram In MSDU, the gray space is chosen as the feature space of the infrared target and the histogram of gray levels based on the kernel function is accordingly taken as the descriptive model of the infrared target area in the image. The attributes of a specific target are represented by a rectangle describing the target’s location and size and so the target area is also a rectangle. The model of the target is thus assumed to be a rectangular region centered on the point y* ( and consisting of n points expressed as xi˚ i“1,¨¨¨ ,n . By dividing the gray space of this rectangular region into m equal divisions, the kernel function histogram of the target model can be written as ˆ ˚ q “ tqˆu py˚ quu“1,¨¨¨ ,m : qpy qˆu py˚ q “ C1
n ÿ
kp||
i “1
y˚ ´ xi˚ 2 || qδrbpxi˚ q ´ us, h1
u “ 1, ¨ ¨ ¨ , m
(6)
ř ˚ where C1 denotes the normalization constant such that m u“1 qˆu py q “ 1; k(x) is defined as the profile function of the kernel function; h1 is the window width of k(x); δ is Kronecker Delta function satisfying řm ˚ ˚ u“1 δ “ 1; and bpxi q is the quantized value of the pixel at xi . Similarly, the target candidate centered on point y can be described by the kernel function ˆ histogram as ppyq “ t pˆ u pyquu“1,¨¨¨ ,m : pˆ u pyq “ C2
s ÿ
kp||
i “1
y ´ xi 2 || qδrbpxi q ´ us, h2
u “ 1, ¨ ¨ ¨ , m
(7)
ř where C2 denotes the normalization constant such that m u“1 pˆ u pyq “ 1, s denotes the total number of points in rectangular region of the target candidate, and h2 is the window width of k(x). In this study, the Epanechnikov kernel function, expressed as KE (x), was selected to calculate k(x). In terms of the integral mean square error, KE (x) is the most suitable of the commonly used kernel functions; it can be calculated according to: $ & 1 ´1 c pd ` 2qp1 ´ k x k2 q, KE pxq “ 2 d % 0,
kxkă1 kxkě1
(8)
where cd denotes the volume of a d-dimensional sphere and can be set to π. 3.2. Target Location Based on Mean Shift Mean shift is a method of estimating probability density extrema by continuously moving the point estimation to the position of the sampling mean. In MSDU, mean shift theory is used to move the target candidate to the location most similar to that of the target model. In fact, this location corresponds exactly to the most likely new target location. To find this location, the Bhattacharyya coefficient, written as ρpyq, ˆ is chosen as the similarity measure between target candidate and target model. ρpyq ˆ gets larger as the similarity increases and the location where ρpyq ˆ reaches its maximum is the correct target location.
Remote Sens. 2016, 8, 28
7 of 21
ˆ ˆ ˚ q is expressed as: In the process of target location, ρpyq ˆ relating ppyq and qpy ˆ ˆ ˚ qs “ ρpyq ˆ ” ρr ppyq, qpy
m b ÿ
pˆ u pyqqˆu py˚ q
(9)
u “1
In addition, the iterative calculation of the new target candidate location (y1) using the mean shift vector can be written as: s ř y ´ xi 2 xi ωi gp|| || q h i “1 (10) y1 “ s ř y ´ xi 2 ωi gp|| || q h i “1 where gpxq “ ´k1pxq, and tωi ui“1,¨¨¨ ,s denotes the weight coefficient which can be calculated as: ωi “
m ÿ u “1
d
qˆu py˚ q δrbpxi q ´ us pˆ u pyq
(11)
According to Equation (10), the location of the target candidate is iteratively calculated until the calculated location maximizes ρpyq. ˆ 3.3. Target Model Updating Based on Detection During the tracking process, a conventional tracking algorithm such as MS assumes that the target model is invariable. Therefore, the tracking will be adversely affected by changes in the target and background during the process. However, this effect can be controlled by taking advantage of real-time target information for model updating. For the collection of real-time target information, MSDU draws lessons from TLD and uses the real-time target detection results as a priori knowledge. To be specific, the detection results give real-time information about the target, and consequently, if there is an obvious difference between the detection results and the tracking results, the tracking results are probably not believable. Because of this, in MSDU, the tracking results are compared with their nearest-neighbor matched detection results in order to decide whether the tracking is effective and whether to update the current target model. Once the effectiveness of the tracking has been shown to be low, the target model is updated using the detection results in order to give accurate target tracking. In practice, the target model is updated according to the following two criteria. 3.3.1. Tracking Effectiveness Evaluation Criterion The tracking effectiveness is evaluated by taking similarity in the spatial domain, δ, as measure. The δ between the detection result and its nearest-neighbor matched tracking prediction is expressed as the Euclidean distance between their centers: b pxdtc ´ xtrk q2 ` pydtc ´ ytrk q2 δ“ (12) dtrk where (xdtc , ydtc ) is the detection central point, (xtrk , ytrk ) is the tracking central point, dtrk is the tracking diameter. As shown in Equation (12), a higher value of δ indicates a bigger difference between the detection result and its matched prediction. In MSDU, ε is defined as the threshold of difference in the spatial domain between the detection result and its matched tracking result. If δ is greater than ε, the similarity between the detection and tracking results is low. In this case, the tracking is more likely to be inaccurate and the tracking effectiveness will be evaluated as poor. In contrast, if δ is smaller than ε, the tracking effectiveness will be evaluated as good.
Remote Sens. 2016, 8, 28
8 of 21
The value of ε can be set according to the requirement of tracking accuracy in practical application. The higher the accuracy requirement is, the smaller the value of ε needs to be set. In this case, the minor difference between the detection result and the tracking result can be valued and the frequency of tracking model updating may increase. In contrast, the bigger value of ε may lead to a lower tracking accuracy. On account of the detection result used in MSDU not being exactly the same as the true target, ε was set as 0.1 in the experiment to avoid the unreliable evaluation on tracking effectiveness caused by the detection results, and also to find the possibly inaccurate tracking result in time for ensuring a high tracking accuracy. 3.3.2. Tracking Model Updating Criterion Once δ is greater than ε, MSDU begins to seek accurate detection results in the subsequent frames as the real-time target information to be used for the correction of the tracking. As the target shape and size vary little between multiple consecutive frames in a high-frequency sequence, the detection result is considered to be accurate if there is a nearest-neighbor matched tracking result and the following morphological difference formula is satisfied: $ widthdtc ´ widthtrk ’ ’ ăτ & widthtrk heightdtc ´ heighttrk ’ ’ ăτ % heighttrk
(13)
where widthtrk and heighttrk , respectively, denote the width and height of the tracking result; widthdtc and heightdtc , respectively, denote the width and height of the detection result; τ is the shape stability threshold. Once the accurate detection result has been obtained, the target model qˆ needs to be replaced and updated; the status attributes, such as the location, of the target are then determined and changed accordingly. In MSDU, τ can be set according to the target detection effectiveness. Due to the slow change of target between the successive frames in the high-frequency image sequence, the more accurate the detection result is, the smaller the value of τ can be set to find a satisfactory detection result for updating the tracking model in a timely manner, and the model turns out to be more reliable. In contrast, the bigger the value of τ is, the less accurate the target detection needs to be, and the tracking model can be updated more frequently but less reliably. However, the inexact detection result with rather low accuracy has little practical significance and cannot be taken as the tracking model. Therefore, in the experiment, it was assumed that the detection result was available if the difference between the height and also the width of the detection result and the real height and width of target was smaller than 10% of the real ones. In this case, τ was set as 0.1 under the premise of only selecting detection results with relatively high precision for updating, to improve the accuracy and stability of target tracking by a timely updating tracking model. 3.4. Kernel-Based Mean Shift Target Tracking Based on Detection Updates (MSDU) Process Setting qˆ as the target model and yˆ0 as the target position in the preceding frame, MSDU is implemented according to the following steps. (1) The target position in the current frame is initialized as yˆ0 and, accordingly, the target candidate ˆ yˆ0 q, calculated by Equation (7). can be expressed as pp ˆ yˆ0 q, qs ˆ is calculated according to Equation (9). (2) The value of ρr pp (3) By computing and using tωi ui“1,¨¨¨ ,s , the new position, yˆ1 , of the target candidate is estimated using Equation (10). ˆ yˆ1 q and ρr pp ˆ yˆ1 q, qs ˆ is recalculated. (4) The target candidate is updated as pp
Remote Sens. 2016, 8, 28
9 of 21
ˆ ă ρr pp ˆ yˆ1 q, qs ˆ is satisfied, yˆ0 “ yˆ1 is performed until this condition is ˆ yˆ0 q, qs (5) If the condition ρr pp not met or ||yˆ1 ´ yˆ0 || ă 1. Through this iteration process, the similarity coefficient between the target model and candidate reaches a maximum and thus the final location of the target candidate is just the tracking result. (6) All targets are tracked respectively according to the above steps, and the tracking results are nearest-neighbor matched with the target detection results to determine whether a new emerging target has been detected. Once a new target exists, timely tracking of it is necessary. (7) A judgment regarding the validity of the tracking is made based on the tracking effectiveness evaluation criterion. (8) If the tracking effectiveness is poor, qˆ is updated according to the tracking model updating criterion. If this updating succeeds, a new qˆ will be used for subsequent tracking. 4. Experimental Data In order to verify the validity and accuracy of the proposed detection and tracking algorithm for infrared moving targets, a series of experiments was carried out using aerial mid-infrared image sequences with multiple vehicles in the sequences as the experimental targets. In addition, the experiments were carried out on an Intel(R) 3.1 GHz computer with 4.0 GB RAM, and all algorithms were implemented using Visual C++ and the OpenCV library. 4.1. Data To verify the effectiveness of the algorithm proposed in this paper, the three mid-infrared image sequences A, B and C, which had the different imaging heights, backgrounds and target characteristics shown in Table 1, were chosen as the experimental data. These experimental sequences were acquired by vertical photography in the vicinity of Yantai Port located in Shandong province, China between 18:30 and 19:30 local time on 6 October 2014. The instrument used was from the Telops Infrared Camera Series—more specifically, the camera had a mid-infrared lens. During the data acquisition, the camera was fixed to the aircraft and images were acquired at a frequency of 50 Hz, namely 50 frames per second. The images acquired were 640 ˆ 512 pixels in size and the gray level of the pavement background was high because of its high temperature. The experimental targets, the moving vehicles, had relatively low grayscale values. Table 1. Specification of experimental sequences. Image Characteristics Sequence
Target Characteristics
Total Number of Frames
Resolution (m)
Imaging Height (m)
Total Number
Direction of Movement
138 171 128
0.20 0.45 0.64
400 700 1000
2 7 5
Same Opposite Opposite
A B C
4.2. Data Pre-Processing In order to better detect, track and locate moving targets in the aerial image sequences, the images needed to be pre-processed. The primary task of the pre-processing was to convert the problem of the dynamic background into a static background problem; that is, all the images in one sequence had to be aligned with a single datum in order to compensate for their ego-motions. In this verification experiment, the registration method based on SIFT feature matching [35] was used to align the images in each experimental sequence. During registration, the reference image was changed to the currently aligned image once every ten images. In this way, the sustainability of the registration process could be ensured by aligning all the images in all three experimental sequences and the cumulative registration error was reduced to less than 2 pixels. In addition, the noise in all the images was removed during
Remote Sens. 2016, 8, 28
10 of 21
the pre-processing process by the use of a median filter. This reduced the effect of noise on the tracking accuracy. Remote Sens. 2016, 8, 28 The experimental images after pre-processing are shown in Figure 4.
Figure 4. the 50th frame of of Sequence A; 4. Images Images in in the theexperimental experimentalsequences sequencesafter afterpre-processing: pre-processing:(a)(a) the 50th frame Sequence (b) thethe 50th frame of Sequence B and (c) the 50th50th frame of Sequence C. C. A; (b) 50th frame of Sequence B and (c) the frame of Sequence
5. Results Resultsand andDiscussion Discussion 5.1. Detection Experiment Results After pre-processing, experimental sequences described above werewere takentaken as theas target pre-processing,the thethree three experimental sequences described above the detection sequences. For comparison, the SFDLC algorithm, the traditional SFD SFD algorithm andand the target detection sequences. For comparison, the SFDLC algorithm, the traditional algorithm Accumulative Frame Differencing (AFD)(AFD) algorithm [36] were detecttomoving the Accumulative Frame Differencing algorithm [36]each wereused eachto used detect vehicles moving in these sequences. In each case, thecase, areathe range the detectable targets targets was setwas to the vehicles in these sequences. In each areafor range for the detectable set same to thevalue, same based the on vehicle type common in the imaging region.region. value, on based the vehicle type common in the imaging AFD isisanan improved frame differencing algorithm which has proved be usefultoin be slow-moving improved frame differencing algorithm which hastoproved useful in target detection [14,37,38]. In the experiment, number of the frames usedofinframes the AFD was the slow-moving target detection [14,37,38]. In thethe experiment, number used inset theasAFD average of the maximum minimum number of frames required for the required targets tofor move distance was set as average of and the maximum and minimum number of frames the atargets to equal their own length. Thisown was length. done inThis order to ensure real-time capability of the algorithm move to a distance equal to their was done inthe order to ensure the real-time capability while number of false of the reducing algorithmthe while reducing thetargets. number of false targets. The target experimental results are shown in Figures The subsequent targetdetection detection experimental results are shown in 5–7. Figures 5–7. The quantitative subsequent evaluation the validity SFDLC was onwas these results. quantitativeofevaluation ofof the validity ofbased SFDLC based on these results. Looking detection results, SFDLC, in most cases, cases, can detect different Looking atatthe theoverall overall detection results, SFDLC, in most can intact detecttargets intactoftargets of sizes approximately equal to those of the real targets. In addition, SFDLC can effectively remove different sizes approximately equal to those of the real targets. In addition, SFDLC can effectively the impact noise and eliminate false targets. contrast, cannot detect all intact in remove theofimpact of noise and eliminate falseIntargets. In SFD contrast, SFD cannot detect targets all intact most images due to thedue detection “hole”; however, it is good at smaller targets in targets the same targets in most images to the detection “hole”; however, it isdetecting good at detecting smaller in sequence changes more obvious forobvious smaller for targets moving at similar and the same because sequencethe because theare changes are more smaller targets movingspeeds at similar thus “hole” may “hole” not arise in these smaller targets. In addition, SFD is relatively poor at limiting speeds and thus may not arise in these smaller targets. In addition, SFD is relatively poorthe at amount of noise compared with SFDLC. For this reason, false targets occur when the minimum area limiting the amount of noise compared with SFDLC. For this reason, false targets occur when the restriction therestriction detectablefor target small, as shown results using are minimum for area theisdetectable target in is Figure small,7f. asThe shown in obtained Figure 7f. TheAFD results also unsatisfactory. the cumulativeBecause calculations, can detect most targets with area obtained using AFDBecause are alsoofunsatisfactory. of theAFD cumulative calculations, AFD canan detect far greater than thean real target’s area and thus a large number of false targets caused by noise. most targets with area far greater than theproduces real target’s area and thus produces a large number of In addition, shownby in noise. FigureIn 6g,addition, the AFD as delay phenomenon obvious, which means that a target false targetsascaused shown in Figureis6g, the AFD delay phenomenon is can only be detected completely by AFD for a certain number consecutive frames. obvious, which means that a target canafter onlymoving be detected completely by of AFD after moving for a certain number of consecutive frames. In order to quantitatively evaluate the detection results, the parameters Probability of Detection (PD) and False Alarm Rate (FAR) [14] were used. TPk 1 N PD = × 100% (14) N k =1 TPk + FN k
where TPk is the number of pixels detected in frame k that belong to the real target, FNk is the number of pixels belonging to the real target but not detected in frame k, and N is the total of frames in the sequence.
Remote Sens. 2016, 8, 28
11 of 21
In order to quantitatively evaluate the detection results, the parameters Probability of Detection (PD) and False Alarm Rate (FAR) [14] were used. PD “
N 1 ÿ TPk ˆ 100% N TPk ` FNk
(14)
k “1
whereSens. TPk2016, is the number Remote 8, 28
of pixels detected in frame k that belong to the real target, FNk is the number of pixels belonging to the real target but not detected in frame k, and N is the total of frames in the sequence. FPk 1 NN FAR = 1 ÿ (15) FPk × 100% FAR “ N k =1 TPk + FP ˆ 100% (15) k N TPk ` FPk k “1 where FPk is the number of pixels detected in frame k that do not belong to the real target. where FPk is the number of pixels detected in frame k that do not belong to the real target.
Figure 5. 5. Target Target detection detection results results for for Sequence Sequence A. A. The The area area range range for for the the detectable detectable targets targets was was set set Figure from 80 pixels to 350 pixels. Red rectangles are used in parts (a–c) respectively to represent the results from 80 pixels to 350 pixels. Red rectangles are used in parts (a–c) respectively to represent the obtained using SFDLC for the for 10th, and 100th blue rectangles are usedare in used partsin (d–f) to results obtained using SFDLC the55th 10th, 55th andframes; 100th frames; blue rectangles parts represent the corresponding results obtained using SFD; and green rectangles are used in parts (g–i) to (d–f) to represent the corresponding results obtained using SFD; and green rectangles are used in represent the corresponding results obtained using AFD. parts (g–i) to represent the corresponding results obtained using AFD.
Remote Sens. 2016, 8, 28 Remote Sens. 2016, 8, 28
12 of 21
Figure 6. 6. Target detection results results for for Sequence Sequence B. B. The The area area range range for for the the detectable detectable targets targets was was set set Figure Target detection from 20 pixels to 800 pixels. Red rectangles are used in parts (a–c) respectively to represent the from 20 pixels to 800 pixels. Red rectangles are used in parts (a–c) respectively to represent the results results obtained using SFDLC for the 10th, 55th andframes; 100th frames; blue rectangles used in parts obtained using SFDLC for the 10th, 55th and 100th blue rectangles are usedare in parts (d–f) to (d–f) to represent the corresponding resultsusing obtained SFD;rectangles and greenare rectangles are used in represent the corresponding results obtained SFD;using and green used in parts (g–i) to parts (g–i) to represent the corresponding results obtained using AFD. represent the corresponding results obtained using AFD.
12/20
Remote Sens. 2016, 8, 28 Remote Sens. 2016, 8, 28
13 of 21
Figure 7. Target detection results for Sequence C. The area range for the detectable targets was set from 9 pixels to 200 pixels. Red rectangles are used in parts (a–c) respectively to represent the results obtained using SFDLC SFDLC for the 10th, 55th and 100th frames; blue rectangles rectangles are used in parts (d–f) to represent the the corresponding correspondingresults resultsobtained obtainedusing usingSFD; SFD;and andgreen greenrectangles rectangles used parts (g–i) areare used in in parts (g–i) to represent thethe corresponding results obtained using AFD. to represent corresponding results obtained using AFD.
A quantitative evaluation of the the moving moving target target detection detection experiment experiment using using these these A quantitative evaluation of of the the results results of two measures is shown in Table 2. two measures is shown in Table 2. Table 2. Quantitative evaluation of moving target detection.
Sequence A Sequence A MethodMethod PD (%) FAR (%) PD (%) FAR (%) SFDLC 93.95 25.94 SFDLC 93.95 25.94 SFD 29.61 28.14 SFD 29.61 28.14 AFD AFD 59.98 59.98 78.25 78.25
Sequence B PD (%) FAR (%) PD (%) FAR (%) 90.52 36.31 90.52 36.31 47.97 22.23 47.97 22.23 43.88 58.32 43.88 58.32 Sequence B
Sequence C PD (%) FAR (%) PD (%) FAR (%) 86.97 21.63 86.97 21.63 52.46 48.74 52.46 48.74 55.9355.93 77.35 77.35 Sequence C
It can be seen that SFDLC has the highest PD (90.48% on average) and the lowest FAR (27.96% It can be seen that SFDLC has the highest PD (90.48% on average) and the lowest FAR (27.96% on average) than SFD and AFD. The PD for SFDLC falls slightly from 93.95% to 90.52%, and then to on average) than SFD and AFD. The PD for SFDLC falls slightly from 93.95% to 90.52%, and then to 86.97% as the imaging height increases from 400 m to 700 m, and then to 1000 m. This is because both 86.97% as the imaging height increases from 400 m to 700 m, and then to 1000 m. This is because both the target resolution and also the difference in gray level between the target edge and background both decrease as the imaging height increases, and thus the regions of targets detected by the 13/20
Remote Sens. 2016, 8, 28
14 of 21
Remote Sens. 2016, 8, 28
the target resolution and also the difference in gray level between the target edge and background grayscale clustering accordingly becomes smaller than the the regions regionsof oftargets real targets. In contrast, the PD both decrease as the imaging height increases, and thus detected by the grayscale for SFD (43.35% on average) is low but increases as the imaging height increases because the smaller clustering accordingly becomes smaller than the regions of real targets. In contrast, the PD for SFD targets obvious is change canincreases be more as easily detected height in Sequence B and Sequence C by SFD than (43.35%with on average) low but the imaging increases because the smaller targets the targets withcan “slow” change. Although increases from 29.61% to 52.46%, the FAR withbigger obvious change be more easily detectedthe in PD Sequence B and Sequence C by SFD than the for SFD accordingly increases sharply from 28.14% to 48.74%. In addition, due to the level at which bigger targets with “slow” change. Although the PD increases from 29.61% to 52.46%, the FAR for SFD the number increases of framessharply included in the accumulative setto and area restriction for the accordingly from 28.14% to 48.74%. calculation In addition,isdue thethe level at which the number detectable targets, AFD accumulates changes from many frames leading to a high FAR (71.31% on of frames included in the accumulative calculation is set and the area restriction for the detectable average) but a low PD (53.26% on average). targets, AFD accumulates changes from many frames leading to a high FAR (71.31% on average) but a low PD (53.26% on average). 5.2. Tracking Experiment Results 5.2. Tracking Experiment Results After the effectiveness of the SFDLC algorithm had been verified, a tracking experiment based on the SFDLC target detection results was carried out. thisverified, experiment, the use of MSDUbased and MS After the effectiveness of the SFDLC algorithm hadIn been a tracking experiment on to moving targets was compared. A quantitative analysisthe of use the tracking was thetrack SFDLC targetvehicle detection results was carried out. In this experiment, of MSDUresults and MS to then In the experiment, by settingAhquantitative as half the target sizeof[33], as 0.1, and τ as was 0.1, each trackcarried movingout. vehicle targets was compared. analysis the εtracking results then target bethe tracked individually because thethe large distances between carriedcould out. In experiment, by setting h as of half target size [33], ε as 0.1,them. and τ as 0.1, each target trackingindividually results for representative vehicle targets between in sequences couldThe be tracked because of the large distances them.A, B and C are shown in Figures The8–10. tracking results for representative vehicle targets in sequences A, B and C are shown in By 8–10. analyzing and comparing the experimental results, it can be seen that MSDU can produce Figures goodBy results that match the real targets. With the helpresults, of target information, targets are analyzing and comparing the experimental it detection can be seen that MSDUthe can produce accurately located by MSDU fortargets. appropriate andhelp timely updating of theinformation, target models. contrast, good results that match the real With the of target detection theIntargets are the tracking resultsbyobtained byappropriate MS deviateand far from should be the result for the real targets. accurately located MSDU for timelywhat updating of the target models. In contrast, the Also, theresults targetsobtained trackedby byMS MSdeviate are likely to show missing as result the deviation increases a tracking far from whatas should be the for the real targets.and Also, detected thatbyhas tracked may beastracked again increases as a newand target, as shown in the targetstarget tracked MS already are likelybeen to show as missing the deviation a detected target Figure The reason for the may poorbe performance of as MS is that the target model and position not that has9h. already been tracked tracked again a new target, as shown in Figure 9h. Theare reason updated andperformance corrected asofthe and this wrongand convergence for the poor MStarget is thatand thebackground target modelchange and position arecauses not updated corrected in as MS. the target and background change and this causes wrong convergence in MS.
Figure 8.8. Comparison Comparisonofof results of target tracking by MSDU MS for Sequence A. Green results of target tracking by MSDU and MSand for Sequence A. Green rectangles rectangles used in respectively parts (a–d) respectively to represent the results MSDU in90th the are used inare parts (a–d) to represent the results obtained usingobtained MSDU inusing the 30th, 60th, 30th, 60th,frames; 90th red andrectangles 120th frames; rectangles used in (e–h) toresults represent the and 120th are usedred in parts (e–h) toare represent the parts corresponding obtained corresponding results obtained using MS. using MS.
14/20
Remote Remote Sens. Sens. 2016, 2016, 8, 8, 28 28 Remote Sens. 2016, 8, 28
15 of 21
Figure 9. Comparison of results of target tracking by MSDU and MS for Sequence B. Green Comparisonof of results of target tracking by MSDU MS for Sequence B. Green Figure 9.9.Comparison results of target tracking by MSDU and MSand for Sequence B. Green rectangles rectangles are used in parts (a–d) respectively to represent the results obtained using MSDU in the rectangles used in respectively parts (a–d) to respectively to represent the results MSDU the are used in are parts (a–d) represent the results obtained usingobtained MSDU inusing the 30th, 60th,in90th 30th, 60th, 90th and 120th frames; red rectangles are used in parts (e–h) to represent the 30th, 60th, 90th and 120th frames; red rectangles are used in parts (e–h) to represent the and 120th frames; red rectangles are used in parts (e–h) to represent the corresponding results obtained corresponding results obtained using MS. corresponding results obtained using MS. using MS.
Figure 10. Comparison of results of target tracking by MSDU and MS for Sequence C. Green rectangles Figure 10. Comparison of results of target tracking by MSDU and MS for Sequence C. Green Figure Comparison of resultstoof target tracking MSDU using and MS forinSequence C. Green are used10. in parts (a–d) respectively represent the resultsbyobtained MSDU the 30th, 60th, 90th rectangles are used in parts (a–d) respectively to represent the results obtained using MSDU in the rectangles are used in parts (a–d) respectively to represent the results obtained using MSDU in the and 120th frames; red rectangles are used in parts (e–h) to represent the corresponding results obtained 30th, 60th, 90th and 120th frames; red rectangles are used in parts (e–h) to represent the 30th, MS. 60th, 90th and 120th frames; red rectangles are used in parts (e–h) to represent the using corresponding results obtained using MS. corresponding results obtained using MS.
In order thethe effects due due to thetotarget size and image the ratio the of the Euclidean ordertotoavoid avoid effects the target size and resolution, image resolution, ratio of the In order to avoid the effects due to the target size and image resolution, the ratio of the distance between the trackingthe result and the realand target thetarget size oftothe diameter wasdiameter defined Euclidean distance between tracking result thetoreal thetarget size of the target Euclidean distance between the tracking result and the real target to the size of the target diameter as thedefined tracking [20]. On error this basis, tracking error oftracking all the targets inall each Dev, was aserror the tracking [20]. the On average this basis, the average error of theframe, targets in was defined as the tracking error [20]. On this basis, the average tracking error of all the targets in was as Dev, the index for quantitative of the evaluation tracking results. can be calculated using eachused frame, was used as the indexevaluation for quantitative of the Dev tracking results. Dev can be each frame, Dev, was used as the index for quantitative evaluation of the tracking results. Dev can be Equation calculated(16): using Equation (16): b calculated using Equation (16): n ÿ pxti ´ xi q22 ` pyti ´ y2i q2 1 xti − xi )2 + ( yti − yi )2 Dev “ 11 nn (( xt (16) + ( yti − yi ) (16) Dev = i − xi ) d i (16) Dev =n in“ 1i =1 d n i =1 d ii where n is the total number of targets in the frame, (xti , yti ) is the central point in the tracking result where n is the total number of targets in the frame, (xti, yti) is the central point in the tracking result i, yt i) is the central the tracking result where is the total(xnumber of targets in thepoint frame, for the ni th target, true central of(xt the i th target and dipoint is theindiameter of the i th i , yi ) is the for the i th target, (xi, yi) is the true central point of the i th target and di is the diameter of the i th for theThe i thvalues target,of (xDev i, yi) for is the central point of i th11target andaverage di is the diameter the i th target. eachtrue frame are shown in the Figure and the Dev for eachof complete target. The values of Dev for each frame are shown in Figure 11 and the average Dev for each target. The valuesinof Dev3.for each frame are shown in Figure 11 and the average Dev for each sequence is listed Table complete sequence is listed in Table 3. complete sequence is listed in Table 3.
15/20 15/20
Remote Sens. 2016, 8, 28 Remote Sens. 2016, 8, 28
16 of 21
Figure 11. 11. Graphs Graphs of of the the target target tracking tracking error. error. (a–c) (a–c) show, show, respectively, respectively, the comparative comparative statistics statistics for for Figure the tracking tracking error error produced by MSDU and MS for Sequences A, B and C. the Table 3. Quantitative evaluation of moving moving target tracking tracking by by MSDU MSDU and and MS. MS. The The values values shown shown are are Table the values of the average tracking error for each sequence. the values of the average
Method A A Sequence B B Sequence Method Sequence Sequence Sequence SequenceCC MSDU 0.1581 0.1061 0.5427 MSDU 0.1581 0.1061 0.5427 MS 0.2706 0.4165 1.0201 MS 0.2706 0.4165 1.0201 As shown in Figure 11 and Table 3, the tracking error for MSDU (0.2689 on average) is much As shown in Figure 11 and Table 3, the tracking error for MSDU (0.2689 on average) is much smaller than that for MS (0.5690 on average). In Figure 11, the error for MS shows an increasing smaller than that for MS (0.5690 on average). In Figure 11, the error for MS shows an increasing trend trend for each sequence—the sharp rises and falls occur when a target disappears from the imaging for each sequence—the sharp rises and falls occur when a target disappears from the imaging scene. scene. In contrast, if the target detection is good, especially when PD > 90%, MSDU can effectively In contrast, if the target detection is good, especially when PD > 90%, MSDU can effectively control the control the error accumulation and achieve stable target tracking by means of updating the tracking error accumulation and achieve stable target tracking by means of updating the tracking model, as is model, as is the case for Sequence A and Sequence B in these results. In addition, as shown in Table the case for Sequence A and Sequence B in these results. In addition, as shown in Table 3, the overall 3, the overall error for MS increases from 0.2706 to 0.4165, and then to 1.0201 as the imaging height error for MS increases from 0.2706 to 0.4165, and then to 1.0201 as the imaging height increases from increases from 400 m to 700 m, and then to 1000 m. This is because the image resolution decreases as 400 m to 700 m, and then to 1000 m. This is because the image resolution decreases as the height the height increases, leading to the low contrast but large overlap in grayscale characteristics increases, leading to the low contrast but large overlap in grayscale characteristics between the target between the target and background. However, with the help of effective target detection, MSDU and background. However, with the help of effective target detection, MSDU greatly reduces the greatly reduces the negative influence of imaging height on the target tracking and produces better negative influence of imaging height on the target tracking and produces better tracking results. tracking results. Based on the tracking experiment described above, other three popular tracking algorithms, Based on the tracking experiment described above, other three popular tracking algorithms, such as the Kalman filter tracking algorithm based on mean shift (KFMS), the particle filter tracking such as the Kalman filter tracking algorithm based on mean shift (KFMS), the particle filter tracking algorithm (PF) and the hash tracking algorithm (HT), were also used to track moving vehicles in the 16/20
Remote Sens. 2016, 8, 28
17 of 21
algorithm (PF) and the hash tracking algorithm (HT), were also used to track moving vehicles in the three experiment sequences. The tracking results produced by these three algorithms were compared with that produced by MSDU, and the average Dev for each algorithm used in each sequence is listed in Table 4. Table 4. Quantitative evaluation of moving target tracking by KFMS, PF, HT and MSDU. The values shown are the values of the average tracking error for each sequence. Method
Sequence A
Sequence B
Sequence C
MSDU KFMS PF HT
0.1581 0.2593 0.6018 0.1974
0.1061 0.2007 0.4760 0.5369
0.5427 0.5501 0.9463 1.4698
The evaluation result shows that MSDU achieves the best performance compared with the other algorithms. This further illustrates that MSDU is an effective improvement of MS, and it works well in tracking moving targets in aerial infrared image sequences. With regard to the processing speed of the algorithms, by taking the SFDLC and MSDU as a whole, 58 frames can be processed per second on average, and this meets the real-time application requirement of the experiment data acquired at a frequency of 50 frames per second in this paper. In addition, the algorithms can be further optimized and improved for more high-frequency image sequences. 5.3. Discussion The SFDLC algorithm proposed in this study is mainly used to detect “slow-moving” targets in the high-frequency aerial infrared image sequences. It can be seen from the target detection experiment results and analysis that, using accurate initial locations and clustering analysis, the SFDLC algorithm proposed in this paper has the following advantages: good detection capability, which produces complete and accurate detection results; effective immunity to noise, which avoids the detection of false targets; no detection delay phenomenon; and high robustness, meaning that it can be used for a range of different targets and different image sequences. However, the region of detection result by clustering becomes a little smaller than the region of real target when the contrast between target and background is not obvious in an image with low resolution. As shown in Figure 7c and Table 2, this may lead to target misdetection and unsatisfactory PD because the grayscale clustering result does not meet the minimum area restriction for the detectable targets. One possible solution to this problem is by introducing some other clustering techniques for separating the target from the background to take the place of the K-means algorithm used in SFDLC. However, no technique can guarantee detecting every pixel belonging to the target under different imaging conditions [5], and thus the most suitable technique may be determined after a lot of trials on more data and experiments in future work. Another possible solution is to enlarge the possible area range for the detectable targets which is set according to the real vehicle type common in the imaging region. By lowering the minimum area restriction, the target can be easily detected. However, the detection result is still smaller than the region of real target and it can be looked as a part of the real target. Therefore, this result is useful for the target location and the improvement of PD but cannot provide all information of the target. Within the limited area of the detectable targets used in the experiments, SFD and AFD also produced different degrees of misdetection, and the rate of misdetection using SFDLC is really quite low compared with which occurs when either SFD or AFD is used. As shown in Figure 5d, misdetection happens using SFD because the detection “hole” leads to the area detected of a slow-moving target smaller than the minimum area restriction. This happens in every case with SFD except for the case shown in Figure 7f. As shown in Figures 5i and 6h, when the detection results contain too much false information, misdetection happens using AFD because the area detected by the accumulation of multiple consecutive frames exceeds the limit for the maximum area restriction. Although the rate of
Remote Sens. 2016, 8, 28
18 of 21
misdetection can be reduced by increasing the maximum area restriction and the PD for AFD may accordingly increase, the accurate location and other information of target cannot be obtained without extra processing [14]. After analyzing these experimental results, it was found that the misdetection is closely related to features of the target such as speed, gray level and size. For this reason, it is not advisable to try to avoid misdetection by randomly enlarging the range of the area of the detectable targets—this lacks a factual basis and will reduce the SNR of the detection. While the PD for SFDLC decreases slightly as the image resolution decreases and the imaging height increases, the PD for SFD increases as the imaging height increases. This is because the changes of some smaller targets are obvious in image sequence with lower resolution and these targets can be detected by SFD [27,28], and also by SFDLC. However, the bigger targets whose changes are relatively little or slow when moving at speeds similar to those of smaller targets can never be detected without “hole” by using SFD. For this reason, the PD for SFD can never increase to the same high level as that for SFDLC once the “slow-moving” target exists in image. In addition, the FAR for SFDLC in Sequence B is 36.31%, which is higher than that for SFD equaling 22.23%. The reason for this higher FAR is that the detection noise caused by pixel-level differences between the successive images may be enlarged by clustering in SFDLC when the imaging background is complicated, as in Sequence B with various buildings, vegetation and parked vehicles. This problem can be solved by setting general statistical value ranges of attributive characters for targets to be detected. However, once the characteristic values are set, the reliability of the detection results by SFD and AFD becomes low. Therefore, these values were not set in the experiment of this paper for the purpose of comparison among the three different detection algorithms with as little a priori knowledge as possible, but rather, in practical application, these values can be set for a better FAR. Although SFDLC is proposed as a method for “slow-moving” target detection, in most cases, it can also perform well in detecting a target whose change is not so slow. Furthermore, SFDLC proving effective for vehicle targets can thus also be employed for other rigid targets such as ships. In addition, the MSDU algorithm proposed in this study serves mainly for providing an idea to improve the traditional MS algorithm and realize stable target tracking in high-frequency aerial infrared image sequence. It can be seen from the target tracking experiment results and analysis that the MSDU begins to find and update the tracking model once the target tracking result becomes unreliable so that the target tracking error is significantly reduced. MSDU, therefore, is shown to be a tracking algorithm with good stability and reliability and an improvement on the MS algorithm. However, by using the real-time target detection results to update the tracking model, MSDU may loosen controls of the target tracking errors when the detection results are not good enough for timely updates, as shown in Figure 11c. The way to solve this problem is by enhancing the effectiveness of the detection results used in the tracking process, and this mostly relates to the improvement of the target detection algorithm, which has been described above in the discussion about SFDLC. Despite this problem, for the infrared target containing little feature information, MSDU is an effective improvement on MS to substitute the commonly used idea of incorporating multi-feature information into MS for improvement [39–41]. 6. Conclusions Infrared images represent the temperature distribution of objects with little influence from the imaging environment. However, the characteristics of objects in infrared images are not obvious and lack diversity, especially when the images are acquired from a moving airborne platform. These problems, inherent in infrared target detection and tracking technology, need to be overcome. By making use of the characteristics of image gray levels, a study of target detection and tracking in aerial image sequences was carried out. Multiple moving vehicles of different sizes and with different characteristics, in images with different resolutions, were used as detection and tracking targets. Based on clustering analysis and frame differencing, in this paper a SFDLC moving target detection algorithm was proposed for infrared aerial sequences after registration. The experiments carried out
Remote Sens. 2016, 8, 28
19 of 21
in this study showed that SFDLC can accurately detect infrared targets in aerial sequence in real time. The detection results showed that this algorithm produces a high probability of detection (90.48%) but a low false alarm rate (27.96%) because it effectively avoids the influence of noise. In addition, based on kernel-based tracking theory, the target detection was combined with a tracking algorithm and, based on the interaction between detection and tracking, a MSDU target tracking algorithm was proposed with information from the tracking model continuously provided by the detection results. The experiments also showed that the MSDU algorithm is superior to the traditional method in terms of effectiveness and robustness by virtue of the timely correction of the tracking results and updating of the tracking model. Specifically, as shown in the tracking results, the tracking error was reduced from 0.5690 for MS to 0.2689 for MSDU and the negative influence of imaging height on the target tracking using MSDU was remarkably weakened compared with that using MS. Author Contributions: Yutian Cao, Gang Wang and Dongmei Yan contributed to the idea and the data collection of this study. Yutian Cao developed the algorithm, performed the experiments, analyzed the experimental results and wrote this paper. Dongmei Yan and Zhongming Zhao supervised the study and reviewed this paper. Conflicts of Interest: The authors declare no conflict of interest.
References 1. 2. 3. 4.
5. 6. 7. 8.
9. 10. 11. 12.
13. 14. 15.
Skoglar, P.; Orguner, U.; Törnqvist, D.; Gustafsson, F. Road Target Search and Tracking with Gimballed Vision Sensor on an Unmanned Aerial Vehicle. Remote Sens. 2012, 4, 2076–2111. [CrossRef] Leitloff, J.; Rosenbaum, D.; Kurz, F.; Meynberg, O.; Reinartz, P. An Operational System for Estimating Road Traffic Information from Aerial Images. Remote Sens. 2014, 6, 11315–11341. [CrossRef] Sobral, A.; Vacavant, A. A comprehensive review of background subtraction algorithms evaluated with synthetic and real videos. Comput. Vis. Image Underst. 2014, 122, 4–21. [CrossRef] Bouttefroy, P.L.M.; Bouzerdoum, A.; Phung, S.L.; Beghdadi, A. On the analysis of background subtraction techniques using Gaussian Mixture Models. In Proceedings of the IEEE International Conference on Acoustics, Speech, and Signal Processing, Dallas, TX, USA, 14–19 March 2010; pp. 4042–4045. Acito, N.; Corsini, G.; Diani, M.; Pennucci, G. Comparative analysis of clutter removal techniques over experimental IR images. Opt. Eng. 2005, 44, 6401. [CrossRef] Suganyadevi, K.; Malmurugan, N. OFGM-SMED: An efficient and robust foreground object detection in compressed video sequences. Eng. Appl. Artif. Intell. 2014, 28, 210–217. [CrossRef] Xin, Y.H.; Hou, J.; Dong, L.M.; Ding, L.P. A self-adaptive optical flow method for the moving object detection in the video sequences. Optik 2014, 125, 5690–5694. [CrossRef] Yalcin, H.; Collins, R.; Black, M.J.; Hebert, M. A flow-based approach to vehicle detection and background mosaicking in airborne video. In Proceedings of the IEEE Computer Society Conference on Computer Vision and Pattern Recognition, San Diego, CA, USA, 20–26 June 2005; Volume 2. Khare, M.; Srivastava, R.K.; Khare, A. Single change detection-based moving object segmentation by using Daubechies complex wavelet transform. IET Image Process. 2014, 8, 334–344. [CrossRef] Tsai, C.M.; Yeh, Z.M. Intelligent moving objects detection via adaptive frame differencing method. Intell. Inf. Database Syst. 2013, 7802, 1–11. He, M.G.; Li, L.J.; Jia, Z.T. A rapid video segmentation algorithm based on symmetrical DFD. Mini Micro Syst. 2003, 24, 966–968. Akula, A.; Khanna, N.; Ghosh, R.; Kumar, S.; Das, A.; Sardana, H.K. Adaptive contour-based statistical background subtraction method for moving target detection in infrared video sequences. Infrared Phys. Technol. 2014, 63, 103–109. [CrossRef] Xu, J.; Zhang, H.; Zhang, X.J. IR motive detection using image subtraction and optical flow. Comput. Simul. 2012, 29, 248–252. Bhattacharya, S.; Idrees, H.; Saleemi, I.; Ali, S.; Shah, M. Moving Object Detection and Tracking in Forward Looking Infra-Red Aerial Imagery. Mach. Vis. Visible Spectr. Augment. Vis. Real. 2011, 1, 221–252. Yu, W.S.; Tian, X.H.; Hou, Z.Q.; Huang, A.Q.; Liu, X. Region edge histogram: A new feature for region-based tracking. In Proceedings of the IEEE International Conference on Signal Processing, Hangzhou, China, 19–23 October 2014; pp. 1180–1185.
Remote Sens. 2016, 8, 28
16.
17. 18. 19.
20. 21.
22. 23. 24. 25. 26. 27. 28. 29. 30.
31.
32. 33. 34. 35. 36. 37. 38. 39.
20 of 21
Stolkin, R.; Rees, D.; Talha, M.; Florescu, I. Bayesian fusion of thermal and visible spectra camera data for region based tracking with rapid background adaptation. In Proceedings of the IEEE International Conference on Multisensor Fusion and Integration for Intelligent Systems, Hamburg, Germany, 13–15 September 2012; pp. 192–199. Sabouri, S.; Behrad, A.; Ghassemian, H. Deformable contour-based maneuvering flying vehicle tracking in color video sequences. ISRN Mach. Vis. 2013, 2013, 1–14. [CrossRef] Hu, W.M.; Zhou, X.; Li, W.; Luo, W.H.; Zhang, X.Q.; Maybank, S. Active contour-based visual tracking by integrating colors, shapes, and motions. IEEE Trans. Image Process. 2013, 22, 1778–1792. [PubMed] Lee, K.H.; Hwang, J.N.; Yu, J.Y.; Lee, K.Z. Vehicle tracking iterative by Kalman-based constrained multiple-kernel and 3-D model-based localization. In Proceedings of IEEE International Symposium on Circuits and Systems, Beijing, China, 19–23 May 2013; pp. 2396–2399. Karavasilis, V.; Nikou, C.; Likas, A. Visual tracking using the Earth Mover’s Distance between Gaussian mixtures and Kalman filtering. Image Vis. Comput. 2011, 29, 195–305. [CrossRef] Gong, J.L.; Fan, G.L.; Yu, L.J.; Havlicek, J.P.; Chen, D.R.; Fan, N.J. Joint target tracking, recognition and segmentation for infrared imagery using a shape manifold-based level set. Sensors 2014, 14, 10124–10145. [CrossRef] [PubMed] Pernici, F.; Bimbo, A.D. Object tracking by oversampling local features. IEEE Trans. Pattern Anal. Mach. Intell. 2014, 36, 2538–2551. [CrossRef] [PubMed] Ling, J.G.; Liu, E.Q.; Liang, H.Y.; Yang, J. Infrared target tracking with kernel-based performance metric and eigenvalue-based similarity measure. Appl. Opt. 2007, 46, 3239–3252. [CrossRef] [PubMed] Salah, M.B.; Mitiche, A. Model-free, occlusion accommodating active contour tracking. ISRN Artif. Intell. 2012, 2012, 1–15. [CrossRef] Tang, Z.Y.; Zhao, J.J.; Yang, J.; Liu, E.Q.; Zhou, Y. Infrared target tracking algorithm based on sparse representation model. Infrared Laser Eng. 2012, 41, 1389–1395. Yilmaz, A.; Shafique, K.; Shah, M. Target tracking in airborne forward looking infrared imagery. Image Vis. Comput. 2003, 21, 623–635. [CrossRef] Qiu, G.N.; Quan, H.M. Moving object detection algorithm based on symmetrical-differencing and background subtraction. Comput. Eng. Appl. 2014, 50, 158–162. Cao, J.; Tan, Y.H.; Ma, J.; Tian, J.W. Detecting moving objects from infrared image sequence on displacing background. J. Electron. Inf. Technol. 2005, 27, 43–46. Faber, V. Clustering and the continuous k-means algorithm. Los Alamos Sci. 1994, 22, 138–144. Kalal, Z.; Matas, J.; Mikolajczyk, K. Online learning of robust object detectors during unstable tracking. In Proceedings of the 3rd On-line Learning for Computer Vision Workshop, Kyoto, Japan, 27 September–3 October 2009; pp. 1417–1424. Kalal, Z.; Mikolajczyk, K.; Matas, J. Face-TLD: Tracking-Learning-Detection Applied to Faces. In Proceedings of the International Conference on Image Processing, Hong Kong, China, 26–29 September 2010; pp. 3789–3792. Kalal, Z.; Mikolajczyk, K.; Matas, J. Tracking-Learning-Detection. IEEE Trans. Pattern Anal. Mach. Intell. 2012, 34, 1409–1422. [CrossRef] [PubMed] Comaniciu, D.; Ramesh, V.; Meer, P. Kernel-based object tracking. IEEE Trans. Pattern Anal. Mach. Intell. 2003, 25, 564–577. [CrossRef] Hou, Q.Y.; Zhang, W.; Wu, C.F.; Lu, L.H. Improved mean-shift based IR target tracking algorithm. Opt. Precis. Eng. 2010, 18, 764–770. Lowe, D.G. Distinctive image features from scale-in-variant key-points. Int. J. Comput. Vis. 2004, 60, 91–110. [CrossRef] Jain, R.; Nagel, H.H. On the analysis of accumulative difference of picture from image sequence of real world scenes. IEEE Trans. Pattern Anal. Mach. Intell. 1979, 1, 206–214. [CrossRef] [PubMed] Zuo, F.Y.; Gao, S.F.; Han, J.Y. Moving object detection and tracking based on weighted accumulative difference. Comput. Eng. 2009, 35, 159–161. Qu, J.J.; Xin, Y.H. Combined continuous frame difference with background difference method for moving object detection. Acta Photonica Sin. 2014, 43, 0710002. Leichter, I.; Lindenbaum, M.; Rivlin, E. Tracking by affine kernel transformations using color and boundary cues. IEEE Trans. Pattern Anal. Mach. Intell. 2009, 31, 164–171. [CrossRef] [PubMed]
Remote Sens. 2016, 8, 28
40. 41.
21 of 21
Leichter, I.; Lindenbaum, M.; Rivlin, E. Mean Shift tracking with multiple reference color histograms. Comput. Vis. Image Underst. 2010, 114, 400–408. [CrossRef] Bousetouane, F.; Dib, L.; Snoussi, H. Improved mean shift integrating texture and color features for robust real time object tracking. Vis. Comput. 2013, 29, 155–170. [CrossRef] © 2015 by the authors; licensee MDPI, Basel, Switzerland. This article is an open access article distributed under the terms and conditions of the Creative Commons by Attribution (CC-BY) license (http://creativecommons.org/licenses/by/4.0/).