Friday, January 27, 2017
Manuscript
UmUTracker: A versatile MATLAB program for automated particle tracking of 2D light microscopy or 3D digital holography data Hanqing Zhang†, Tim Stangner†, Krister Wiklund†, Alvaro Rodriguez†, Magnus Andersson†,* †
Department of Physics, Umeå University, 901 87 Umeå, Sweden
*
Corresponding author: Magnus Andersson,
[email protected]
Keywords: image processing, digital holographic microscopy, particle tracking velocimetry, microfluidics.
ABSTRACT We present a versatile and fast MATLAB program (UmUTracker) that automatically detects and tracks particles by analyzing long video sequences acquired by either light microscopy or digital holography microscopy. Our program finds the 2D particle center position using an isosceles triangle transform and the axial position by a fast implementation of Rayleigh-Sommerfeld numerical reconstruction algorithm using a one dimensional radial intensity profile. To validate the accuracy of our program we test each module individually in controlled experiments. First, we determine the lateral position of polystyrene particles recorded under bright field microscopy and digital holography conditions. Second, we reconstruct the axial position of the same particles by analyzing synthetic and experimentally acquired holograms. Thereafter, as a proof of concept, we profile the fluid flow in a 100 µm high flow chamber. This result agrees with computational fluid dynamic simulations. On a regular desktop computer UmUTracker can detect, analyze, and track a single particle at 5 frames per second for a template size of 201 × 201 in a 1024 × 1024 image. To enhance usability and to make it easy to implement new functions we used object-oriented programming. UmUTracker is suitable for studies related to: particle dynamics, cell localization, colloids and microfluidic flow measurement.
PROGRAM SUMMARY Program title: UmUTracker Catalogue identifier: 4.6, 4.12, 14, 16.4, 16.10, Program obtainable from: https://sourceforge.net/projects/umutracker/ Licensing provisions: Creative Commons by 4.0 (CC by 4.0) Distribution format: zip Programming language: MATLAB Computer: All computers running the (MathWorks Inc.) version 8.4 (2014b) or higher, with computer vision toolbox should work. Operating system: Tested on Windows 7 and 10. All operating systems running MATLAB with computer vision toolbox should fulfill necessary requirements. Classification: 06.30.Gv, 47.80.Jk, 42.30.Wb, 87.64.-t, 07.05.Pj Nature of problem: Multi-particle tracking is a common technique in physics, chemistry and biology. However, there are many challenges for the programs and algorithms developed to process and analysis the data. First, particle overlap, motion blur, and noise often influence the tracking accuracy. Second, to find the 3D position of a particle, the reconstruction process based on digital holography microscopy is a computational heavy process. Third, presenting the processed and analyzed data from large data sets in a comprehending way is difficult.
1
Friday, January 27, 2017
Manuscript
Solution method: UmUTracker is a multi-functional tool to extract particle positions in 3D from long video sequences acquired with either brightfield or digital holography microscopy. The program provides an easy-to-use graphical user interface (GUI) that does not require programming skills to analyze data from particle tracking experiments. To realize accurate 2D position detection under noisy conditions, we implement novel isosceles triangle sampling technique with a multi-scale strategy for automatic particle center localization. To reduce the computational load, UmUTracker uses an efficient implementation the Rayleigh-Sommerfeld back propagation model. To analyze and visualize the data, an efficient data analysis step, which can for example show 4D flow visualization using 3D trajectories, is included. Due to the object-oriented programing style, UmUTracker is easy to modify with usercustomized modules.
1. INTRODUCTION Automatic particle tracking for quantitative interpretation of microscopy images is a basic and important requirement for reliable data analysis. However, automatic multiple particle detection is problematic under noisy conditions. To overcome such difficulties, recent research focus on improving the accuracy and robustness of algorithms used to acquire reliable data in different microscopy applications [1], such as digital holographic microscopy (DHM). DHM is an imaging technique that allows three-dimensional (3D) particle tracking of objects [2–4]. Objects such as cells, bacteria and particles that are semitransparent or opaque can be tracked using amplitude and phase information recorded in holograms. Since a hologram contains 3D information in a 2D image the object under study does not have to be in focus, in contrast to regular microcopy imaging. In addition, DHM is a powerful technique for biophysical and colloidal research studies since multiple objects can be investigated simultaneously. With these advantages, particle image velocimetry for flow profiling of microfluidics can be applied using the DHM technique [5,6]. DHM is also used for measuring the shape and trajectories of E. coli [7], red blood cells [8], and tracking of many different types of cells [9–11]. For DHM based tracking in long video sequences, computational efficiency and reliable tracking are the two major issues. To track particles in four dimensions (4D, space and time) with high accuracy, DHM uses planar position detection and numerical reconstruction of the axial positions from holograms, where the latter is a computational heavy process. Several studies have improved the reconstruction efficiency by applying hardware acceleration using graphical processing units (GPU) [5,12] or field programmable gate arrays (FPGA) [13]. However, these approaches lack reliable tracking algorithms. Most tracking methods using GPU or FPGA are based on correlation or convolution in a pre-defined region-of-interest (ROI). Within this ROI, particles need to be identified manually, which can be timeconsuming if the particle density is high. Additionally, if objects enter the ROI, again, they need to be manually identified, which is problematic especially for long video sequences. Therefore, automatic multi-particle identification and efficient reconstruction algorithms are required, but can be challenging in the presence of particle overlap, motion blur, and noise [14]. In this article, we present an automatic program (UmUTracker) implemented in MATLAB for particle detection and tracking in 4D. We contribute a robust detection algorithm to find circular diffraction patterns based on an isosceles triangle transform and a variation of Rayleigh-Sommerfeld back propagation for calculating the axial position more efficiently. Object-oriented programming is applied to ensure extensibility to other image tracking modules and user-friendly implementations. The program provides 3D trajectories of particles as well as particle velocity profiling based on data assessed using an in-line version of digital holographic microscopy. We verify the precision of our algorithm by determining the spatial coordinates of micro-particles using synthetic images from ray-tracing simulations as well as from experimental data. The results show that our algorithm can handle background noise and particles with their positions near each other without losing precision in tracking. This allows a more efficient estimation of local flow profile using a high particle density in the field of view. As a proof of concept, we characterize the particle flow in a microfluidic chamber for 1 µm polystyrene particles and compare our results to computational fluid dynamic (CFD) simulations. The numerical reconstruction efficiency is improved to handle 201×201 pixel images of particles and the speed for tracking and localization can reach 5 fps in the MATLAB version on a regular PC.
2
Friday, January 27, 2017
Manuscript
2. EXPERIMENTAL PROCEDURE 2.1. Sample Preparation To carry out DHM experiments, we use polystyrene (PS) mono size particles (nominal diameter ± standard deviation (SD): 1.040 ± 0.022 µm, Lot No. 15879, Duke Scientific Corp., 4% w/v) dissolved in phosphate buffered saline (PBS, pH 7.4). To avoid overlapping diffraction patterns, we optimize the bead concentration by diluting the bead stock solution by 1:400. For static position detection and validation experiments we immobilize polystyrene particles to a coverslip, being the bottom part of a simple sandwich cell. This measurement cell consists of two cover slips (lower cover slip: no. 1, Knittel Glass, 60x24 mm; upper cover slip: no. 1, Knittel Glass, 20x20 mm) separated by double sticky tape (Scotch, product no. 34-8509-3289-7, 3M). The cell volume is approximately 10 µL. We inject the diluted bead solution with a micropipette and seal the chamber by adding vacuum grease (Dow Corning) on both openings to prevent evaporation, which can result in a biased movement of the particles. We incubate the sandwich cell overnight so particles settle down and immobilize to the bottom coverslip. For experiments with flow and a preset shear stress we use commercial microfluidic chamber biochips (Vena8, Celix) using the same bead solution as presented above. A Vena8 bio-chip has a rectangular flow channel with dimensions of 28 mm x 400 µm x 100 µm (length, width, height). To produce constant and reproducible flow rates, we use a microfluidic syringe pump (Lambda Vit-Fit, LAMBDA Laboratory Instruments, Switzerland), operating in pulling mode.
2.2. Digital In-Line Holography Setup The in-line version of our DHM setup is built around an Olympus IX70 inverted microscope, normally used for optical tweezers experiments, equipped with an oil-immersion objective (Olympus PlanApo 60x/1.40 Oil, ∞/0.17), see Figure 1 [15]. To ensure optimal tracking conditions for our algorithm, we illuminate the sample using a quasi-monochromatic light emitting diode (LED, M470F1, Thorlabs) operating at 470 nm. The light source is connected via an optical fiber (M28L02, Thorlabs) to an output collimator (PAF-SMA-7-A, Thorlabs) enabling us to illuminate the sample from above with parallel light. The prepared sample cell is mounted onto a piezo stage, which can be positioned in three dimensions over a range of 100 µm with nanometer accuracy using piezo actuators (P-561.3CD, Physik Instrumente). Particles are imaged using a high-speed camera (MotionBLITZ EoSens Cube 7, Mikrotron) operating at 200 fps with a shutter time of 5 ms and pixel size of 8x8 µm. Images are acquired by MotionBLITZDirector2 software with an image size of 1696 x 1710 pixels. The resolution of the microscopy system is 132 ± 2 nm/pixel (mean ± SD). The whole setup is built in a temperature controlled room at 296 ± 1 K to ensure long-term stability and to reduce thermal drift effects.
2.3. Bright Field Microscopy In addition to holograms from DHM, we also analyze images of a single supercoiled DNA tethered particle under bright field microscopy conditions. The data were acquired in the studies presented in [16,17]. In the experiment, the supercoiled DNA (pSB4312) was immobilized at one end to a coverslip using PNAs while the other end was attached to a 0.5 µm Streptavidin-coated particle (cat. no. CP01N, Bangs Laboratory). The motion of a particle was recorded at 225 Hz in an inverted microscope (Model No. DM IRB, Leica) with a high-speed camera (Pike F100B, Allied Vision Technology, conversion factor of 45.97 nm/ pixel), and the length of the time series was optimized to 30 seconds according to an Allan variance analysis of the setup [18].
3
Friday, January 27, 2017
Manuscript
2.4. Computational Fluid Dynamic Simulation To verify the experimentally recorded flow profiles, we compare our experimental data with computational fluid dynamic (CFD) simulations using the commercial software Comsol Multiphysics 5.2. In these simulations, we mimic a 3D flow in a channel with geometry similar to the experiments, that is, a width of 400 µm and a height of 100 µm. The channel length is chosen in a way that the fully developed velocity profile is not affected by inlet and outlet conditions and the no-slip velocity condition is used on all walls parallel to the flow.
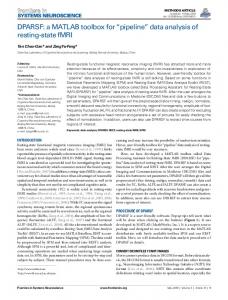
Figure 1. (left) Illustration of the DHM setup. A quasi-monochromatic LED light source is used for illumination via optical fiber and output collimator. A measurement chamber is mounted on a piezo stage that moves in three dimensions (xyz). Holograms are acquired using a high speed camera (x′y′z′). (middle) Schematic representation of particle flow in the flow chamber with polystyrene particles at different heights under constant shear stress. (right) By applying our digital holographic tracking algorithm using the planar hologram image, we can recalculate the spatial coordinates of particles with accuracy at a magnitude of the wavelength used for sample illumination.
4
Friday, January 27, 2017
Manuscript
3. THE ALGORITHM AND PROGRAM DESCRIPTION 3.1. Particle Detection using an Isosceles Triangles Transform Detecting microscopic diffraction patterns can be challenging for images taken with short shutter times producing motion blur and when the object is out of focus. To achieve accurate localization using bright field microscopy or DHM e.g. for flow visualization, a pattern recognition algorithm is often applied. As one of the most crucial steps in realizing the video-based tracking, pattern recognition algorithms depend strongly on the optical properties of particles, as well as on the illumination and imaging system used in the experiment. Based on our previous research, we propose a variation of the ITCiD circle detection algorithm where the geometrical constraints of isosceles triangles (ITs) is used for finding the circle center [19], denoted as ITs transform. Compared to the conventional Hough transform for circle detection, the ITs transform is more efficient in suppressing the false-positives from noise and finding object centers accurately. Here, we modify ITs transform [19] by introducing a coarse-to-fine solution to improve both performance and edge detection of blurry textures in the image. The original image can be filtered with a Gaussian kernel to generate a Gaussian pyramid in the scale-space [20]. We apply down-sampling to the original image (Error! Reference source not found.. A). At each level of scale, to identify the diffraction pattern, an edge map of the image is created using standard Canny edge detection. We group connected edge points as line segments and for each segment we apply the ITs transform to cast votes at pixels in matrix with the same size as the image. By fusing the matrix from all the scales, the algorithm generates the final distribution of votes (Error! Reference source not found.. B). The distribution of votes is used to find the maximum value, corresponding to the xy-center coordinates of the diffraction pattern (Error! Reference source not found.. C).
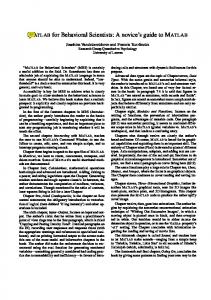
Figure 2. Demonstration of diffraction center detection using the ITs transform. A) Pyramid representation of multi-scale images containing the original image as level “0” and down sampled images at level “1” and “2”. B) In feature space, votes are collected from each scale level and the intensity is scaled by the number of votes. C) Intensity collected in x and y direction. The center of the diffraction pattern can be found at the point with maximum intensity value.
3.2. Numerical Reconstruction using Rayleigh-Sommerfeld Back Propagation When a spherical object is illuminated by a plane light wave, a small proportion of the incident beam is scattered. This scattered light will in turn interfere with non-scattered light and produce an interference pattern. This pattern can be predicted using the Rayleigh-Somerfield diffraction formula for light propagation [21]. The reconstruction of the diffracted field of the particle can be obtained by multiplying a transfer function of free space propagation to the diffraction pattern in the image plane in the frequency domain. The reconstruction can be implemented using the angular spectrum method by [22], 5
Friday, January 27, 2017
Manuscript
𝑈𝑅 (𝑟⃗) = 𝐹𝑇 −1 {𝐹𝑇(𝑈𝑂 (𝑟⃗⃗⃗⃗)) ⋅ exp [ 0
−2𝜋𝑗𝑧 √1 − 𝜆
𝑃 2
𝑄 2
(𝜆 S ) − (𝜆 S ) ]},
(1)
where 𝑈𝑂 (𝑟⃗⃗⃗⃗) 0 represents the complex optical field scattered in the image plane (x′,y′,0) (Figure 1, right) and 𝑈𝑅 (𝑟⃗) represents the wave front of the scattered light at any point in space (x,y,z), FT and FT-1 are the Fourier transform and the inverse of Fourier transform, 𝑗 is the imaginary unit, 𝜆 indicates the wavelength of the light used for illumination, S × S is the real size of the hologram , and P and Q are pixel indexes in x and y dimension respectively ranging from −N⁄2 to N⁄2 , where N is the number of pixels. Since the 3D reconstruction using Equation (1) is time consuming, we propose a fast and robust implementation of angular spectrum method, which is based on the symmetrical nature of spherical particles. Therefore, reconstruction of particle intensity at any height z along the center of the particle can be efficiently calculated using a 1D intensity radial profile. To extract the radial profile of particles recorded in the image plane, the pre-knowledge of the particle center position from the detection process (as shown in section 3.1) can be used. We resample the intensity values in the image using polar coordinates with their origin at the particle center. In the resampling process, sampling points are spaced by Δr and Δq, representing the minimum steps in radial and angular dimensions. At each sampling point, the intensity value is calculated using linear interpolation of two values at neighboring grid points in dimension x and y, respectively. After resampling, intensities over all the angles at each radial step are averaged and the intensity profile 𝐼𝑂 (𝑟 ′ , 0) of a particle from its center to a certain radius is created. In this process, noise and interference from nearby particles can also be reduced due to averaging of diffraction pattern in the radial dimension. At last, a symmetrical radial intensity profile is created by connecting the intensity profile with its mirror. Subsequently, by using these 1D radial intensity profiles, we numerically reconstruct the axial intensity. Based on Equation (1), the formula for the optical field of the scattered light at any point in 2D space (r, z), 𝐼𝑅 (𝑟, 𝑧) is derived as, 𝐼𝑅 (𝑟, 𝑧) = 𝐹𝑇 −1 {𝐹𝑇(𝐼𝑂 (𝑟 ′ , 0)) ⋅ exp [
−2𝜋𝑗𝑧 √1 − 𝜆
𝑅 2
(𝜆 S ) ]},
(2)
where R is a pixel index ranging from −M⁄2 to M⁄2 and M is the total number of sampled steps. By applying the dimension reduction above, the computational cost for intensity reconstruction of spherical particles can be reduced significantly.
3.3. Design of the Framework The workflow of UmUTracker is presented in Figure 3. All algorithms are implemented in MATLAB using an object-oriented framework. We categorize the abstracted module as "Process" (blue) and "Mathematics & Method" (grey). The solid lines with arrows indicate the direction of workflow in the process. The dashed lines with arrows show the realization, meaning that the origin of the dependency can be extended or replaced to allow more functionality in the program.
6
Friday, January 27, 2017
Manuscript
Figure 3. A) Block diagram of the workflow (blue column) and the class modules (grey column) for UmUTracker. B) User interface of UmUTracker containing 5 major functionalities: 1. Preprocessing, 2. Particle Localization, 3. Tracking, 4. Refinement, 5. Numerical Reconstruction.
The design of the user interface follows the workflow shown in Figure 3. A. Using the program interface (Figure 3. B), users can load frames from video streams (e.g. avi, mpeg, mov) for image analysis and tune image processing parameters to achieve optimal results. In the following, we describe available functions in the user interface and provide parameter values for data analysis (see supplementary materials section Main Interface for details).
7
Friday, January 27, 2017
Manuscript
Pre-processing: This step allows the user to perform "Background Subtraction" to reduce dust stains or inhomogeneity in sample illumination. A background image is generated using either a moving average filter applied to fixed number of frames or a static background image by averaging the intensity of fixed number of frames in a video. By default, the number of frames used for the background image is set to 10. In this case, each pixel in the 11th frame is divided by the corresponding pixel in background image and the intensity of resulting image is rescaled from zero to one. The rescaled image is then further processed and the background image is updated by replacing the 1st frame with the latest frame and averaging over all 10 past frames at each pixel. Without background subtraction, the intensity range can also be set to [0,1] by activating "Normalized Intensity". Besides using "Background Subtraction", the input frame can be resized and a Gaussian filter can be used to remove noises in the image. The user also set the ROI for all video frames as an image cropped from the original frame by removing pixels close to the edge. Alternatively, the ROI can be selected manually. Particle localization: The user can select two particle localization strategies: manual selection or auto-detection. In the case of automatic detection, a ITs transform is implemented. To achieve proper detection results the user must tune several key parameters. One of the most critical parameter is the threshold value for edge detection. Since Canny edge detection [23] is applied as a pre-requisite for ITs transform, we apply the Otsu thresholding method [24] to get a default threshold value. The resulting value is applied directly to Canny detection as higher bound of threshold, and a lower bound is set to one-third of this value. In practice, users can set the higher bound manually by changing the "Canny Edge Multiple" value. This value indicates the number multiplied by the Otsu thresholding value and can be set intuitively by clicking "Check Edge Detection" to adapt the edge detector to optimal conditions. As a multi-scale solution for ITs transform, the "Number of scales" is set to 3 that creates the original image and two down sampled images with a factor of ½ and ¼ in both length and width. The "ITs transform threshold" represents the geometrical criterion for ITs transform and is set to 0.05. In practice this value can be varied in a range from 0.01 to 0.5. A smaller value defines circles with more accurate geometrical shape, resulting in a fewer number of valid candidates and less detected falsepositive. Results with less false-positive can also be achieved by changing "Minimum Votes" to a higher number. This number is set to 30 by default indicating the diffraction pattern center is recognized only when the voting number at a pixel is above this value. On the other hand, to increase the number of valid candidates, the number of iterations for randomized sampling is set to 5× the number of edge pixels. As a trade-off between candidate number and speed, we set "Segment length" as the minimum length of the edge segment to 10 so that short segments and discontinued edge points are considered as noise and can be removed from the detection for efficiency. Besides, the "Mapping Kernel Size" represents the radius of vote area in the feature space. When this value is set to 2, a 5×5 Gaussian kernel is superposed in the distribution of votes (see Error! Reference source not found.. B) around the calculated center position by ITs transform. In addition to automatic particle detection using ITs transform, the program offers an option to manually select the center position of each particle. The center position from the manual selection is refined using a variation of the cross-correlation method [25], which samples in a radial pattern. Since the manual selection does not have detection results except for the 1st frame, the algorithm applies a local detection based on ITs transform for every selected object in the tracking process. Tracking: For identified particles the program saves; particle position, motion model, and a template image. Based on the results from the localization process mentioned above, new particle positions from detection can be assigned to previously identified particles. To ensure correct tracking we use the Hungarian method with a Kalman filter, which provides the optimum distance assignment [26] [27]. The Hungarian parameter "Cost of NonAssignment" is set to 100, meaning detection will not be assigned to identify particles if the distance between detection and predicted position is larger than 100 pixels. In the case when no detection results are available at all, a local detection using ITs transform is applied to image templates to find the diffraction center. As for the size of image template, the user can put the "Fixed template radius" to 200 indicating 401×401 templates. To ensure correct template data in the axial reconstruction process, the user activates "Tracking Boundary" so that each template must have acquired all intensity values available in each frame.
8
Friday, January 27, 2017
Manuscript
Refinement: The centers and templates derived from the tracking can be improved for higher accuracy and efficiency. The Re-sampling creates the 1D profile in the radial dimension for axial numerical reconstruction as described in section 3.2. The program offers two sampling strategies. The option "Circular" samples all the radial directions. On the other hand, the "Sector" only samples pixel values in the direction of moving object to minimize the effect of motion blur. Besides, the user can also add "Xcorr" modules [25] to the process. This additional process refines the trajectory of each particle using the intensity profile and a fixed sized template of the object to find the geometrical center position with sub-pixel accuracy with a cost of performance. Numerical reconstruction: In this program module intensity reconstruction in the axial direction using DHM theory is performed. The option "1D" can be selected, choosing the DHM reconstruction presented in section 3.2 that uses a radial intensity profile. The size of the intensity profile is predetermined in the refinement process and the "Template Margins" for reconstruction is set 2× the size of intensity profile to avoid artifacts during the reconstruction process. If a badly derived reconstruction is made using a template with errors at the particles center position, the user can apply a mask around the particle center within a range defined by the "Paraxial mask radius" to collect averaged reconstructed intensities. Reconstructed intensities are sampled at each "Step Size" in the axial direction with the unit of micro-meter. Users can change the "Initial Step" and "Last Step" to adjust the applied range of numerical reconstruction. Since the accuracy of the reconstruction depends strongly on experimental conditions, properties such as the wavelength of the light used for illumination, refractive index of solution, and conversion factor must be entered the interface. Moreover, the program provides the "1D Decov" option activating the deconvolution process [28]. Using this option, the intensity reconstruction of a point source is deconvolved with the reconstruction results from a hologram so that a better signal to noise ratio can be achieved. As an alternative to the "1D Decov" option, we also offer a "2D" choice which is based on the implementation of angular spectrum method using Equation (1). This option can be used to verify the results from other implementations. The program also offers several more useful functions. The user can activate "Present Tracking Images" or "Save Tracking Images" to see if the targets are correctly tracked. One can also select a single target manually and visualize the intensity reconstruction in axial direction by activating " Show Intensity Reconstruction". The path of "Folder Name" under functions group "Save Data" can be rewritten to save data from different experiment. The configurations of different experiments can also be saved and loaded. The post-processing interface (see supplementary materials section Post-Processing Interface) allows users to check the results from a single trajectory file or from a group of trajectories in a folder. The option "Single Trajectory" provides visualization of trajectory of a single particle. The option "Flow Profiling" collects trajectories of all particles identified in the tracking process. In this option, the user can set frame rate at which the video sequence was recorded. This information is used to calculate the particle speed. Additionally, users can set the reconstruction distance range in µm to present trajectories only within selected distances. The user also set the minimum length of trajectory to remove falsepositive results. To reduce the number of false-positive for flow profiling applications, the minimum particle travel distance between two consecutive frames can be defined in pixel. If the travel distance is below this limit, the corresponding trajectory is discarded for flow visualization.
9
Friday, January 27, 2017
Manuscript
4. RESULT AND DISCUSSION 4.1. 2D Particle Tracking: Center Detection with Nanometer Accuracy We validate the 2D tracking performance of UmUTracker using the workflow described in section 3.3 and with the axial reconstruction process deactivated. Therefore, we determine the lateral position of PS particles from images acquired using bright field microscopy (see section 2.3) and digital holography (see section 2.2). First, we track the position of a single supercoiled DNA tethered particle under bright field microscopy conditions, as shown in Figure 4A. The raw data are taken from [16,17]. To determine the center position of the particle from a time series of images, we run UmUTracker in its standard configuration without background subtraction (see Figure 4A, blue data points). As it is expected for restricted Brownian motion, we find a Gaussian distributed movement for the tethered particle (see Figure 4 A, histograms). This conclusion is in agreement with the results published in [16,17]. We further test the 2D multiple tracking algorithm by selecting 30 samples of 1 µm particles which are immobilized on a coverslip (Figure 4 B, top images), illuminated with a LED. A sample video file is provide as supplementary materials and we describe a protocol to analyze this file in the supplementary materials document. The piezo-stage is driven with an oscillation amplitude of 250.0 nm and a frequency of 0.50 Hz. Videos of the measurement are acquired at 200 Hz. To analyze the experimental data, we run UmUTracker in its standard configuration again. We only adapt the value for Canny edge detection to ensure stable detection and tracking of particles during oscillation. By analyzing the oscillation data in the y direction, we retrieve the expected particle motion (Figure 4B, black data). A sine function is fitted to the data providing an amplitude of 252.0 ± 0.5 nm and a periodicity of 0.50 ± 0.01 Hz (Figure 4B, blue line). Therefore, the difference between measured and fitted amplitude and periodicity is less than 1%. We observe similar results of oscillations in x direction (data not shown). From the experiments above, we demonstrate that UmUTracker can automatically detect particle motions in the xy-plane in two different applications. The accuracy of tracking depends on microscopy system, e.g. optical zoom can be applied to increase magnification so that the resolution can be improved. The parameters for localization and tracking in UmUTracker need also to be tuned to balance between performance and accuracy.
Figure 4 A) Experiments using bright field experimental data of supercoiled tether DNA undergoing restricted diffusion. Gaussian fitting is applied to the displacement distribution and we get R2 as 0.94 and 0.96 for data in x and y direction, respectively. B) Sinusoidal oscillation of a 1 µm PS particle in y direction (black data) with preset oscillation amplitude of 250 nm and a periodicity of 0.5 Hz determined by UmUTracker. The fitted oscillation amplitude and periodicity (blue line)
10
Friday, January 27, 2017
Manuscript
differ less than 1% from the values set for the piezo stage movement. This agreement is confirmed by a coefficient of determination R2 = 0.98.
4.2. 3D Particle Tracking: Numerical Reconstruction of the Axial Particle Position with Micrometer Precision After evaluating the xy-resolution of UmUTracker, we now focus on determining the axial particle position using the reconstruction method proposed in section 3.2. First, we produce synthetic diffraction patterns of PS particles without background noise using Zemax software. In the simulations, 10 spherical objects, with refractive index of 1.50 and radius of 3.50 µm are placed in water with refractive index of 1.338 at reference distances 40, 50, 60, 70, 80, 90, 100, 110, 120 and 130 µm, from a virtual detector (Figure 5A). A 300 × 300 µm2 virtual detector in Zemax counts the number of rays passing through a surface without affecting the propagating rays. Rays are generated from a coherent light source of 470 nm wavelength and 4 billion rays are traced in a simulation. The image generated by the virtual detector has a size of 1500 × 1500 pixels resulting in a 200 nm/pixel conversion factor for reconstruction. Tracking of particles is performed by using the simulation data including 100 frames of the same synthetic image. Some key parameters used in UmUTracker for ITs transform to detect particle centers are: 401 × 401 pixels as the region-of-interest for each particle, 3 layers in scale, ITs threshold of 0.03 and the iteration of randomized sampling is set to 10× the number of binary edge points. We find a linear relationship between the reference positions and reconstructed distances from focal point of particle to virtual detector (Figure 5B). The reconstruction uncertainty is ~ 40 nm. This indicates that reconstruction of particle heights using UmUTracker is accurate for images acquired under decent light conditions and without background noise.
Figure 5 Relation between numerical reconstruction of particle intensity and estimated position in z axis using the synthetic data from Zemax simulation. A) presents the reconstructed focal distance in 3D space. B) presents the linear relationship between simulated z distance to the detector and the reconstructed focal distance (dashed line). Error bars at each point of reconstructed focal distance represents the standard deviation of measurement using UmUTracker averaged over 100 frames. The reconstruction uncertainty is approximately 40 nm. The coefficient of determination R2 = 0.99 indicates the fitting of linear model with a slope equal to 1.0 is accurate and therefore the reconstructed distance coincides with the theoretical heights.
To validate our simulation results experimentally, we again use 1 µm PS particles immobilized on the bottom coverslip of the measurement chamber, as explained in section 2.1. In detail, we first focus on the stationary particles on the coverslip. Then we perform a 1D scan along the z axis, covering a range between -50 µm to 50 µm (Figure 6A) around the focus of beads with a step size of 1 µm. At each position 40 frames are acquired at a frame rate of 200 Hz (Figure 6 B, spherical data points). 11
Friday, January 27, 2017
Manuscript
In a range from 2 µm to 50 µm UmUTracker provides a linear relationship between piezo stage movement and reconstructed focal distance (Figure 7 B, blue data points). Based on the slope of the linear fit the reconstruction underestimates the 1 µm steps by approximately 1%. The reconstruction uncertainty is given by the standard deviation at each step and the averaged value is calculated to be ~150 nm. Around the focal region ranging from 0 µm to 2 µm (Figure 7 A, middle and Figure 7 B), the reconstruction cannot, however, resolve the 1 µm steps, but shows a plateau around 0.8 ± 0.9 µm. This can be explained by the fact that both the method based on reconstructing intensity and the theory of Rayleigh-Sommerfeld are not derived to handle such situations. Interestingly, the reconstruction of the particle height gives reasonable results even if the hologram is produced by the interference between the non-scattered and the backscattered light from the particle (Figure 6 B, red data points). In this scenario, the image plane is located between the light source and particles (Figure 7 A, top), in contrast to a classical in-line holography alignment, which is: light source, particles and image plane (Figure 7 A, bottom). Nonetheless, we observe again a linear relation between reconstructed focal distance and piezo stage movement, covering a range from -3 µm to -40 µm (Figure 6 B, yellow line). The reconstruction uncertainty is 150 nm. Below -40 µm focal distance the reconstruction algorithm becomes error-prone due to a poor image quality resulting in blurry diffraction pattern. The same applies to focal distances above 50 µm (see section 4.3, Figure 7 B). To improve the image quality in these two extreme cases, a highly monochromatic light source (e.g. a laser) can be used for sample illumination. Additionally, using a more sensitive sensor and an objective with higher magnification will produce high-definition diffraction patterns. Another error source reducing the image quality is that the CCD sensor can induce measurement bias [29] and noises generated from thermal electrons within the exposure time, producing diffusive diffraction pattern. This effect becomes only prominent for high frame rates, but this can be compensated by using high light intensities, producing enough photons that are scattered by the object and subsequently detected by CCD camera. Eventually, the interference pattern recorded with the CCD camera via a microscope objective contains a phase shift. This causes an increasing error in intensity reconstruction when objects are further away from the image plane [30]. Despite these deviations, we showed that UmUTracker can reconstruct the distance of a particle to the focal plane over a height range of 50 µm with high accuracy.
Figure 6 A) Different positions of the sample during the 1D scan in axial direction. In the top image, the sample is positioned between objective and image plane. During the scan, the sample is moving through the image plane (middle), approaching its final position with the image plane situated between sample and objective (bottom). The latter scenario corresponds to classical in-line digital holography. B) Reconstruction of the focal distance for 1 µm PS particles from experimental data acquired at 200 Hz. The reconstructed focal distance (blue data points) shows a linear relationship (black line, slope = 0.99, R2 = 0.99) with the piezo stage distance. At each step, 40 images are recorded resulting in a standard deviation of 150 µm. Even for a scenario in which the image plane is positioned between light source and particle, UmUTracker reconstructs the particle height correctly (red data points, yellow line) showing again a linear behavior (slope = -1.03, R2 = 0.99).
12
Friday, January 27, 2017
Manuscript
4.3. 4D Particle tracking: Characterizing the Flow Profile in a Microfluidic Chamber After verifying the accuracy of UmUTracker for 2D particle tracking and 3D axial position reconstruction, we now analyze the flow profile in a rectangular microfluidic chamber by tracking the velocity of 1 µm particles moving at different heights in the flow. For that purpose, we use the commercial available 100 µm high microfluidic bio-chip (see section 2.1) and create a constant and reproducible flow rate of 26 ± 2 nL/s in the x-direction using a microfluidic pump equipped with a 10 µl pipette. A 150x150 µm area in the xy-plane in the central part of the chamber is imaged ~5 µm below the bottom surface with a camera frame rate of 200 Hz. For UmUTracker, we use a 401 × 401 pixels region-of-interest for each particle, 4 layers in scale, ITs threshold of 0.1 and the iteration of randomized sampling is set to 5× the number of binary edge points. To visualize the flow cross section perpendicular to the flow direction, we collect all trajectories of tracked particles and calculate their mean position in all directions x,y,z (see Figure 7 A). The speed along the z axis (reconstructed focal distance) of this cross section is calculated by taking the distance between first and last position divided by the travelling time for each trajectory (see Figure 7 B). For a flow rate of 26 nL/s the flow velocity ranges from 10 µm/s to 1050 µm/s for particles close to the bottom cover slip and particles moving in the center of the flow chamber (Figure 7 A, blue and red data points). Fitting the velocity profile along the z axis of the flow cross section with a polynomial of second order, confirms its parabolic shape as it is expected for a laminar Poiseuille flow (Figure 7 B, dashed red line). In this context, it must be mention that only data points below a reconstructed focal distance of 55 µm are considered for fitting (Figure 7 B, blue data points), since above this height we observe a pronounced uncertainty in our measurement results. This can be explained by the fact that diffraction patterns for particles far away from the image plane produce only diffusive diffraction patterns, reducing the accuracy of the reconstruction routine (see section 4.2). Additionally, the diffraction pattern of fast moving particles in the flow center are blurred and extended in the moving direction. We will discuss the influence of motion blur on our results in the following paragraph. To verify our flow data and its velocity profile, we simulate the latter using CFD simulations. Since the experimentally determined flow rate is 26 ± 2 nL/s, we conduct the simulations for a mean flow rate of 26 nL/s and for the two extreme values, that are 24 nL/s and 28 nL/s (Figure 7 b, light blue line and grey area). With a maximum flow velocity of 1150 mm/s the simulation result for 26 nL/s overestimates the experimental value by 3 %. Therefore, our flow data are better described by simulations assuming a flow rate of 24 nL/s. Furthermore, the experimentally reconstructed flow chamber height exceeds the specifications from the supplier by approximately 5%. Both deviations in maximum flow velocity and chamber height can be attributed first to a slight misalignment of coordinates between sample stage and camera during the measurement. Second, due to the motion blur the algorithm overestimates reconstructed heights for fast moving particles and for those far away from the image plane. In contrast, the flow velocity error originating from poor particle center detection is comparably small, as it turned out that the tracking part of UmUTracker is robust, providing nanometer resolution even under noisy conditions (see section 4.1). Despite these deviations, our result shows the correct flow profile in a microfluidic channel over a height range of approximately 55 µm, exceeding the depth of field of 60x/1.40 objective by a factor above 100. Furthermore, we received decent agreement between measured and simulated flow profile, proving that UmUTracker characterize microfluidic flows with high accuracy.
13
Friday, January 27, 2017
Manuscript
Figure 7 Microfluidic flow profiling using UmUTracker. A) presents sampling coordinates at averaged reconstruct distance (axial direction) and averaged y axis positions (horizontal direction which is not the flow direction) for each of the trajectory. The color code represents the averaged flow velocity at different heights. B) presents the flow profile in axial direction. Samples of averaged velocity at different axial positions are marked as dots regardless of color. A second order polynomial function is fitted to the samples (R2 = 0.93) in blue as dashed red line and the simulation results using CFD is presented in light blue line with error margins in grey.
4.4. Execution time To evaluate the general performance of algorithm, we conducted tracking experiments using a computer with an Intel® Core™ CPU i7-4770 processor and 16 GB of RAM memory running Windows 7 professional. The UmUTracker used template size 201 × 201 in a 1024 × 1024 image for tracking and axial intensity reconstruction with a speed of 5 fps. Comparing with the 2D reconstruction with parallel computing utilizing 4 CPU cores based on Equation (1), the 1D version of our intensity reconstruction without any parallel computing can provide results more than 10 times faster depending on the size of the template.
5. CONCLUSION We present an automated software for tracking particles using images acquired with bright field or digital holographic microscopy. A robust detector algorithm is implemented that is based on the ITs transform for localizing circular diffraction patterns and on a resource-efficient solution for numerical reconstruction of spherical particles using 1D profile. The software is capable of handling 2D tracking with nanometer accuracy, and 3D tracking for in-line DHM setup as well as flow profile estimation as velocimetry using micro-meter sized PS particles. Reliable automatic tracking makes flow measurements much simpler and the execution time with a 201 × 201 template in a 1024 × 1024 image can reach 5 fps. Due to the object-oriented programing style, the software is easy to modify with customized modules. The application of this program is not limited to particle tracking or flow measurement. It can also be used for tracking of cells and bacteria. The latest version of the program is found here: https://sourceforge.net/projects/umutracker/
ACKNOWLEDGEMENTS This work was supported by the Swedish Research Council (2013-5379) and from the Kempe foundation to M.A.
14
Friday, January 27, 2017
Manuscript
REFERENCES [1] N. Chenouard, I. Smal, F. de Chaumont, M. Maška, I.F. Sbalzarini, Y. Gong, J. Cardinale, C. Carthel, S. Coraluppi, M. Winter, A.R. Cohen, W.J. Godinez, K. Rohr, Y. Kalaidzidis, L. Liang, J. Duncan, H. Shen, Y. Xu, K.E.G. Magnusson, J. Jaldén, H.M. Blau, P. PaulGilloteaux, P. Roudot, C. Kervrann, F. Waharte, J.-Y. Tinevez, S.L. Shorte, J. Willemse, K. Celler, G.P. van Wezel, H.-W. Dan, Y.-S. Tsai, C. Ortiz de Solórzano, J.-C. Olivo-Marin, E. Meijering, Nat. Methods 11 (2014) 281–9. [2] D. Gabor, Nature 161 (1948) 777–778. [3] J. Garcia-Sucerquia, W. Xu, S.K. Jericho, P. Klages, M.H. Jericho, H.J. Kreuzer, Appl. Opt. 45 (2006) 836. [4] X. Yu, J. Hong, C. Liu, M.K. Kim, Opt. Eng. 53 (2014) 112306–112306. [5] F.C. Cheong, B. Sun, R. Dreyfus, J. Amato-Grill, K. Xiao, L. Dixon, D.G. Grier, Opt. Express 17 (2009) 13071–13079. [6] Y. Pu, H. Meng, Appl. Opt. 44 (2005) 7697–7708. [7] M. Molaei, J. Sheng, Opt. Express 22 (2014) 32119–37. [8] J. Zakrisson, S. Schedin, M. Andersson, Appl. Opt. 54 (2015) 7442–7448. [9] P. Langehanenberg, L. Ivanova, I. Bernhardt, S. Ketelhut, A. Vollmer, D. Dirksen, G. Georgiev, G. von Bally, B. Kemper, J. Biomed. Opt. 14 (2015) 14018. [10] J.L. Nadeau, Y. Bin Cho, J. Kühn, K. Liewer, Front. Chem. 4 (2016) 17. [11] Z. El-Schish, A. Mölder, M. Sebesta, L. Gisselsson, K. Alm, G.W. A, in:, Microsc. Sci. Technol. Appl. Educ., 2010, pp. 1055–1062. [12] T. Shimobaba, Y. Sato, J. Miura, M. Takenouchi, T. Ito, Opt. Express 16 (2008) 11776. [13] N. Masuda, T. Ito, K. Kayama, H. Kono, S.-I. Satake, T. Kunugi, K. Sato, Opt. Express 14 (2006) 587–92. [14] S. Tiwari, V.P. Shukla, a. K. Singh, S.R. Biradar, J. Image Graph. 1 (2014) 176–184. [15] E. Fällman, S. Schedin, J. Jass, M. Andersson, B.E. Uhlin, O. Axner, Biosens. Bioelectron. 19 (2004) 1429–1437. [16] K. Norregaard, M. Andersson, K. Sneppen, P.E. Nielsen, S. Brown, L.B. Oddershede, Proc. Natl. Acad. Sci. 110 (2013) 17386–17391. [17] K. Norregaard, M. Andersson, P.E. Nielsen, S. Brown, L.B. Oddershede, Nat. Protoc. 9 (2014) 2206–2223. [18] M. Andersson, F. Czerwinski, L.B. Oddershede, J. Opt. 13 (2011) 44020. [19] H. Zhang, K. Wiklund, M. Andersson, Pattern Recognit. 54 (2016) 218–228. [20] T. Lindeberg, J. Appl. Stat. 21 (1994) 225-. [21] L. Denis, Proc. SPIE 5914 (2005) 59140J–59140J–14. [22] J.W. Goodman, Introduction to Fourier Optics 3rd Ed., Roberts & Company, 2005. [23] J. Canny, IEEE Trans. Pattern Anal. Mach. Intell. PAMI-8 (1986) 679–698. [24] N. Otsu, IEEE Trans. Syst. Man. Cybern. 9 (1979) 62–66. [25] C. Gosse, V. Croquette, Biophys. J. 82 (2002) 3314–3329. [26] H.W. Kuhn, Nav. Res. Logist. Q. 2 (1955) 83–97. [27] R.E. Kalman, J. Basic Eng. 82 (1960) 35. [28] F.C. Cheong, B.J. Krishnatreya, D.G. Grier, 282 (2010) 95–99. [29] M. Legrand, J. Nogueira, A.A. Vargas, R. Ventas, M.C. Rodríguez-Hidalgo, Meas. Sci. Technol. 25 (2014) 65207. [30] J. Sheng, E. Malkiel, J. Katz, Appl. Opt. 45 (2006) 3893–3901.
15
Friday, January 27, 2017
Manuscript
Supplementary Materials UmUTracker: A versatile MATLAB program for automated particle tracking of 2D light microscopy or 3D digital holography data Hanqing Zhang†, Tim Stangner†, Krister Wiklund†, Alvaro Rodriguez†, Magnus Andersson† †
Department of Physics, Umeå University, 901 87 Umeå, Sweden
Keywords: image processing, digital holographic microscopy, particle tracking velocimetry, microfluidics.
TABLE OF CONTENTS Getting started ...................................................................................................................................... 17 1. Requirements ............................................................................................................................ 17 2. Video file preparation................................................................................................................ 17 3. Load Video ................................................................................................................................. 17 Quick start ............................................................................................................................................. 18 Basic Procedures ............................................................................................................................... 18 Demo video example ......................................................................................................................... 18 Main Interface ....................................................................................................................................... 19 Major functions ................................................................................................................................. 19 1. Pre-processing ........................................................................................................................... 19 2. Particle localization.................................................................................................................... 20 3. Tracking ..................................................................................................................................... 21 4. Refinement ................................................................................................................................ 21 5. Numerical reconstruction .......................................................................................................... 21 Tracking Results ................................................................................................................................ 22 Configurations ................................................................................................................................... 22 Post-processing Interface ...................................................................................................................... 24 Single Trajectory ............................................................................................................................... 24 Flow Profile ....................................................................................................................................... 24
16
Friday, January 27, 2017
Manuscript
GETTING STARTED 1. Requirements UmUTracker is developed in MATLAB (version R2014b) using the image processing toolbox to process video frames. UmUTracker is tested on Windows 7 and 10 operating a 64-bit system. We recommend a minimum of 4 GB of RAM memory and sufficient hard drive space to ensure reliable operation when running long video files. A 2.0+ GHz processor or higher is recommended to reduce the execution time. 2. Video file preparation UmUTracker can process video files, supporting a wide variety of video types; .avi, .mp4, .m4v, .mov. We recommend to acquire sample videos with highest quality to ensure reliable object identification by the tracking algorithm. To avoid motion blur, make sure that a video is captured using a proper frame rate and shutter speed. 3. Load Video Before loading the video, please check the default tracking parameters of each function and tune them if necessary. In general, the tracking functions are disabled before loading the video. To load a video, please press 'File' in the menu options and then press 'Load', or simply press 'Load Video' (see Figure S8) and select a sample video. Once the video is loaded correctly, the 'Input path' and 'File name' is automatically filled in with corresponding information of the sample video. The 'Check Edge Detection' as well as 'Start' buttons will now be activated.
17
Friday, January 27, 2017
Manuscript
QUICK START 5.1. Basic Procedures 1. Unpack all files from UmUTracker.zip to a folder. Double click the UMUTracker.m and open MATLAB. Run UMUTracker.m in the MATLAB to load the main interface. 2. Load a video and then choose between 'Manual' or 'ITs Transform' in the panel group 'Particle Localization'. Thereafter press 'Check Edge Detection' to analyze the detection results. This can require some tuning depending on the video quality. For 2D tracking, untick the checkbox 'Enable Numerical Reconstruction'. All parameters for tracking can now be changed, saved or load from a .mat file. 3. Click 'Start' for tracking. If 'Manual' is selected, click the particle center in the image and double click the last particle center to enable tracking. You can pause or stop the tracking by pressing 'Pause' or 'Stop' button. 4. For optimal tracking, you need to tune the parameter values for the different functions. Below, we explain in details how this affects the data and give some suggestion when to use what values.
5.2. Demo video example We provide a demo video 'DemoVideo.avi' of a micron-sized particle recorded using in-line DHM. The bead is in water (n = 1.33) and attached to the bottom of coverslip. We use light at 470 nm to illuminate the sample and pixel to nm conversion factor is 132 nm. We provide a configuration file 'DemoVideoConfig.mat', which includes the parameters used when we analyzed the video. This configuration file is loaded by pressing the 'Load' button under the configuration panel in the main interface.
18
Friday, January 27, 2017
Manuscript
MAIN INTERFACE The main interface controls the file input-output functionalities and all tracking features can be tuned.
5.3. Major functions
Figure S8. Overview of the main interface. Five major functionalities are presented and marked as: 1. Preprocessing, 2. Particle Localization, 3. Tracking, 4. Refinement, 5. Numerical Reconstruction.
1. Pre-processing To activate background subtraction, select the function 'Background Subtraction' and set the 'Number of Background Images' used to create a background image. This value is set to 1 by default. The background image is updated in two ways. 'Static Background' creates the averaged image by using the number of frames set, starting from the 1st frame of the video. 'Moving Average' creates the averaged background image by using the current frame and previous frames set by 'Number of Background Images'. The 'Region of Interest' function contains two options. The 'Boundary Region' option allows you to set the ROI for all video frames as an image cropped from the original frame by removing pixels close to the edge. The number of pixels removed is set to 0 by default. Alternatively, the ROI can be selected manually with 'Select ROI'. In this case, the 1st frame of the video will be shown in a separate window and you can drag a squared region and double click to activate the ROI region. After the ROI is selected the ROI size will be updated and presented along with the frame size. The 'Normalized Intensity' function sets the image intensity range. The range is [0,1]. To change the original frame size, the 'Resize' option can be used by changing a factor set by 'Resize factor'. By default this value is set to 1. To remove noises in the image, a Gaussian filter can be used, 'Gaussian Filter'. The size of Gaussian kernel in pixels can be set with 'Kernel Size'. 19
Friday, January 27, 2017
Manuscript
2. Particle localization Two particle localization strategies can be selected: 'Manual Selection' or 'ITs Transform'. The 'Manual Selection' activates the 'Local Matching' in the 'Tracking' process. When you click the 'Start' button for tracking, the first frame of the video will pop-up and you can single click the object in the image to be tracked and double click the last object when all objects are labeled. The 'ITs Transform' activates the 'Auto Detection' option. The 'Number of Scales' defines the number of images at different Gaussian scale space. This number is related to the size of the image and a reasonable value is in the range [1,4]. A larger value is suitable to detect large diffraction patterns. The 'ITs Transform Threshold' defines the minimum threshold value to identify a circular shape based on references [1]. This value can be set in range [0.01,0.3]. A large value increases the number of detections but with a possibility to increase false-positive detections. The 'Segment Length' is set to 10 indicating that at least 10 connected edge pixels are need for circle detection. A smaller number means more detections with increasing false-positives. This value is preferably set from 3 to 100. The 'Minimum Votes ' sets the threshold for selecting optimal detections. This value is set to 30 by default indicating the diffraction pattern center is recognized only when the voting number at a pixel is above this value. This value depends on the radius and completeness of circular pattern and a practical value is in range [5,50]. The 'Multiple of Iterations' sets the number of edge pixels to be checked for circular patterns using randomized sampling. This value is set to 5× the number of edge pixels by default and can be change from 1 to 10. A large value increases the number of detections and improves the precision of detection in the image but with longer execution time. The 'Mapping Kernel Size' represents the radius of vote area. This value is set in range [1,10] and a large value increases detection accuracy for object with large radius. The 'Check Edge Detection' option provides an intuitive way to set the threshold value for edge detection. Once the button is pressed, a pop-up interface is presented, see Figure S9. This is important since Canny edge detection [2] is applied as a pre-requisite for the ITs transform. We apply the Otsu thresholding method [3] to get a default threshold value. The resulting value is applied directly to Canny detection as higher bound of threshold, and a lower bound is set to one-third of this value. In practice, users can set the higher bound manually by changing the 'Canny Edge Multiple' within [0,10].
Figure S9. Interface for checking the edge detection. The original image frame (left) and edge extraction results using Canny edge detection (right) are presented. The threshold value for edge detection can be set by dragging the slider and save the corresponding values by pressing the button 'Save'.
20
Friday, January 27, 2017
Manuscript
3. Tracking The option 'Kalman' ensure improved tracking using the Hungarian method with a Kalman filter, which provides the optimum distance assignment [5,6]. As an alternative, the option 'Local Matching' can be selected so that a local matching using ITs transform is applied to image templates to find the diffraction center. The parameter 'Cost of NonAssignment' for Hungarian method is set to 100, meaning that the detection algorithm will not identify particles if the distance between detection and predicted position is larger than 100 pixels. Similarly the 'Maximum Travel Distance' set the upper bound of distance change regardless of the tracking method. The 'Number of Tracks' set the maximum number objects to be tracked in the program. The 'Template Size' is set to 200 indicating a 401×401 template is created around the particle center. This value can range from 10 to 500 depending on the size of object in the video frame. To ensure correct template data for axial reconstruction process, the user can activate 'Tracking Boundary', meaning that each template must have acquired all its intensity values within the range of frame size. 4. Refinement The 'Re-sampling' function creates a 1D profile, which can be set using either one of the two following sampling strategies. The option 'Circular' samples in all the radial directions, whereas the 'Sector' only samples pixel values in the direction of the moving object to minimize the effect of motion blur. Thus, we recommend to use 'Circular' when detected objects are not exposed to motion blur. The 'Xcorr' modules [6] refines the position of each track using the intensity profile and a fixed sized template of the object to find the geometrical center position with sub-pixel accuracy. This, however, is a computational heavy process. 'Median Background sub' improves the accuracy of the algorithm when the median value in the image represents the intensity of the background pixels. 5. Numerical reconstruction If experimental data are acquired using digital holographic microscopy (DHM) and the spatial position (xyz) should be determined, please activate 'Enable Numerical Reconstruction' to estimate the axial object position. Set the 'Wavelength' of the light used for illumination, the 'Refractive index' of the solution, and the 'Conversion factor' between pixel and (nano-)meter scale in the xy-plane. The program offers different reconstruction approaches. The option '1D' can be selected if users want to use the angular spectrum method with a 1D radial intensity profile. The '1D Decov' option use a deconvolution process [7], and the '2D' option use an implementation of the 2D angular spectrum method [8]. The 'Template Margins' for reconstruction is set 2× the size of intensity profile to avoid artifacts during the reconstruction process. The 'Template size' can also be changed, but please keep in mind that this is a trade-off between efficiency and accuracy. This value is by default 1 meaning the template has its original size defined in the 'Tracking' process. If a badly derived reconstruction is made due to a template with its particle center calculated with some error, the user can apply a mask around the particle center within a range defined by the 'Paraxial mask radius' to collect averaged reconstructed intensities. Reconstructed intensities are sampled at each 'Step Size' in the axial direction with the unit of micrometer. Users can change the reconstruction distance to adjust the applied range of the numerical reconstruction. The 'Number of Steps' and 'Step Resolution' are automatically calculated according to the range of distance and step size.
21
Friday, January 27, 2017
Manuscript
5.4. Tracking Results Users can activate 'Present Tracking Images'. By doing so, tracked objects are tagged with their identity number, tracking score, axial depth position and speed of the particle calculated using the current and previous positions (see Figure S10A). The 'Save Tracking Images' saves the trajectories of an object to a .txt file in a folder with its name defined by 'Folder Name'. One can also select a single target manually and visualize the intensity reconstruction in the axial direction by activating 'Present Single Track Reconstruction' (See Figure S10B).
5.5. Configurations In 'Configurations', parameters for different experiments can be saved by clicking 'Save' with its file name written in 'Save Name'. The parameters are stored in a .mat format in the local directory of the program. Saved parameters can be loaded into the program by pressing 'Load' button and select the corresponding .mat file.
22
Friday, January 27, 2017
Manuscript
Figure S10 A) A demonstration of tracked object. The blue circle represents the size of the ROI for numerical reconstruction. B) The top graph represents the intensity profile reconstruction (vertical axis) at different axial distance (horizontal axis). The graph in the middle represents the axial intensity value along the center of the particle. The maximum intensity value (vertical axis) and the corresponding distance (horizontal axis) is then used to estimate the particle axial distance. The plot in the bottom shows a segment of the reconstructed distance in steps (vertical axis) vs. the frame number (horizontal axis).
23
Friday, January 27, 2017
Manuscript
POST-PROCESSING INTERFACE We provide two post-processing interfaces, one to visualize the trajectory of a single object and one to analyze flow profile from multiple trajectories.
5.6. Single Trajectory The user can press 'Post-Processing' in the menu options and then press 'Single Trajectory'. The interface then provides the trajectory information in the x, y and z axis, and a 4D plot is created including the 3D trajectory, see Figure S11.
Figure S11. Interface showing the trajectory of a particle. The three plots on the left represent the frame number vs. object trajectory in x, y and z axis, respectively. The colored graph on the right shows the 3D trajectory with the time values colored according to the color bar to the right.
5.7. Flow Profile The 'Load Data' option finds the folder of saved object trajectories. All saved .txt files in that folder are supposed to be created by UmUTracker during the tracking. After loading all the .txt data paths to the program, press 'Analyze' to show the 4D flow profile. Then, a plot with the averaged axial position and the average speed is generated with a 2nd order polynomial fit, which is set as default. The same result is obtained by pressing '4D Profile'. In 'Trajectory', several criteria can be set to remove errors and outliers in the data. The 'Minimum Travel Distance' sets the minimum difference of the first and last position detected in each object. The 'Minimum Track Size' sets the minimum length of a trajectory. The 'Axial Standard Deviation' sets the maximum value used for standard deviation in axial position. This value is to remove data points that changes drastically in axial direction, which can induce error during fitting. The 'Frame Rate' is needed for calculating the flow speed profile. To visualize the data, tune the option 'Sample Axial Distances'. This uses the average trajectories from a given interval along the axial direction. An exemplary result is shown in Figure S12. Here, we set the option 'Sample Axial Distances' to 5 and 65 micro-meter. Thus, only samples within this interval are 24
Friday, January 27, 2017
Manuscript
plotted. Similarly, for fitting the sampled data, the user can set 'Curve Fitting Distances' to choose the range for the fit. Besides, the 'Data Fitting' options allow the user to set the 'Polynomial Order' and the number of interpolated values based on the fitting function, 'Number of Fitting Bins'. The 'XZ view' and 'YZ view' allows the user to visualize the flow profile in the x or y direction. For example, if the fluidic flow is in x direction, the user can plot the yz view to check the 2D averaged flow profile.
Figure S12 Interface for flow profiling.
25
Friday, January 27, 2017
Manuscript
[1]
H. Zhang, K. Wiklund, M. Andersson, Pattern Recognit. 54 (2016) 218–228.
[2]
J. Canny, IEEE Trans. Pattern Anal. Mach. Intell. PAMI-8 (1986) 679–698.
[3]
N. Otsu, IEEE Trans. Syst. Man. Cybern. 9 (1979) 62–66.
[4]
H.W. Kuhn, Nav. Res. Logist. Q. 2 (1955) 83–97.
[5]
R.E. Kalman, J. Basic Eng. 82 (1960) 35.
[6]
C. Gosse, V. Croquette, Biophys. J. 82 (2002) 3314–3329.
[7]
F.C. Cheong, B.J. Krishnatreya, D.G. Grier, 282 (2010) 95–99.
[8]
J.W. Goodman, Introduction to Fourier Optics 3rd Ed., Roberts & Company, 2005.
26