SOIL, 4, 123–139, 2018 https://doi.org/10.5194/soil-4-123-2018 © Author(s) 2018. This work is distributed under the Creative Commons Attribution 4.0 License.
SOIL
Uncertainty indication in soil function maps – transparent and easy-to-use information to support sustainable use of soil resources Lucie Greiner1 , Madlene Nussbaum2 , Andreas Papritz3 , Stephan Zimmermann4 , Andreas Gubler1 , Adrienne Grêt-Regamey5 , and Armin Keller1 1 Swiss
Soil Monitoring Network (NABO), Agroscope, 8046 Zurich, Switzerland of Agricultural, Forest and Food Science (HAFL), Bern University of Applied Sciences (BFH), 3052 Zollikofen, Switzerland 3 Institute of Biogeochemistry and Pollutant Dynamics, Swiss Federal Institute of Technology (ETH), 8092 Zurich, Switzerland 4 Forest Soils and Biogeochemistry, Soil Functions and Soil Protection, Swiss Federal Institute for Forest, Snow and Landscape Research (WSL), 8903 Birmensdorf, Switzerland 5 Planning of Landscape and Urban Systems, Swiss Federal Institute of Technology (ETH), 8093 Zurich, Switzerland 2 School
Correspondence: Lucie Greiner (
[email protected]) Received: 20 December 2017 – Discussion started: 31 January 2018 Revised: 3 April 2018 – Accepted: 22 April 2018 – Published: 29 May 2018
Abstract. Spatial information on soil function fulfillment (SFF) is increasingly being used to inform decision-
making in spatial planning programs to support sustainable use of soil resources. Soil function maps visualize soils abilities to fulfill their functions, e.g., regulating water and nutrient flows, providing habitats, and supporting biomass production based on soil properties. Such information must be reliable for informed and transparent decision-making in spatial planning programs. In this study, we add to the transparency of soil function maps by (1) indicating uncertainties arising from the prediction of soil properties generated by digital soil mapping (DSM) that are used for soil function assessment (SFA) and (2) showing the response of different SFA methods to the propagation of uncertainties through the assessment. For a study area of 170 km2 in the Swiss Plateau, we map 10 static soil sub-functions for agricultural soils for a spatial resolution of 20 × 20 m together with their uncertainties. Mapping the 10 soil sub-functions using simple ordinal assessment scales reveals pronounced spatial patterns with a high variability of SFF scores across the region, linked to the inherent properties of the soils and terrain attributes and climate conditions. Uncertainties in soil properties propagated through SFA methods generally lead to substantial uncertainty in the mapped soil sub-functions. We propose two types of uncertainty maps that can be readily understood by stakeholders. Cumulative distribution functions of SFF scores indicate that SFA methods respond differently to the propagated uncertainty of soil properties. Even where methods are comparable on the level of complexity and assessment scale, their comparability in view of uncertainty propagation might be different. We conclude that comparable uncertainty indications in soil function maps are relevant to enable informed and transparent decisions on the sustainable use of soil resources.
Published by Copernicus Publications on behalf of the European Geosciences Union.
124 1
Introduction
Human wellbeing relies on soil resources, and soil should therefore be better integrated into ecosystem service frameworks that inform decision-making and environmental policies (Dominati et al., 2010). Soil acts in multi-functional ways, and fulfills many functions in the regulation of the nutrient and water cycles, in carbon sequestration, or in the filtering of chemical compounds, providing biodiversity and habitats for flora and fauna, and it is essential for the production of food, fiber, and biomass (Haygarth and Ritz, 2009; Adhikari and Hartemink, 2016). The capacity of soils to deliver ecosystem services is largely determined by its functions, and each individual soil function can be seen as providing a soil-related contribution to ecosystem services (Bouma, 2014). The concept of soil function has increasingly been applied to reveal the role played by soils in sustaining the wellbeing of humans and of society, emphasizing the multifunctionality of soils and their chemical, physical, and biological properties (EC, 2006; Haygarth and Ritz, 2009; Tóth et al., 2013; Dominati et al., 2014; Schulte et al., 2014; Schwilch et al., 2016; Makó et al., 2017). In general, soil function assessment (SFA) entails the rating of soils according to their capacity to fulfill an individual soil function, the so-called soil function fulfillment (SFF). Simplified static SFA methods result in scores that can be integrated into spatial planning procedures (Greiner et al., 2017). Maps that enable visualization of SFF, so-called soil function maps, are well suited to communicating the importance of soils to spatial planners and other disciplines (Sanchez et al., 2009; Haslmayr et al., 2016) and can inform stakeholders on the role of soils in society and the environment (Haygarth and Ritz, 2009; Bouma, 2010; Miller, 2012). In particular, the European soil protection strategy (EC, 2006), even though not adopted, brought the domain of soil functions into public discussions. In order to allow informed and transparent decisionmaking in spatial planning programs, however, balancing the social aspects of urbanization and environmental factors (Grêt-Regamey et al., 2017), not only must the state of soils with regard to their functions be made available, but information on the reliability of the soil function maps is also required. Information on the accuracy of soil function maps facilitates decision-making for environmental policy, and increases confidence among stakeholders, thereby helping to avoid poorly informed policy decisions with significant longterm environmental and social consequences (Maxim and van der Sluijs, 2011). At the same time, providing information on the uncertainty of soil function maps might delay decisions (Höllermann and Evers, 2017) or lead to discussions and negotiations in the spatial planning process (Taylor et al., 2015). Nevertheless, the demand for soil information is considerable and stakeholders require not only the state of the soil in terms of soil quality, but also any indication of uncerSOIL, 4, 123–139, 2018
L. Greiner et al.: Uncertainty indication in soil function maps
tainties associated with the soil information (Campbell et al., 2017). Various sources of uncertainty can lead to spatially heterogeneous degrees of reliability in soil function maps. In general, the following types of uncertainties can be distinguished in assessing and mapping soil functions (Keller et al., 2002): (i) model uncertainty that might arise from incomplete or incorrect methodological approaches and incomplete process descriptions, (ii) informational uncertainty of input data and model parameters, and (iii) temporal and spatial variation of soil properties. In the case of SFA, informational uncertainties in input data may result for instance from processing soil legacy data (Nussbaum et al., 2018), prediction of soil properties using digital soil mapping approaches (DSM; e.g., Nussbaum et al., 2018; Sanchez et al., 2009; Vaysse and Lagacherie, 2015), or the application of pedotransfer functions (PTFs; Schaap, 2004; Chirico et al., 2010) to deduce soil parameters from other soil properties. We distinguish two SFA approaches that differ in their levels of complexity (Greiner et al., 2017). The static approach uses simplified empirical methods to assess the capacity of a soil to fulfill a specific function, neglecting the impacts of land use and land management practices. The static approach is particularly suitable for land use planning to support the sustainable use of soil resources (Lehmann and Stahr, 2010). The dynamic approach takes into account soil processes and site-specific environmental factors, as well as land use and land management practices. Dynamic models exist for nutrient and water cycling, carbon sequestration, crop production, and other soil sub-functions (Vereecken et al., 2016). The use of dynamic soil models is both data-demanding and timeconsuming, but it is a powerful means of modeling the impacts of past and future land use and land management practices on soil functions. The assessment of uncertainties in environmental (dynamic) modeling has been demonstrated in numerous studies (Brown et al., 2005; Krayer von Krauss et al., 2005; Heuvelink et al., 2007, 2010; Lesschen et al., 2007; Bastin et al., 2013) and various frameworks have been proposed to take into account sources of uncertainty (Heuvelink et al., 2007; Bastin et al., 2013). Also, uncertainties associated with the spatial prediction of soil properties using DSM approaches are usually quantified (FAO, 2017). In contrast, uncertainties in the assessment of soil functions and rating of soils according to their function fulfillment have hardly been accounted for at all. In this study, we propagate prediction uncertainties in soil properties (informational uncertainty) through 10 static SFAs for a case study area in the Swiss Plateau. The SFA methods used are presented in Greiner et al. (2017) and are chosen to reveal the breadth of multi-functionality of soils. For SFA, we used soil property maps generated by Nussbaum et al. (2017). They used a DSM approach that exploits soil legacy data, which has the advantage that the prediction intervals for soil properties are provided. While the study of Nussbaum et al. (2017) focused on the spatial prediction of www.soil-journal.net/4/123/2018/
L. Greiner et al.: Uncertainty indication in soil function maps
125
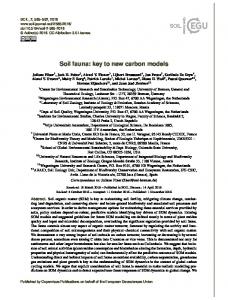
Figure 1. Study area in the Swiss Plateau, 672489–715769 X, 228156–259960 Y , GCS_CH1903 (orthophoto study area: SWISSIMAGE
2005, ©swisstopo. Administrative boundaries Europe: NUTS 2010, ©EuroGeographics).
soil properties, the present study aimed at the assessment of soil functions. The objectives of this paper were to propagate soil property predictions through static SFA, in order to (1) indicate how accurate the SFA results are in response to informational uncertainty and spatial variation of soil properties as quantified by the DSM approach, and (2) to gauge how sensitive the SFA methods are to predictive distribution in soil properties. 2 2.1
Materials and methods Study area
Our study area is located in the Swiss Plateau in the Canton of Zurich around Greifensee, see Fig. 1. The region is dominated by urban areas and agricultural land (crop production, mixed, and dairy farming). We only assessed soils in use for agriculture. Urban areas, forest, wetlands, parks, and city gardens are excluded from this study, resulting in a total study area of 170 km2 . Chromic, Calcaric, and Eutric Cambisols (63 % of study area), Stagnic, Reductigleyic, and Calcaric Gleysols (20 % of study area), Haptic Luvisols (11 % of study area), Hemic and Drainic Histosols, and Calcaric and Eutric Fluvisols or Regosols, have developed in a variable geology, but in general on molasse or moraine. The region lies at about 390–840 m above sea level, and the growing season is approximately 190 days per year. Slopes greater than 35 % can only be found alongside moraines, otherwise the slopes are between 10 and 15 % (Jäggli et al., 1998). The shape of www.soil-journal.net/4/123/2018/
the study area is formed by administrative boundaries in the southeast and otherwise by APEX spectroscopy flight bands (www.seon.uzh.ch, last access: 4 May 2018). More details on the region, its soils, and its extent are provided in Jäggli et al. (1998) and Nussbaum et al. (2017). 2.2
Soil function assessment
We assessed regulation, habitat, and production functions for 10 soil (sub)-functions (Table 1) as proposed in a previous review by Greiner et al. (2017). Each SFA method addresses a certain domain of the soils multi-functionality depicting a specific assessment criterion, e.g., the nutrient storage capacity of soils for the nutrient cycle. The SFA methods require data on soil properties and PTFs, as well as other environmental data (Table 1). 2.2.1
Regulation functions
We assessed the regulation of the water cycle (R-water) following the method proposed by (Danner et al., 2003), which combines the water storage capacity (WSC in mm m−2 ) of soils with their saturated hydraulic conductivity (SHC in cm day−1 ) for a reference soil depth down to 1 m. The nutrient storage capacity (NSC in molc m−2 ) of soil is one of its most important parameters, determining the nutrient cycle (R-nutric). We calculated the NSC according to (Lehmann et al., 2013), multiplying the fine earth fraction (mass of clay and silt) and the amount of soil organic matter for each soil SOIL, 4, 123–139, 2018
L. Greiner et al.: Uncertainty indication in soil function maps 126
Water cycle
water infiltration (cm day−1 ) and storage capacity (mm m−2 ) combined in semiquantitative look-up table Lehmann et al. (2013)
Danner et al. (2003)
Source of method
Nutrient cycle
nutrient storage capacity of fine earth down to 1 m soil depth (molc m−2 ) Jäggli et al. (1998)
x
x
SPm
x
x
x
x
x
x
x
x
x
x
WHa
x
x
Depth
x
Silt
x
pH
SPd
x
x
x
x
x
x
x
x
x
x
x
x
x
x
SCa
x
x
x
DCa BD, AWC, CECpot, S value
BD
BD
BD, CECeff
BD, SHC, AWC, AAC
PTFc
properties organic compounds, mean annual temperature and evaportranspiration, climate
slope, geology, climate
slope, geology, climate
Other environmental data
2
2
1
2
R-ocont
R-icont
R-nutril
R-nutric
R-water
Acronym
2
Type of methodd
Table 1. The 10 assessed soil sub-functions for the case study area, their assessment criteria and required input data. For the uncertainty assessment soil properties were treated as fixed (SPm ) or as random variables (SPd ).
Assessment criterion
Nutrient losses
retention capacity against nutrient losses, e.g., nitrate (semiquantitative look-up tables) DVWK (1988)
SOMa,b
Soil function
Soil (sub-)function
Heavy metals
sorption capacity for inorganic pollutants (semi-quantitative look-up tables)
Litz (1998)
Regulation function
Organic compounds
retention capacity for organic contaminants against percolation into ground water (semiquantitative look-up tables)
www.soil-journal.net/4/123/2018/
SOIL, 4, 123–139, 2018
Clay
www.soil-journal.net/4/123/2018/
Amount of organic matter pool in soil (C storage; kg C m−2 )
Carbon cycle
soils providing niches for plant species, with very dry, wet, or low nutrient properties (assessed by available water capacity in mm, presence of hydromorphic horizon and effective cation exchange capacity in cmolc kg−1 )
amount of microbial biomass (mg kg−1 dried soil)
Plants
Microorganisms
Habitat function
buffering and binding capacity for acids and contaminants assessed by soil organic matter content (in kg m−2 , clay content (in kg m−2 ) and maximum pH in assessment depth combined in a semi-quantitative look-up table
Acids and contaminants
Soil (sub-)function
Assessment criterion
Greiner et al. (unpublished data)
Siemer et al. (2014)
Greiner et al. (unpublished data)
Bechler and Toth (2010)
Source of method Clay x
x
x
SOMa,b x
x
x
x
x
x
SCa
SPd
pH x
x
x
Silt x
x
SPm
x
x
x
x
Depth
Soil function
x
x
WHa
Table 1. Continued.
MB
BD, AWC
BD
BD
PTFc
land use
Other environmental data
1
2
1
2
Type of methodd
H-microorg
H-plant
R-carbon
R-acid
Acronym
L. Greiner et al.: Uncertainty indication in soil function maps 127
SOIL, 4, 123–139, 2018
DCa
128
L. Greiner et al.: Uncertainty indication in soil function maps
Assessment criterion Source of method
Jäggli et al. (1998) x x
pH
x
Silt
x
Depth
x
WHa
x
DCa
SPm
x
SCa
SPd
x
SOMa,b
BD
PTFc
Relief, slope, climate
Other environmental data
2
Type of methodd
P-agri
Acronym
SOIL, 4, 123–139, 2018
Table 1. Continued.
Soil function
Soil (sub-)function
Production function
Agricultural production suitability for agricultural production (semiquantitative look up tables)
a SOM: soil organic matter, SC: stone content, WH: presence or absence of waterlogged horizons, DC: drainage class. b SOM for 50–100 cm depth: SP . m c AAC: available air capacity in mm, AWC: available water capacity, BD: bulk density, CECpot and CECeff: potential and effective cation exchange capacity, MB: microbial biomass, SHC: saturated hydraulic conductivity, S value: amount of exchangeably bound basic cations.
d type 1: SFA method consists of empirical equations or PTFs, type 2: SFA method consists of look-up tables.
Clay
layer with its effective cation exchange capacity (CECeff ) down to a soil depth of 1 m. The method proposed by (Jäggli et al., 1998) evaluates the capacity of soils to prevent the loss of soil nutrients by runoff and percolation to ground and surface water (R-nutril). The SFA method takes into account basic soil properties, the hydromorphic properties of soils (waterlogging), and environmental site conditions. The capacity of the soil to filter and buffer trace metals (R-icont) were assessed for cadmium, copper, and zinc using a method developed by the German Association of Water, Wastewater and Waste (DVWK, 1988). to prevent groundwater pollution by trace elements. The SFA method evaluates the filtering capacity of topsoils (0–30 cm) to retain trace metal cations based on sorption sites of organic matter, clay minerals, and sesquioxides in conjunction with soil pH and redox potential (DVWK, 1988). In general, agricultural soils receive fertilizers, e.g., mineral fertilizers, animal manure, compost, and waste-derived fertilizers (as well as pesticides), which contain nutrients but also impurities or by-products such as trace metals. While copper and zinc mainly stem from animal manure, mineral phosphorus fertilizers might contain remarkable amounts of cadmium (Keller and Schulin, 2003; Six and Smolders, 2014; Jensen et al., 2016). The regulation of organic compounds (R-ocont) is assessed using the method of Litz (1998) for four frequently used herbicides in Switzerland: glyphosate, pendimethalin, metamitron, and isoproturon (Franzen et al., 2017). The SFA method assesses the potential sorption and fixation of an organic compound on clay and organic material (binding) and the potential biological activity of a soil to decompose an organic compound (decomposition). In a second step, both assessment criteria are combined to evaluate the retention potential of a soil for a specific chemical compound (retention). To account for the ability of soils to buffer acids (R-acid), we applied the SFA method proposed by (Bechler and Toth, 2010). The method takes into account the amount of clay and organic matter down to a soil depth of 1 m, and soil pH. To address the role of soils in the carbon cycle (R-carbon) we simply calculated the soil carbon stock to 1 m depth. 2.2.2
Habitat and production functions
We used the method proposed by Siemer et al. (2014) to assess the capacity of soils to provide niches for rare plant species (H-plant). The method attributes this capacity to provide niches for rare plant species to sites with extreme soil properties and shallow soils that lead to relatively dry or wet soil conditions or low nutrients. As an indicator of the habitat function we estimate soil biological activity based on empirical regression functions to estimate microbial biomass in grassland and arable soils (H-microorg; Oberholzer and Scheid, 2007). These PTFs were derived by Oberholzer and Scheid (2007) for hundreds of grassland and arable sites across Switzerland.
www.soil-journal.net/4/123/2018/
L. Greiner et al.: Uncertainty indication in soil function maps
We assessed the agricultural production function (P-agri) using the method of Jäggli et al. (1998). This SFA method combines basic soil properties, climate data (climate suitability classes depending on temperature, precipitation, and length of growing period; BLW, 2012), and site conditions (slope, topography) to classify soils into 10 classes according to their suitability for crop growth. The results of SFA methods are usually given in physical or chemical units and transformed to an ordinal scale, i.e., an SFF score, to facilitate the communication of multifunctionality to stakeholders. In agreement with other studies assessing soil functions (e.g., Lehmann and Stahr, 2010; Miller, 2012; Haslmayr et al., 2016), we applied an ordinal scale with five levels. We adapted the ordinal scale for each SFA method to the range of SFA results obtained from about 100 well-documented soil monitoring sites across Switzerland (Gubler et al., 2015). Thus, the ordinal scale in this study represents a rating of soils capacity to function in relation to a bandwidth of Swiss soils. The five levels of the ordinal scale were SFF score = 1 (very low/very poor), SFF = 2 (low/poor), SFF = 3 (medium), SFF = 4 (high/rich), and SFF = 5 (= very high/very rich). 2.3
Soil property maps and other data
Nussbaum et al. (2017) generated soil property maps using digital soil mapping (DSM) approaches for the case study area with a spatial resolution of 20 m raster cells. This resulted in a total of about 450 000 raster cells for the agricultural soils. In the DSM approach Nussbaum et al. (2017) used a new boosted geoadditive modeling framework (geoGAM) in which they modeled nonlinear relationships and selected parsimonious models from a large number of covariates. Table 2 presents summary statistics of the modeled soil properties in our case study for the four soil layers that were distinguished. The accuracy of the predictions, validated using independent data, was similar to other DSM studies. Independent models were fitted for each soil property and each soil depth (Nussbaum et al., 2017). To predict soil properties, harmonized soil legacy data from about 4000 soil profiles (Walthert et al., 2016) that were investigated during a 1 : 5000 soil mapping survey between 1988 and 1997 in the Canton of Zurich (Jäggli et al., 1998) were used under a non-public data license. Details are described in publications by Nussbaum et al. (2017, 2018). While these publications purely focused on the prediction of soil properties and the choice of DSM approaches, our study aimed at the assessment of soil functions based on this soil property data. In order to apply the SFA methods, PTFs suitable for diverse soil parameters are required (see Table 1). To estimate soil bulk density we used the PTF of Nussbaum and Papritz (2015), and for the cation exchange capacity we used the PTF of Gerber (2014). Both PTFs were developed for Swiss soils based on soil legacy data. Available water capacity (AWC) and other soil hydraulic properties were eswww.soil-journal.net/4/123/2018/
129
timated using the German soil mapping guidelines (KA5, 2005). Other environmental data such as slope, relief, climate, geology, geomorphology, properties of organic compounds, and land use were gathered from available databases (BFS, 2010; BLW, 2012; HADES, 2017; PPDB, 2017; Swisstopo, 2008, 2014). 2.4
Indication of uncertainty in mapping soil functions
In this study, we propagated uncertainties for four basic soil properties, i.e., clay content, soil organic matter (SOM), pH, and stone content, through the calculation of the 10 static SFA methods. These four soil properties were treated in the calculations as random variables for each raster cell and soil depths 0–10, 10–30, 30–50, and 50–100 cm (Table 2). For the soil depth of 50–100 cm, SOM was treated as a fixed input variable (SPm ) because its predictive performance was too low (Nussbaum et al., 2017). For SOM at this depth we used the median of the available soil data (n = 418). The probability distributions of these soil properties (SPd ) were derived from the DSM approach mentioned above, performing 1000 simulations for each raster cell and soil depth (Nussbaum et al., 2017). For the calculation of the SFA we drew an independent set of the four SPd values (drawn and replaced) N = 1000 times, and compared range, mean, and variance of the generated SPd set with the original distributions of the four soil properties predicted using the DSM approach. We restricted the number of random variables to these four soil properties due to the required computation time for such a large number of raster cells (n = 4 × 10⁵ ) with four soil depths. Therefore, for other soil properties such as silt content, soil depth, the presence or absence of waterlogged horizons, and drainage class, the mean of the DSM simulations was used (SPm ; Tables 1–2). The presence of waterlogged soil horizons in the top soil layer (0–30 cm) was found for about 13 % of the case study area, for the 0–50 cm soil depth the figure was 27 %, and for the depth 0–100 cm, it was 40 % of the area. We assumed there was no waterlogging for the 0–10 cm depth because this was rarely observed in the data. About 74 % of the agricultural soils were well drained (drainage class 1), 11 % were moderately well drained (class 2), and 15 % were poorly drained (class 3) (Nussbaum et al., 2017). For the error propagation and the analysis of the uncertainty assessment results we distinguish two different types of SFA methods depending on how the chosen random variables are taken into account in the calculation of the SFA methods. In cases where the SFA method consists of empirical equations (e.g., regression functions) or continuous PTFs, the variation of each soil property with probability distribution, SPd , is fully propagated through this type 1 (equation). In our study this is the case for methods assessing regulation of nutrient cycle, carbon cycle, and habitat for microorganisms (R-nutric, R-carbon, and H-microorg). SFA methods assessing soil regulation of water cycle, nutrient losses, SOIL, 4, 123–139, 2018
130
L. Greiner et al.: Uncertainty indication in soil function maps
Table 2. Summary statistics of modeled soil properties generated by the DSM approach by Nussbaum et al. (2017) for the Greifensee study
area. Soil property
SPd
Mean
SD
(in cm)
Q0.1
Q0.5
Q0.9
Q0.1
Q0.5
Q0.9
0–10 10–30 30–50 50–100
19.4 20.4 20.4 18.9
24.3 25.6 25.4 24.7
29.4 31.2 31.2 30.3
5.5 5.5 6.6 7.3
5.7 5.7 6.8 7.5
5.8 5.8 7.0 7.7
0–10 10–30 30–50
4.4 4.3 1.7
5.8 5.8 5.9
8.2 8.5 10.7
1.7 1.9 6.7
2.2 2.5 15.5
3.1 3.7 22.2
Stone content (%)
0–10 10–30 30–50 50–100
3.1 3.4 4.0 5.4
7.6 8.3 9.9 12.6
12.6 13.7 18.1 21.2
3.5 3.7 4.6 6.4
5.8 6.0 7.7 10.2
7.5 7.9 10.5 13.5
pH
0–10 10–30 30–50 50–100
6.2 6.1 6.1 6.2
6.5 6.5 6.5 6.6
7.0 6.9 7.0 7.0
0.5 0.5 0.6 0.6
0.5 0.5 0.6 0.6
0.5 0.5 0.6 0.6
Soil organic matter (%)
50–100
1.0
0
Silt (%)
0–10 10–30 30–50 50–100
34.8 35.5 32.9 33.6
2.2 2.3 3 3.1
–
70.1
14.6
Clay (%)
Soil organic matter (%)
SPm
Depths
Soil depth (cm)
acidification, inorganic contaminants, habitat for plants, and agricultural production function (R-water, R-nutril, R-acid, R-icont, H-plant, and P-agri) are partly based on look-up tables using a classification of soil properties in the calculation, including PTFs that classify the estimation of secondary soil properties such as available water capacity (type 2 look-up tables). In particular, the method assessing soil regulation of organic contaminants (R-ocont) classifies soil properties at the very beginning and groups the calculation of the retention of organic compounds in soils according to this classification. We computed (a) two measures of uncertainty for SFF scores, (b) two types of maps visualizing uncertainties, and (c) two measures for overall uncertainty per soil sub-function in our study area and show (d) uncertainties of SFF scores per soil sub-function in detail. a. As a measure of uncertainty of the SFF scores for the 10 SFA methods, we computed the interquartile range (IQR) for each raster cell, i.e., the difference between the 75 and 25 % percentiles, and the ratio of IQR to the median as an approximation of the coefficient of variation for the ordinal-scaled SFF scores.
b. In order to visualize the uncertainty of the SFF scores in the soil function maps we generated two different map types. We visualized the uncertainty of the SFF scores resulting from the uncertainty of the four SPd values with the aim of facilitating communication in the decisionmaking process, and computed the probabilities of < 10, 10–30, and > 30 % that the SFF score of a raster cell might deviate from the mean SFF score (only SPm used for SFA) for ±1 or ±2 or more SFF categories. In this way, stakeholders might gain an overview of the areas of the case study area for which the SFF scores of individual soil sub-functions have more or less confidence, expressed on the ordinal scale. The other type of maps allow visualization of SFF scores in a raster cell only where ≥ 90 % of the 1000 simulated SFF scores were equal (C90); i.e., ≥ 90 % of the simulated SFF scores revealed no variation indicating high reliability of the results, whereas raster cells that do not meet this criteria are displayed as empty cells on the map. Additionally, 5 and 95 % percentiles are displayed. c. As a measure of the overall uncertainty of a soil function, we calculated the median absolute devia-
SOIL, 4, 123–139, 2018
www.soil-journal.net/4/123/2018/
L. Greiner et al.: Uncertainty indication in soil function maps
tion (MAD) for each raster cell and took the average of the MAD for all raster cells (MMAD). d. Finally, for more detailed analysis of the resulting uncertainty in the SFF scores for each assessed soil function, we computed the cumulative distribution functions (cdfs) of the SFF scores including the mean of the deviations from the mean SFF score of a raster cell (MDM) for the 1000 simulations. The MDM was calculated separately for (a) all simulations that were larger or (b) smaller than the mean SFF score. 3 3.1
Results and discussion Mapping uncertainty of soil sub-functions
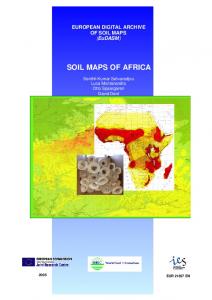
Mapping the 10 soil sub-functions for the study area revealed pronounced spatial patterns, with a high variability of SFF scores across the region, linked to the inherent properties of the soils, terrain attributes, and climate conditions. The propagated uncertainties of soil properties SPd as produced by the SFA methods generally led to substantial uncertainty in the mapped soil sub-functions, though to a different extent for individual soil sub-functions and for subregions. Figure 2 presents the mean SFF scores for three selected soil subfunctions and the associated uncertainties; the same maps for the other soil sub-functions can be found in the Supplement. Figure 3 provides a general overview of the range of the SFF scores for the 10 mapped soil sub-functions and their uncertainties. For instance, the regulation function for water (R-water) is in general higher for arable soils in the northeastern part of the case study area, but is also associated with larger uncertainties. The water storage capacity (WSC) in our study area ranges between 44 and 270 mm (10–90 % quantile, median: 204 mm) and the saturated hydraulic conductivity (SHC) ranges between 17 and 183 cm day−1 (median: 32 cm day−1 ). The probability maps indicate that in the northeastern part, 30 % or more of the N = 1000 simulations did not receive a “very high” SFF score, but scored one or two SFF categories lower, i.e., high or medium (Fig. 2). Furthermore, the soils between lakes Greifensee and Zurich in the western part of the region with predominantly medium and low SFF scores were quite sensitive to uncertainties in soil properties. For the majority of soils in this sub-area there is a relatively high probability that the mean SFF score for R-water might deviate by ±1 SFF category/class. As expected, the calculation of the soil carbon pools was very sensitive to uncertainty in soil organic matter and stone content data (Fig. 2, R-carbon). Carbon pools in agricultural soils are very heterogeneous across the case study area, with low SFF scores mainly in the northern part (< 10 kg m−2 ), with medium (13–15 kg m−2 ) and high SFF scores (15– 21 kg m−2 ) in the southern part of the region. Mapping the associated uncertainty of soil carbon pools on an ordinal www.soil-journal.net/4/123/2018/
131
scale indicated, across almost the whole case study area, high probabilities that the SFF scores might deviate for ±1 or even ±2 SFF categories. In contrast, the agricultural soils of the case study area showed high nutrient storage capacities throughout the region (Fig. 2, R-nutric) and therefore SFF scores of R-nutric were not that sensitive to the propagation of uncertainties of SPd through this SFA method. Only in the northeastern area did we observe some probabilities that SFF scores for R-nutric might be one SFF category lower. Overall, the uncertainty of individual soil function maps showed diverse spatial patterns. Mapping their uncertainty in the ordinal scale, as proposed in Fig. 2, may increase the common understanding of spatially heterogenic uncertainties in SFF in decision-making in spatial planning programs. Uncertainty indication adds information on reliability of the soil function maps used to communicate the value of soils to spatial planners and other disciplines (Sanchez et al., 2009; Haslmayr et al., 2016), thus allowing for more confidence in land use decisions. Moreover, revealing the reliability of soil function maps might support efforts to strengthen the link between soil functions and ecosystem services. This link is important, as ecosystem services are a means of connecting soil functions to the demands and needs of stakeholders to find the crucial balance in land use planning between economic, social, and environmental interests (e.g., Bouma, 2014; Valujeva et al., 2016; Grêt-Regamey et al., 2017). The responses of the SFF scores for the assessed soil subfunctions to uncertainty in the four simulated soil properties depend not only on the SFA method and its ordinal assessment scale. In agreement with the very high nutrient storage capacity of the soils, the basic soil properties of the grassland and arable soils are in a range that provides high and very high retention of trace metals (R-icont) as well, while the retention of organic chemical compounds in soil (R-ocont) is very low throughout the region (Fig. 3) according to the assessment scale proposed in this SFA method (Litz, 1998). Accordingly, the SFF scores for R-nutril, R-icont, and Rocont are relatively insensitive to uncertainty in soil properties, and the overall coefficient of variation is very small for these soil sub-functions. The highest overall coefficient of variation was found for R-carbon and H-microorg, followed by R-acid and R-water (Fig. 3). These results raise a question about the appropriate classification of SFA results from physical or chemical units into an ordinal assessment scale, and the adaption of such a classification for individual soil sub-functions according to the range of soil properties for the case study area of interest or according to national references. Only where the SFF scores on the ordinal scale of a certain soil function show substantial spatial variation can the influence of uncertain soil properties on the SFA results be investigated. In this regard, H-plant is a special case for the assessment of uncertainties because the outcome of this SFA method is a binomial variable, i.e., it indicates whether the soil provides niches conditions for rare plant populations or not. The SOIL, 4, 123–139, 2018
132
L. Greiner et al.: Uncertainty indication in soil function maps
Figure 2. Selected soil function maps for the agricultural land of the case study area and indication of their uncertainties in the ordinal scale:
(a) mean SFF scores and (b) probability that the mean SFF score of a raster cell deviates in the ordinal scale for ±1 or (c) ±2 or more SFF categories/classes (raster cells 20 × 20 m2 , N = 1000 simulations).
simple SFA revealed that 14 % of the soils in the case study area are suitable for providing niches for rare plants in terms of wet or dry soil conditions, low nutrient availability, and shallow soils. Such extreme soil conditions are mainly determined by soil depth, soil hydromorphic features, and other soil properties, and only to some degree by the uncertainty of the considered soil properties SPd . Therefore, for proper uncertainty assessment of the SFA method H-plant, not only must the four soil properties be taken into account, but the
SOIL, 4, 123–139, 2018
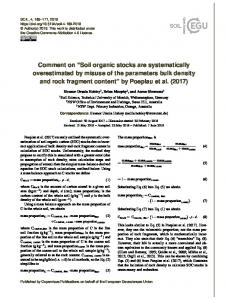
uncertainty of the aforementioned variables should also be considered. In addition to the uncertainty maps described above, we generated supplemental information on the uncertainty of soil function maps addressing a given quality assurance criterion (Fig. 4). We defined the C90 criteria as follows: the mean SFF scores for raster cells are displayed if at least 90 % of the SFF score simulations result in the same SFF category; otherwise the study area is shown as a grey area. In this way,
www.soil-journal.net/4/123/2018/
L. Greiner et al.: Uncertainty indication in soil function maps
133
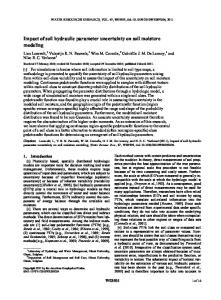
Figure 3. General overview of the resulting range of SFF scores for the 10 mapped soil sub-functions (a), and of their coefficient of variation
(b) expressed as the ratio of the interquartile range (IQR) and the median of the SFF scores for each raster cell. Circles with dots indicate the median coefficient of variation of the SFF scores across the case study area.
stakeholders can easily gain an overview of those areas for which the soil function maps are reasonably reliable. Figure 4 illustrates such supplemental maps and the visual effect of the C90 criteria for three SFA methods with high (Rnutril), medium (R-icont), and low reliability (H-microorg). Independent of the SFF scores, the number of raster cells displayed decreases for these three soil sub-functions, in the same order. In sum, the uncertainty analysis shows that Rnutril and R-nutric fulfill the C90 criteria for most of the assessed agricultural area (85–90 %); P-agri, R-water, R-icont, R-ocont fulfill them for about 41–51 %; R-acid, H-microorg and R-carbon apply for less than 5 % of the case study area. Accordingly, the average MAD of the SFF scores across the whole region increases noticeably for these three groups in the same order: < 0.01 for the first group, 0.01–0.07 for the second, and 0.43–0.88 for the third group. For the last group, the range of SFF scores (5 and 95 % percentiles for each raster cell) in terms of SFF categories varies for large areas from very low to very high, as illustrated for instance for Hmicroorg in the northeastern part of the region (see Fig. 4). 3.2
Cumulative distribution functions of SFF scores
Cumulative distribution functions (cdfs) of the SFF scores for all raster cells provided deeper insight into the sensitivity of the SFA methods related to the uncertainty of the basic soil properties SPd with regard to the uncertainty for each SFF categories/classes for each soil function. In general, we observed two different patterns in the cdfs of the SFF scores for type 1 (equation) and type 2 (look-up table) SFA methods (Figs. 5 and 7).
www.soil-journal.net/4/123/2018/
For type 1 SFA methods the uncertainty in the soil properties can be propagated entirely through regression functions and deterministic equations, and cdfs of the corresponding SFF scores indicate a smooth pattern of mean SFF scores and their uncertainties from very low to very high SFF scores (Fig. 5). In contrast, depending on the classification of soil properties in the look-up tables used in type 2 SFA methods, the cdf for R-nutril and P-agri show pronounced (and for P-water and P-acid less pronounced) step functions for the mean SFF scores. Both of the first two SFA methods combine information on soils and environmental site conditions (e.g., geology, drainage systems, slope, altitude, and climate) using various comprehensive look-up tables, leading to strong differentiation of the final SFF scores for distinct ranges of soil properties. Therefore, the outcomes of these SFA methods for a given region is not straightforward. For example, R-nutril combines texture, stone and soil organic matter content, bulk density, soil depth, drainage class, and environmental conditions as input data in various lookup tables. Thus, other input parameters including soil properties might also determine the main outcome of R-nutril for certain SFF categories/classes. For R-nutril and P-agri, soil depth and drainage class showed strong differentiation between SFF classes. Figure 6 indicates that the SFF scores for R-nutril are only sensitive to some degree to the uncertainty in the soil properties SPd for high and very high SFF categories/classes, while for other SFF categories other environmental data are dominant. Interestingly, we observe that certain SFF categories of the type 2 SFA methods are more or less sensitive to the propagated uncertainty of soil properties SPd (Fig. 6). This different response in the uncertainty of the SFF scores for the type 2 SFA methods was a priori unexpected and highSOIL, 4, 123–139, 2018
134
L. Greiner et al.: Uncertainty indication in soil function maps
Figure 4. Uncertainty indication for soil function maps of R-nutril, R-icont, and H-microorg: (a) only mean SFF scores for raster cells are
displayed if at least 90 % of the N = 1000 simulations per raster cell revealed the same SFF score (first column). In addition, the range of SFF scores for each raster cell is shown: (b) 5 and (c) 95 % percentiles of SFF scores, respectively (SFF, soil function fulfillment, in grey; not C90 or no assessment in light grey; lakes, “Arealstatisik” 2009, 72 classes, ©BFS 2010, GEOSTAT).
lights the importance of such an uncertainty analysis of static SFA methods. The analysis provides insight in terms of those SFF categories for which uncertainty in soil property data plays an important role. For soils with low suitability for food production the range of soil properties is not important (see Fig. 6) given that waterlogging or soil depth might be the dominant factors. However, for soils with medium and high
SOIL, 4, 123–139, 2018
suitability the range of soil organic matter, clay and stone content, and soil pH are decisive. In line with the analysis of the uncertainty maps discussed above, relatively large uncertainty was found for all raster cells for R-carbon and H-microorg (Fig. 5). The SFA method H-microorg, for example, links microbial biomass for grassland and arable land use to soil organic matter, pH, and clay content through a PTF, and is therefore very sensitive
www.soil-journal.net/4/123/2018/
L. Greiner et al.: Uncertainty indication in soil function maps
135
Figure 5. Cumulative distribution function (cdf) of SFF scores for
type 1 (equation) for R-carbon and H-microorg for agricultural soils of the case study area and the uncertainty resulting from four basic soil properties. SFF score: 1 (very low) to 5 (very high); black: mean SFF score per raster cell; grey: range ±MDM per raster cell, number of raster cells is about 450 000; total area = 170 km2 .
to changes in soil properties. For R-water and P-agri for medium to very high SFF categories the uncertainty in the soil properties SPd also leads to SFF scores of rather lower confidence. Consequently, the analysis suggests on a specific level that further measurements of basic soil properties are required in the case study area to reduce the uncertainty in the spatial prediction of soil properties obtained from the DSM approach used by Nussbaum et al. (2017). Moreover, our analysis clearly indicates that SFA results are not comparable between type 1 and type 2 methods and among type 2 methods in view of uncertainty indication. One of the core aspects of the soil function concept is to assess soil multifunctionality and its effects on humans and the environment in general, and to support land use decisions (e.g., Haygarth and Ritz, 2009; Schulte et al., 2014). However, soil sub-functions are not directly comparable. The valuation of soil is more straightforward and transparent for stakeholders using SFF scores. The comparability of SFA results at the ordinal scale allows to deliberate on the importance of soil functions. Deliberation is seen as a promising tool to value environmental goods or services (Vatn, 2009). Soil function maps including uncertainty indications can also be used in multi-criteria decision analysis (MCDA), for instance in spatial planning programs (Grêt-Regamey et al., 2017). www.soil-journal.net/4/123/2018/
Figure 6. Cumulative distribution function (cdf) of SFF scores for
type 2 (look-up table) for R-water, R-nutril, R-acid, and P-agri for agricultural soils of the case study area and the uncertainty resulting from four basic soil properties. SFF score: 1 (very low) to 5 (very high); black: mean SFF score per raster cell; grey: range ±MDM per raster cell, number of raster cells for these soil sub-functions ranged between 420 000 and 445 000; total area = 170 km2 .
SOIL, 4, 123–139, 2018
136 3.3
L. Greiner et al.: Uncertainty indication in soil function maps Thoughts on uncertainty indication
Uncertainty is usually expressed as a probability of a state or an event, and can be presented numerically, verbally, or graphically (IOM, 2013). Its presentation must fit the needs of the audience, the circumstances, and the purpose (IOM, 2013). We argue that the easiest way to interpret and the most suitable way of communicating (un-)certainties to actors in land use decisions is in the form of maps because this enables the visualization of spatial variability. Clearly, for a general overview of the study area, insight into method behavior or comparisons between soil function, and information in the form of a table or a plot may also be suitable. In this study, we present readily communicable uncertainty indications for soil function maps. There are many other possibilities as well, of course, including statistically advanced methods to display (un)certainties in soil function maps. Rather than providing statistical measures, however, we advocate provision of simple uncertainty maps such as those illustrated in Figs. 3 and 5 as a means of facilitating the communication of uncertainties with stakeholders who may not be familiar with soil science and the contribution of soils to ecosystem services. Experience of communicating uncertainty in the context of climate (Budescu, 2016) has shown that the use of simple phrases such as “very likely” combined with a numerical score (e.g., > 90 %) are of most value because stakeholders understand this kind of message best. Communication of uncertainty through phrases has the advantage of capturing stakeholders’ attention, although it is also somewhat open to individual interpretation in different contexts. According to (IOM, 2013), although graphic indications can “capture and hold people’s attention”, the interpretation may vary among individuals. A correspondent option to evaluate in the future would be to communicate a general phrase about the uncertainty of a soil function map, combined with a map that shows the details of the spatial variation of the uncertainty. Depending on the method used, uncertainties in soil information input in SFA may be more or less disclosed or obvious, and with this in mind the question itself is then what degree of uncertainty in data input in SFA should be transported through the SFA to match the needs of decisionmakers in spatial planning processes. The optimal degree of uncertainty indication depends on the stakeholders involved in decision-making and the kind of decisions. The mindsets of the actors involved influence how the decision can be improved by good quality soil function maps, including uncertainty indications. Time and resources for decision-making may vary and require a variable quality of information. 4
bution of soils to ecosystem services and is appropriate for communicating the importance of soils to spatial planners and professionals of other disciplines. Transparency in mapping soil functions including their uncertainties adds to the quality of spatial information used for decision-making. In this study, we try to foster transparency in two ways. First, we demonstrate how the reliability of soil function maps can be presented to allow for informed and transparent decisions in spatial planning processes, thereby helping to avoid poorly informed policy decisions with regard to available soil resources. We propose two types of maps for the indication of uncertainties in SFA, which supplement each other. We advocate that uncertainties should be made as transparent as possible and be visualized in easily understandable maps. Second, taking into account the uncertainty of basic soil properties, the performed uncertainty analysis for SFA provides deeper insight into the sensitivity of the SFA methods. The cumulative distribution functions for the SFF scores of individual soil functions showed different patterns for SFA methods based on empirical equations and SFA methods using simplified look-up tables. Indeed, soil data availability for the study area was good in comparison to other areas in Switzerland. To achieve the same degree of detail in applying this approach for larger areas without soil sampling could therefore be challenging. In this study, we restricted the uncertainty propagation through the SFA methods to four basic soil properties at four depths, mainly because of computational limitations. Other sources of uncertainty such as informational uncertainty of other soil properties, environmental variables (such as climate data), and the reliability of PTFs should be considered as well. Furthermore, we presume that model uncertainty arising from methodological simplifications might cause substantial uncertainties in SFA, for instance, with regard to simplification of process descriptions, reference assessment depth, or calibration of the ordinal scale. On the other hand, the static SFA approach is in general quite flexible and modular. A general drawback of the SFA approach is that SFA results cannot be validated (Calzolari et al., 2016). Although we used established SFA methods, we still consider further development of applicable SFA methods as a future challenge, in particular methods that link soil biology and soil biodiversity to soil functions.
Data availability. Soil property maps used for SFA were presented
in Nussbaum et al. (2017). The underlying soil data were available under a non-public data license and could not be published.
Conclusions
Decision-making in spatial planning programs should be well informed about the role of soils in society and the environment. Mapping of soil functions underpins the contriSOIL, 4, 123–139, 2018
The Supplement related to this article is available online at https://doi.org/10.5194/soil-4-123-2018-supplement.
www.soil-journal.net/4/123/2018/
L. Greiner et al.: Uncertainty indication in soil function maps Author contributions. MN and AP developed and applied a
DSM approach for our study area and provided soil property maps. LG implemented the soil function assessments and evaluated the results with contributions from MN, AG, and AK, who proposed forms of uncertainty indications in soil function assessments. AK, AP, MN, and SZ contributed to the conceptual and practical matching of soil properties and soil functions. AGR provided insights into spatial planning requirements. LG and AK prepared the manuscript, to which all the co-authors contributed.
Competing interests. The authors declare that they have no con-
flict of interest.
Acknowledgements. This study was part of the “Predictive map-
ping of soil properties for the evaluation of soil functions at regional scale” project (PMSoil; project no. 406840-143096) and the “Matching soil functions and soil uses in space and time for sustainable spatial development and land management” project (OPSOL; project no. 408640-143092), funded by the Swiss National Science Foundation within the framework of the National Research Programme “Sustainable Use of Soil as a Resource” (NRP 68), www.nrp68.ch (last access: 7 May 2018). The Swiss Federal Office of the Environment (FOEN) provided additional funding. Benjamin Seitz supported the translation of soil information in Swiss soil classification to WRB for the description of the study region. Edited by: Giacomo Certini Reviewed by: Willie Towers and one anonymous referee
References Adhikari, K. and Hartemink, A. E.: Linking soils to ecosystem services – A global review, Geoderma, 262, 101–111, https://doi.org/10.1016/j.geoderma.2015.08.009, 2016. Bastin, L., Cornford, D., Jones, R., Heuvelink, G. B. M., Pebesma, E., Stasch, C., Nativi, S., Mazzetti, P., and Williams, M.: Managing uncertainty in integrated environmental modelling: The UncertWeb framework, Environ. Modell. Softw., 39, 116–134, https://doi.org/10.1016/j.envsoft.2012.02.008, 2013. Bechler, K. and Toth, O.: Bewertung von Böden nach ihrer Leistungsfähigkeit, Leitfaden für Planungen und Gestattungsverfahren (LUBW), Karlsruhe, Germany, 36 pp., ISBN: 978-388251-349-3, 2010. BFS: Arealstatistik (AS09_72), Bundesamt für Statistik (BFS), Bern, Switzerland, 2010. BLW: Minimales Geodatenmodell: 77.1 Klimaeignungskarte für die Landwirtschaft, Bundesamt für Landwirtschaft/Federal Office of Agriculture, Bern, Switzerland, 2012. Bouma, J.: Implications of the Knowledge Paradox for Soil Science, in: Advances in Agronomy, edited by: Sparks, D. L., Elsevier, San Diego, USA, 106, 143–171, 2010. Bouma, J.: Soil science contributions towards Sustainable Development Goals and their implementation: linking soil functions with ecosystem services, J. Plant Nutr. Soil Sci., 177, 111–120, https://doi.org/10.1002/jpln.201300646, 2014.
www.soil-journal.net/4/123/2018/
137 Brown, J. D., Heuvelink, G., and Refsgaard, J.: An integrated methodology for recording uncertainties about environmental data, Water Sci. Technol., 52, 153–160, 2005. Budescu, D. V.: Improving communication of uncertainty in the IPCC reports, in Advance paper submitted to the IPCC Expert Meeting on Communication, Oslo, Norway, 9–10 February 2016, p. 3., 2016. Calzolari, C., Ungaro, F., Filippi, N., Guermandi, M., Malucelli, F., Marchi, N., Staffilani, F., and Tarocco, P.: A methodological framework to assess the multiple contributions of soils to ecosystem services delivery at regional scale, Geoderma, 261, 190–203, 2016. Campbell, G. A., Lilly, A., Corstanje, R., Mayr, T. R., and Black, H. I. J.: Are existing soils data meeting the needs of stakeholders in Europe? An analysis of practical use from policy to field, Land Use Policy, 69, 211–223, https://doi.org/10.1016/j.landusepol.2017.09.016, 2017. Chirico, G. B., Medina, H., and Romano, N.: Functional evaluation of PTF prediction uncertainty: An application at hillslope scale, Geoderma, 155, 193–202, https://doi.org/10.1016/J.GEODERMA.2009.06.008, 2010. Danner, C., Henshold, C., Weidenhammer, S., Aussendorf, M., Kraft, M., Weidenbacher, A., and Kölling, C.: Das Schutzgut Boden in der Planung. Bewertung natürlicher Bodenfunktionen und Umsetzung in Planungs- und Genehmigungsverfahren, Bayerisches Geologisches Landesamt, Bayerisches Landesamt für Umweltschutz, 2003. Dominati, E., Patterson, M., and Mackay, A.: A framework for classifying and quantifying the natural capital and ecosystem services of soils, Ecol. Econ., 69, 1858–1868, https://doi.org/10.1016/j.ecolecon.2010.05.002, 2010. Dominati, E., Mackay, A., Green, S., and Patterson, M.: A soil change-based methodology for the quantification and valuation of ecosystem services from agro-ecosystems: A case study of pastoral agriculture in New Zealand, Ecol. Econ., 100, 119–129, https://doi.org/10.1016/j.ecolecon.2014.02.008, 2014. DVWK (Deutscher Verband für Wasserwirtschaft und Kulturbau): Filtereigenschaften des Bodens gegenüber Schadstoffen. Teil I: Beurteilung der Fähigkeit von Böden, zugeführte Schwermetalle zu immobilisieren, Merkblätter zur Wasserwirtschaft, Verlag Paul Parey, Hamburg and Berlin, Germany, 1988. EC: Thematic Strategy for Soil Protection, Commission of the European Communities, Brussels, Belgium, 12 pp., 2006. FAO: Soil organic carbon mapping cookbook, Food and Agriculture Organization of the United Nations, Rome, Italy, available at: http://www.fao.org/3/a-bs901e.pdf (last access: 17 July 2018), 2017. Franzen, J., Müller, M., and Keller, A.: Einsatz von Pflanzenschutzmitteln im Messnetz der Nationalen Bodenbeobachtung (NABO) von 1985 bis 2013, Agroscope, in preparation, 2017. Gerber, C.: Funktionale Bodenbewertung Lyss. Die Erstellung von Bodenfunktionskarten für das Kartenblatt Lyss, University of Bern, Bern, Switzerland, 2014. Greiner, L., Keller, A., Grêt-Regamey, A., and Papritz, A.: Soil function assessment: review of methods for quantifying the contributions of soils to ecosystem services, Land Use Policy, 69, 224–237, https://doi.org/10.1016/j.landusepol.2017.06.025, 2017.
SOIL, 4, 123–139, 2018
138 Grêt-Regamey, A., Altwegg, J., Sirén, E. A., van Strien, M. J., and Weibel, B.: Integrating ecosystem services into spatial planning – A spatial decision support tool, Landscape Urban Plan., 165, 206–219, https://doi.org/10.1016/j.landurbplan.2016.05.003, 2017. Gubler, A., Schwab, P., Wächter, D., Meuli, R., and Keller, A.: Ergebnisse der Nationalen Bodenbeobachtung (NABO) 1985– 2009: Zustand und Veränderungen der anorganischen Schadstoffe und Bodenbegleitparameter, BAFU Umwelt-Zustand 1507, 1–81, 2015. HADES: Hydrologischer Atlas der Schweiz, University of Bern, Bern, Switzerland, 15 May 2017, available at: https://hydromaps. ch/#de/8/46.830/8.193/bl_hds (last access: 7 May 2018), 2017. Haslmayr, H.-P., Geitner, C., Sutor, G., Knoll, A., and Baumgarten, A.: Soil function evaluation in Austria – Development, concepts and examples, Geoderma, 264, 379–387, https://doi.org/10.1016/j.geoderma.2015.09.023, 2016. Haygarth, P. M. and Ritz, K.: The future of soils and land use in the UK: Soil systems for the provision of land-based ecosystem services, Land Use Policy, 26, Supplement S187–S197, https://doi.org/10.1016/j.landusepol.2009.09.016, 2009. Heuvelink, G. B. M., Brown, J. D., and van Loon, E. E.: A probabilistic framework for representing and simulating uncertain environmental variables, Int. J. Geogr. Inf. Sci., 21, 497–513, https://doi.org/10.1080/13658810601063951, 2007. Heuvelink, G. B. M., Burgers, S. L. G. E., Tiktak, A., and Den Berg, F. Van: Uncertainty and stochastic sensitivity analysis of the GeoPEARL pesticide leaching model, Geoderma, 155, 186– 192, https://doi.org/10.1016/j.geoderma.2009.07.004, 2010. Höllermann, B. and Evers, M.: Perception and handling of uncertainties in water management – A study of practitioners’ and scientists’ perspectives on uncertainty in their daily decision-making, Environ. Sci. Policy, 71, 9–18, https://doi.org/10.1016/j.envsci.2017.02.003, 2017. IOM: Environmental Decisions in the Face of Uncertainty, The National Academies Press, Washington D.C., USA, 2013. Jäggli, F., Peyer, K., Pazeller, A., and Schwab, P.: Grundlagenbericht zur Bodenkartierung des Kantons Zürich, Landwirtschaftsareal, Eidgenössische Forschungsanstalt für Agrarökologie und Landbau (FAL), Zurich-Reckenholz, Switzerland, 1998. Jensen, J., Larsen, M. M., and Bak, J.: National monitoring study in Denmark finds increased and critical levels of copper and zinc in arable soils fertilized with pig slurry, Environ. Pollut., 214, 334–340, https://doi.org/10.1016/j.envpol.2016.03.034, 2016. KA5: Bodenkundliche Kartieranleitung, 5. Auflage, Bundesanstalt für Geowissenschaften und Rohstoffe (BGR), Staatliche Geologische Dienste der Bundesrepublik Deutschland, Hannover, Germany, 2005. Keller, A. and Schulin, R.: Modelling regional-scale mass balances of phosphorus, cadmium and zinc fluxes on arable and dairy farms, Eur. J. Agron., 20, 181–198, https://doi.org/10.1016/S1161-0301(03)00075-3, 2003. Keller, A., Abbaspour, K., and Schulin, R.: Assessment of Uncertainty and Risk in Modeling Regional Heavy-Metal Accumulation in Agricultural Soils, J. Environ. Qual., 31, 175–187, 2002. Krayer von Krauss, M., van Asselt, M. B. A., Henze, M., Ravetz, J., and Beck, M. B.: Uncertainty and precaution in environmental management, Water Sci. Technol., 52, 1–9, available at: http://
SOIL, 4, 123–139, 2018
L. Greiner et al.: Uncertainty indication in soil function maps wst.iwaponline.com/content/52/6/1.abstract (last access: 7 May 2018), 2005. Lehmann, A. and Stahr, K.: The potential of soil functions and planner-oriented soil evaluation to achieve sustainable land use, J. Soils Sediments, 10, 1092–1102, https://doi.org/10.1007/s11368-010-0207-5, 2010. Lehmann, A., David, S., and Stahr, K.: Technique for soil evaluation and categorization for natural and anthropogenic soils, Hohenheimer Bodenkundliche Hefte, 86, 232 pp., University of Hohenheim, Stuttgart, Germany (2. Auflage), 2013. Lesschen, J. P., Stoorvogel, J. J., Smaling, E. M. A., Heuvelink, G. B. M., and Veldkamp, A.: A spatially explicit methodology to quantify soil nutrient balances and their uncertainties at the national level, Nutr. Cycl. Agroecosys., 78, 111–131, https://doi.org/10.1007/s10705-006-9078-y, 2007. Litz, N.: Schutz vor Organika, in: Handbuch der Bodenkunde, vol. 3, edited by: Blume, H.-P., 28 pp., Landsberg, Germany, 1998. Makó, A., Kocsis, M., Barna, G., and Tóth, G.: Mapping the storing and filtering capacity of European soils, JRC Technical Reports, European Commission, https://doi.org/10.2788/49218, EUR 28392 EN, 62 pp., 2017. Maxim, L. and van der Sluijs, J. P.: Quality in environmental science for policy: Assessing uncertainty as a component of policy analysis, Environ. Sci. Policy, 14, 482–492, https://doi.org/10.1016/j.envsci.2011.01.003, 2011. Miller, R.: Bodenfunktionsbewertung für die Raum- und Bauleitplanung in Hessen und Rheinland-Pfalz, Hessisches Landesamt für Umwelt und Geologie, Landesamt für Geologie und Bergbau, Rheinland-Pfalz, Germany, 2012. Nussbaum, M. and Papritz, A.: Transferfunktion Dichte. Einfache PTF für PMSoil, Dokumentation Analyse, Soil and Terrestrial Environmental Physics, ETH Zurich, Zurich, Switzerland, 2015. Nussbaum, M., Walthert, L., Fraefel, M., Greiner, L., and Papritz, A.: Mapping of soil properties at high resolution in Switzerland using boosted geoadditive models, SOIL, 3, 191–210, https://doi.org/10.5194/soil-3-191-2017, 2017. Nussbaum, M., Spiess, K., Baltensweiler, A., Grob, U., Keller, A., Greiner, L., Schaepman, M. E. and Papritz, A.: Evaluation of digital soil mapping approaches with large sets of environmental covariates, SOIL, 4, 1–22, https://doi.org/10.5194/soil-4-1-2018, 2018. Oberholzer, H.-R. and Scheid, S.: Bodenmikrobiologische Kennwerte, Erfassung des Zustands landwirtschaftlicher Böden im NABO-Referenzmessnet anhang biologischer Parameter (NABObio), Umwelt-Wissen, 723, 78 pp., Bundesamt für Umwelt/Federal Office of the Environment, Bern, Switzerland, 2007. PPDB: Pesticide Properties DataBase, University of Hertfordshire, Hertfordshire, UK, 22 May 2017, available at: http://sitem.herts. ac.uk/aeru/ppdb/ (last access: 7 May 2018), 2017. Sanchez, P. A., Ahamed, S., Carre, F., Hartemink, A. E., Hempel, J., Huising, J., Lagacherie, P., McBratney, A. B., McKenzie, N. J., Mendonca-Santos, M. d. L., Minasny, B., Montanarella, L., Okoth, P., Palm, C. A., Sachs, J. D., Shepherd, K. D., Vagen, T.G., Vanlauwe, B., Walsh, M. G., Winowiecki, L. A., and Zhang, G.-L.: Digital Soil Map of the World, Science, 325, 680–681, https://doi.org/10.1126/science.1175084, 2009.
www.soil-journal.net/4/123/2018/
L. Greiner et al.: Uncertainty indication in soil function maps Schaap, M. G.: Accuracy and uncertainty in PTF predictions, Dev. Soil Sci., 30, 33–43, https://doi.org/10.1016/S01662481(04)30003-6, 2004. Schulte, R. P. O., Creamer, R. E., Donnellan, T., Farrelly, N., Fealy, R., O’Donoghue, C., and O’hUallachain, D.: Functional land management: A framework for managing soil-based ecosystem services for the sustainable intensification of agriculture, Environ. Sci. Policy, 38, 45–58, https://doi.org/10.1016/j.envsci.2013.10.002, 2014. Schwilch, G., Bernet, L., Fleskens, L., Giannakis, E., Leventon, J., Marañón, T., Mills, J., Short, C., Stolte, J., van Delden, H., and Verzandvoort, S.: Operationalizing ecosystem services for the mitigation of soil threats: A proposed framework, Ecol. Indic., 67, 586–597, https://doi.org/10.1016/j.ecolind.2016.03.016, 2016. Siemer, B., Hinrichs, U., Penndorf, O., Pohl, M., Schürer, S., Schulze, P., and Seiffert, S.: Bodenbewertungsinstrument Sachsen, Sächsiches Landesamt für Umwelt, Landwirtschaft und Geologie, Dresden, Germany, 66 pp., available at: http://www.umwelt.sachsen.de/umwelt/download/boden/ Bodenbewertungsinstrument_Sachsen_092014(1).pdf (last access: 7 May 2018), 2014. Six, L. and Smolders, E.: Future trends in soil cadmium concentration under current cadmium fluxes to European agricultural soils, Sci. Total Environ., 485–486, 319–328, https://doi.org/10.1016/j.scitotenv.2014.03.109, 2014. Swisstopo: Geologische Karte der Schweiz 1 : 500 000, 18 May 2017, available at: https://shop.swisstopo.admin.ch/de/products/ maps/geology/GK500/GK500_DIGITAL (last access: 7 May 2018), 2008. Swisstopo: SwissAlti3d, Federal Office of Topography, Wabern bei Bern, Switzerland, 2014. Taylor, A. L., Dessai, S., and de Bruin, W. B.: Communicating uncertainty in seasonal and interannual climate forecasts in Europe, Philos. T. R. Soc. A, 373, 16 pp., https://doi.org/10.1098/rsta.2014.0454, 2015. Tóth, G., Gardi, C., Bódis, K., Ivits, E., Aksoy, E., Jones, A., Jeffery, S., Petursdottir, T., and Montanarella, L.: Continental-scale assessment of provisioning soil functions in Europe, Ecol. Process., 2, 18 pp., https://doi.org/10.1186/2192-1709-2-32, 2013.
www.soil-journal.net/4/123/2018/
139 Valujeva, K., O’Sullivan, L., Gutzler, C., Fealy, R., and Schulte, R. P. O.: The challenge of managing soil functions at multiple scales: An optimisation study of the synergistic and antagonistic trade-offs between soil functions in Ireland, Land Use Policy, 58, 335–347, https://doi.org/10.1016/j.landusepol.2016.07.028, 2016. Vatn, A.: An institutional analysis of methods for environmental appraisal, Ecol. Econ., 8, 2207–2215, https://doi.org/10.1016/j.ecolecon.2009.04.005, 2009. Vaysse, K. and Lagacherie, P.: Evaluating Digital Soil Mapping approaches for mapping GlobalSoilMap soil properties from legacy data in Languedoc-Roussillon (France), Geoderma Reg., 4, 20– 30, https://doi.org/10.1016/J.GEODRS.2014.11.003, 2015. Vereecken, H., Schnepf, A., Hopmans, J. W., Javaux, M., Or, D., Roose, T., Vanderborght, J., Young, M. H., Amelung, W., Aitkenhead, M., Allison, S. D., Assouline, S., Baveye, P., Berli, M., Brüggemann, N., Finke, P., Flury, M., Gaiser, T., Govers, G., Ghezzehei, T., Hallett, P., Hendricks Franssen, H. J., Heppell, J., Horn, R., Huisman, J. A., Jacques, D., Jonard, F., Kollet, S., Lafolie, F., Lamorski, K., Leitner, D., McBratney, A., Minasny, B., Montzka, C., Nowak, W., Pachepsky, Y., Padarian, J., Romano, N., Roth, K., Rothfuss, Y., Rowe, E. C., Schwen, A., Šim˚unek, J., Tiktak, A., Van Dam, J., van der Zee, S. E. A. T. M., Vogel, H. J., Vrugt, J. A., Wöhling, T., and Young, I. M.: Modeling Soil Processes: Review, Key Challenges, and New Perspectives, Vadose Zone J., 15, 57 pp., https://doi.org/10.2136/vzj2015.09.0131, 2016. Walthert, L., Bridler, L., Keller, A., Lussi, M., and Grob, U.: Harmonisierung von Bodendaten. Anhang zum Schlussbericht von PMSoil (“Predictive mapping of soil properties for the evaluation of soil functions at regional scale”, NRP 68), Eidgenössische Forschungsanstalt WSL und Agroscope Reckenholz, ETH Zurich Research Collection, 58 pp., https://doi.org/10.3929/ethza-010801994, 2016.
SOIL, 4, 123–139, 2018