In this paper, we investigate the packet drop probability and the lifetime of BGP sessions in two types of bandwidth saturation scenarios: (1) the TCP bandwidth ...
Understanding BGP Session Robustness in Bandwidth Saturation Regime Li Xiao, Guanghui He and Klara Nahrstedt Department of Computer Science University of Illinois at Urbana-Champaign, Urbana, IL 61801
this session, have to be invalidated. A large amount of route re-computation is thus triggered at the routers. Moreover, the BGP withdraw messages and update messages are flooded into a wide area, which might result in even severer routing instability. Because the instability in the routing control plane has many harmful impacts on data communication, such as temporarily unreachable network addresses, frequent route flaps, etc., the overall performance of Internet is significantly degraded due to the unreliable BGP sessions. Therefore, it is important for us to understand the characteristics and the influential factors of BGP session failures in various stressful network conditions.
Abstract— The reliability and robustness of the Border Gateway Protocol (BGP) play very important roles in achieving highly stable and prompt Internet data communication. The present BGP uses TCP/IP to exchange routing control information. These routing control messages are usually not differentiated from the normal data packets in Internet packet forwarding, and this makes BGP sensitive to severe network congestion. In this paper, we investigate the packet drop probability and the lifetime of BGP sessions in two types of bandwidth saturation scenarios: (1) the TCP bandwidth saturation caused by traffic engineering failures; (2) the UDP bandwidth saturation caused by worm attacks. In the TCP bandwidth saturation, as time elapses, the packet drop probability decreases in a subexponential way. While, in the UDP bandwidth saturation, the packet drop probability converges in an exponential way to its maximum value with the progress of worm propagation. For the lifetime of BGP sessions, based on our empirical study, we find that in most cases the BGP session lifetime can be characterized using exponential distributions and Weibull distributions. In the case of TCP bandwidth saturation, if all TCP connections have the same round trip time, the tail of the BGP lifetime tends to be power-law. To get a deep understanding of the BGP sessions lifetime, we give an approximate model for the expected lifetime of BGP sessions, and show that by slightly changing the TCP retransmission parameters, the expected BGP session lifetime can be improved significantly. Our research results provide very important index in evaluating the reliability of Internet routing schemes and are very helpful in designing resilient Internet routing infrastructures.
In general, since BGP sessions are built on top of TCP, the session failure can potentially be caused by the errors from any lower layers in the network stack. For example, Jahanian et al. [2] [3] show that the network congestion can break BGP sessions by consecutively dropping the BGP messages between the BGP peers; in [4], the BGP session failure caused by IP forwarding disruption is demonstrated. In this paper, we mainly focus on the survivability of BGP sessions in the scenarios of severe network congestion, called bandwidth saturation. Bandwidth saturation results from two reasons: traffic engineering failure and worm attacks. In current Internet, traffic engineering is performed based on the normal network conditions, and the traffic loads on different links are well balanced. However, the traffic engineering could fail, because of network mis-configurations or network component failure. A large amount of traffic (mainly consists of TCP flows) may be shifted to a few network links and causes the bandwidth saturation on these links. If a BGP session is going through the saturated links, the BGP messages may be dropped consecutively, which may further lead to the BGP session reset. Although TCP transmits the background traffic in a highly conservative manner by dramatically shrinking the sending window size and exponentially increasing the retransmission timer, BGP sessions still can be broken.
I. I NTRODUCTION Border Gateway Protocol (BGP) [1] is the de facto standard for inter-domain routing. The routers that run BGP and exchange routing information directly with each other are called BGP peers. When two BGP peers start up, they set up a BGP session that is running over TCP, and then exchange the entire routing table to calculate the routes at the inter-domain level. Thereafter, they only exchange the routing information incrementally to keep their routing table up-to-date. In this paper, we investigate the reliability of BGP sessions.
In the case when the networks are subject to worm attacks, the UDP flows generated by the scanning worms also threaten the survivability of BGP sessions. Wang, Lad et al. [5] [6] report that the worm attacks coincide with a large amount of BGP update messages, which implies that the BGP session reset may be triggered by worm saturation attacks in the Internet. Typically, UDP packets are sent at very high rates to randomly selected IP addresses by worms, which could easily saturate the bottleneck links and result in high CPU utilization at routers due to the address lookup. In what follows, we only focus on the influence of worms on the bandwidth saturation
A. BGP Failures in Congested Networks The robustness and stability of BGP sessions are crucial in providing high-quality Internet data communication support. However, multiple reasons can cause BGP session failure (or reset), such as, network component failures, network congestion, and operation mistakes. Once a BGP session fails, all routes in the BGP routing tables, which are exchanged via This work was supported by NSF under contract number NSF ANI 0323434. Any opinions presented here do not necessarily reflect the views of the National Science Foundation.
1
and its further impact on the BGP sessions1 . Unlike TCP, the worm generated UDP traffic is not elastic. Instead, it resembles the constant bit-rate flows. As more and more hosts are infected by the worms, the amount of UDP traffic increases exponentially, and hence the bandwidth saturation happens. Particularly, in the edge ASes of the Internet, such as enterprise or campus networks, the inter-domain links belonging to these ASes have much less capacity than the links in their ISP backbone and their local backbone. Therefore, these inter-domain links are more likely to be saturated, when the networks encounter traffic engineering failures or are subject to worm attacks.
we focus on the distribution models of BGP session lifetime as well as its expected value. Specifically, we have the following three concerns: (1) The model in [7] does not characterize the entire process of BGP session failure detection, i.e., the U2D cycle is defined as the time interval in which one router does not receive KEEPALIVE message from its peer before the Hold Timer expires. However, in practice, two BGP peers detect the session failure event mutually and independently. If any of the two peers fails to receive the KEEPALIVE messages, the BGP session is declared to be failed. Thus, by using the Markov chain in [7], the lifetime of BGP session would be significantly overestimated. (2) We aim to study the BGP sessions in a more realistic network context. Packet drop probability in bandwidth saturation is not a constant. In the TCP induced congestion case, the packet drop probability fluctuates dramatically due to the TCP retransmission schemes and the congestion window adjustment. In the UDP induced congestion case (caused by worm traffic), the drop probability changes with the progress of the worm propagation. Moreover, we consider more realistic behaviors of TCP retransmission, which greatly influence the BGP session lifetime. (3) The model in [7] assumes that BGP routers always have messages ready to send to their peers. In reality, the message sending frequency depends on the KeepAlive Timer and the route updating process. The message sending frequency between two peers can influence the reliability of the BGP session[4]. In order to obtain the distribution of the BGP session lifetime, the pure model based methods confront two challenges. First, building an elaborate model which can accurately characterize the mechanisms of session reset is nontrivial; second, even if such a model can be obtained, solving such a model could be very hard or even intractable. So, in this paper, we first tackle this problem in an empirical and statistical way by simulating the realistic network saturation scenarios, and then propose approximate models based on the empirical study results. We also refine the model in [7] to improve the accuracy of predicting the BGP U2D time, by considering more realistic behaviors of the most popular TCP version (TCP Reno). Moreover, we propose a model for the expected session lifetime based on the results of BGP lifetime distributions and BGP U2D time. Based on the above discussion, two closely related problems need to be investigated under bandwidth saturation (caused by TCP or UDP). First, what is the behavior of the packet drop probability? Second, what is the statistical properties of the BGP session lifetime? To answer the first question, an insight into the mechanisms causing the congestion under TCP and UDP is preferable. In the UDP (worm attacks) induced saturation, packet drop probability increases as more and more hosts are infected. We use the epidemic model [8] to characterize the worm propagation process. Although solving the UDP case is straightforward, precisely characterizing the TCP congestion behavior is a challenging task and most of the existing researches, such as [9] and [10], only consider lightly congested network links. For example, the capacity of the bottleneck link is assumed to increase linearly with the number of TCP sessions on the link.
B. BGP Session Lifetime The lifetime of BGP sessions is an important metric in evaluating the robustness and the reliability of BGP in congested networks. We define the BGP session lifetime as the time interval from the occurrence of the network special event, such as worm breaks or traffic engineering failure, till the BGP session reset. There are several benefits in understanding the statistical characteristics of BGP session lifetime in network bandwidth saturation scenarios. First, we establish a relationship between the reliability of BGP sessions and the network-congested circumstances. Thus, equipped with the observatory on the network-congested conditions, the network administrators are able to predict the BGP session lifetime, and take necessary measures to prevent the failures of BGP sessions due to network congestion. Second, we add a new dimension to evaluate the quality of the network routing infrastructure — the vulnerability of BGP routing protocol to bandwidth saturation attack. For example, it is valuable to know the survival probability of BGP sessions under certain congestion intensity and the recovery time. This information is helpful for inferring the network communication quality in the data planes, and supporting the decisions on some network service deployments. Third, we can capture the important factors that influence the robustness of BGP sessions, especially the impact of TCP retransmission behaviors on the BGP session reliability. Moreover, some configurable network parameters can be tuned to improve the BGP session reliability, without changing the behaviors of network protocols in normal network conditions. To facilitate the study of BGP session reset and the lifetime subject to the transport layer congestion (TCP or UDP), we take a joint approach by using the approximate models and empirical studies. Shaikh et al. [7] initiate the novel research on modeling the routing protocol lifetime in the congested networks. They use a Markov chain to study the Up-to-Down (U2D) cycle of BGP sessions, which establishes the relationship between the expected value of U2D cycle and the network traffic overload factors. However, some simplifications in their model are not realistic, and their study is mainly limited to the expected value of the U2D time of BGP sessions as well. On the other hand, 1 Some routers are implemented with Express Forwarding, which alleviates much CPU load in address lookup.
2
We notice that under extreme network congestion, the TCP’s congestion control behavior is dominated by the process of retransmission timeouts and TCP session drops2 . We establish an approximate model to characterize the transient behavior of the average packet drop probability. In finding the longterm packet drop probability, we carry out simulations and find that the packet drop probability decreases gradually at a subexponential rate as time elapses. As to the second question, the property of BGP session lifetime is essentially influenced by the packet drop behaviors in specific saturation scenarios. By using statistical analysis, we find that in most of the cases, the distribution of BGP session lifetime can be approximated by the exponential distributions or the Weibull distributions. However, when the Round Trip Time (RTT) of the background TCP flows is homogeneous, the distribution of BGP session lifetime shows a heavy-tailed property, and the variance of the lifetime tends to be infinite. The lifetime is essentially influenced by the TCP retransmission behaviors. We study the impacts of TCP on the expected lifetime, and the strategies on tuning TCP parameters to increase the expected lifetime significantly. The rest of the paper is organized as follows: In Section II, we give background information on how BGP detects the session failure, define BGP session lifetime, and describe our methodology for studying the reliability of BGP sessions. We present the approximate models for the packet drop in TCP and UDP bandwidth saturation in Section III. Then, we discuss the distribution of BGP session lifetime in Section IV and Section V. Moreover, we propose a model to approximate the expected BGP session lifetime in Section VI, and discuss the impact of TCP retransmission behaviors on BGP session lifetime. Section VII concludes the paper.
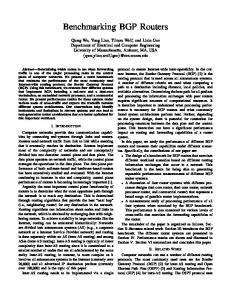
B. Methodology of Studying BGP Reliability As we mentioned in Section I, our main purpose is to study the reliability of BGP when the network available bandwidth is saturated. The bandwidth saturation can be caused by two major sources: scanning worms cause UDP type of bandwidth saturation, and traffic engineering failures lead to TCP type of bandwidth saturation. We define the events, e.g. worm breaks or incoming TCP flows, as the impulses on the BGP sessions. Fig. 1 demonstrates our system model. The impulses are generated by n UDP or TCP hosts, which are connected to two BGP routers, r1 and r2 . The link between these two routers can process c bits per second in each direction. If the volume of the impulses imposed on the system exceeds the capacity of the link, packets are buffered in a queue with size qlen. We assume that the drop-tail queue management is used, i.e., once the queue is full, the newly arrivals are discarded, including the KEEPALIVE messages of BGP. Other type of queue management methods exist, such as Random Early Detection (RED). Since drop-tail is still the most widely deployed queuing scheme, we focus on drop-tail queue in this paper for the purpose of BGP reliability investigation.
1
r1
2
qlen
r2 BGP session
c
n
background traffic
i
TCP or UDP host
BGP router
Fig. 1. System mode: BGP session passes a congested link with capacity c (bits/sec) and queue size qlen (pkts).
II. P RELIMINARIES AND M ETHODOLOGY
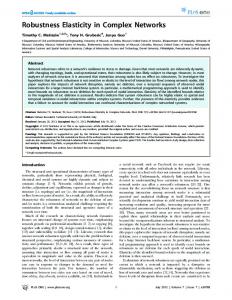
In drop-tail queuing, there are two types of strategies for controlling the queue length. First, the queue length is defined in terms of the number of bytes, i.e., the incoming packet is dropped if its length is larger than the remaining buffer size in bytes. Second, the queue length is defined in terms of the number of packets. The packet is discarded, only if the number of queued packets is larger than qlen (assuming the memory for buffering is enough). The first method favors the packets of small size. The reason is that when the network congestion happens and the queuing space becomes a limited resource, the smaller packets have higher probability to be queued than the larger packets. On the other hand, the second method treats the packets of different sizes equally. Fig. 2 shows the experimental results of the packet drop probability for different packet sizes, if the queue size is defined in terms of the number of bytes. Packets of five different sizes (40, 59, 256, 512, and 1024 bytes) are sent to a link with capacity 10Mbps and queue size 1Mbits. The packet arrivals are modeled as a Poisson process, and the lengths of the packets are uniformly distributed in the five possible sizes. IP packets containing the BGP KEEPALIVE messages are 59 bytes, which is relatively small compared to other IP packets. Thus, if the drop-tail queue size is defined by the
A. BGP Session Failure Detection A BGP router detects the misbehaving peers by maintaining a KeepAlive Timer and a Hold Timer for each BGP session it possesses. When the KeepAlive Timer expires, a KEEPALIVE message is sent to the peer router associated with the session. When receiving a KEEPALIVE message or an UPDATE message, the Hold Timer is cleared. When an UPDATE message is sent out, the KeepAlive Timer is also cleared. If the Hold Timer expires, the BGP router assumes that the peer router can not respond correctly, and thus resets the BGP session by sending a NOTIFICATION message to the peer. If the network is highly congested, TCP may fail to deliver KEEPALIVE messages consecutively, which will cause Hold Timer expiration. The BGP session is reset on any of the expiration events at the peer routers. In our study, these timers are set according to the default values in IETF RFC, i.e., the period of Hold Timer Th is 90 seconds and the period of KeepAlive Timer Tk is 30 seconds. 2 A TCP session will be dropped if the retransmission backoff reaches its maximum number. We will look at this in detail in Section III-A.
3
TABLE I S IMULATION PARAMETERS
Packet Drop Probability (c=10Mbps, b=1Mbits) 1 40B 59B 256B 512B 1024B
0.9
Packet drop probability
0.8 0.7
router link capacity c
0.6
router queue size, qlen rtt of hosts (propagation delay)
0.5 0.4
T1 (1.5Mbps), 5Mbps, and 10Mbps 75, 250, 500, and 1000 pkts 30ms and 120ms, uniform for all hosts, or randomly generated from [0, 60] and [0, 240]
0.3
TCP connections, conn
500, 1000, 1500, 2000, and 3000
0.2
UDP connections, conn
500
0.1 0
worm propagation rate, β 0.0005, 0.001, 0.002 and 0.004 0.4
0.6
0.8
1
1.2
1.4
Packet arrivial rates
1.6
1.8
packet size, l
2 4
x 10
TCP 500, 1000 bytes. UDP 256 Bytes.
Fig. 2. The influence of packet size in drop-tail queue. The queue size is defined by the number of bytes.
flows are dumped to a link which has relatively small capacity. The second scenario is caused by the scanning worms, and the available bandwidth on the link is saturated by lots of UDP flows. The percentage of discarded packets, i.e., the packet drop probability, is the parameter we are interested in, which largely determines the property of BGP lifetime. In the following parts, we will show that the packet drop probability behaves differently in the two bandwidth saturation scenarios.
number of bytes, KEEPALIVE messages are less likely to be dropped than other packets. However, in the real Internet IP router implementation, the queue size is usually controlled by the number of packets [11]. In the following discussion, we assume that the queue length is defined in the number of packets, and therefore the packets of different sizes are treated equally. The properties of packet drop probability under different bandwidth saturation scenarios will be discussed in Section III. BGP session lifetime is defined as the time interval starting from the beginning of the impulse event to the expiration of the Hold Timers. Because the packet loss in the congestion is a time-varying process, it is extremely hard to find out a closed-form solution of the BGP session lifetime. Therefore, we rely on simulations and statistical analysis to investigate the distribution of BGP lifetime. By setting up the traffic impulses in the simulator, we collect a large number of samples of the BGP session lifetime, and the Kaplan-Meier estimator [12] is used to extract the CCDF(Complementary Cumulative Distribution Function, also called empirical survival function) of BGP sessions. Furthermore, we study the statistic properties of the BGP session lifetime, such as the distribution and the mean. The results of the BGP session lifetime are shown in Section IV. Our simulation is carried out on the network topology described in Fig. 1. The adopted simulator is SSFNet (version 2.0.0) [13]. We modified the drop-tail queuing module such that the queue size is controlled by the number of packets. The link capacity between hosts and routers is 100Mbps, which is larger than the capacity between routers r1 and r2 , so that the link, which the BGP session passes, is the bottleneck. The propagation delay between the two routers is 10ms. TCP Reno is used in our study, which is the most widely deployed TCP version. The network parameters for different simulation scenarios are summarized in Table I. The worm propagation rate will be introduced in Section III-B.
A. Packet Loss in TCP Bandwidth Saturation
III. C HARACTERIZING PACKET L OSS IN TCP AND UDP BANDWIDTH S ATURATION
In order to obtain the packet drop probability under TCP bandwidth saturation, two facts about TCP retransmission are important. First, in TCP implementations [14], packets are retransmitted in an exponential backoff manner, i.e., RT O = min(2k R0 , Rm ), where k is the backoff counter, R0 is the initial value of RT O, and Rm is the maximum retransmission timeout limit. The default value of Rm is 64 seconds. R0 is calculated from the RTT (Round Trip Time). Second, the backoff counter is increased by one on each packet timeout. Only on a successful packet transmission, the backoff counter is reset to zero3 . The maximum value of the backoff counter ζ is 12. If the maximum value is exceeded, the TCP connection is dropped. Before delving into the detailed exploitation of the packet drop probability, pd , in TCP bandwidth saturation, we notice that pd is time-variant, due to the fact that some of the TCP connections terminate when their backoff counters exceed the limit (12) and hence both the number of flows and the packet drop probability decrease gradually as time elapses. Therefore, we investigate pd in two aspects. First, we calculate pd in transient period by leveraging a fixed point model derived from a Markov Chain. The transient period corresponds to the time interval from the beginning of the congestion to the time when any TCP connection is lost. Second, we use empirical study to characterize the long-term packet drop probability and the survived number of TCP connections. In particular, pd is averaged over a large time scale (hundreds of seconds) to support our further study on BGP session lifetime. 1) Packet Drop Probability in Transient Period: The TCP behavior subject to the heavy congestion can be approximately
Recall that we mainly consider two typical scenarios of bandwidth saturation in this paper. The first scenario is caused by traffic engineering failures, and a large number of TCP
3 The backoff counter should not be reset, until the acknowledgment for a non-retransmitted packet is received. Especially, the successful retransmission does not clear the backoff counter.
4
from state i, 2p-p2
END
p
(1, 11)
(1, 3)
1-p
p
(1, 2)
p
1-p
1-p
(1, 1)
p
(1, 0)
1-p
1-(1-p)3
(2, 0)
(1-p)2
(3, 0)
1 (1-p)3
(4, 0)
1-p
(2, 11)
p
p-p2
(2, 3) (1-p)2
Fig. 3.
p
p-p2
(2, 2) (1-p)2
p
p-p2
1 � i −1 j wi + w j=1 p(1 − p) j
: :
if wi = 1 else
E(Ti ) = (1 − p)wi RT T + (1 − (1 − p)wi ) min(2ki R0 , Rm ) .
(2, 1) (1-p)2
�
and E(Ti ) is the expected time of staying in state i,
p p-p2
E(Pi ) =
(1-p)2
Since, r(p) is the average sending rate of a single TCP source, if there are n such connections, the capacity of link is c, and there is no buffer in the queue, we can define the following function: � � nr(p) − c Γ(p) = nr(p) +
TCP state Markov chain in severe congestion.
modeled as a Markov Chain, as shown in Fig. 3. The number on (or beside) the arrows stands for the transition probability. p is the probability that a packet is discarded at the droptail queue. Each state i is identified by a two-tuple (wi , ki ), where wi stands for the congestion window size in terms of packet number, and ki is the backoff counter. We are only interested in the behavior of TCP under severe congestion. Because timeouts happen frequently in this condition and TCP stays mainly in the slow-start phase, it is reasonable for us to assume that the slow start threshold is two and we ignore the states whose windows are larger than four, i.e., the congestion window can only increases up to four and then it shrinks to one. On every packet transmission failure, the congestion window also shrinks to one, and the retransmission is deferred after the timeout. If the retransmitted packet is dropped, the congestion window remains the same, while the backoff counter increases by one. On the contrary, upon each successful packet retransmission, the congestion window increases by one and the backoff counter remains the same. For example, upon a successful packet retransmission at state (1, 3), the state jumps to (2, 3). At states (2, k), two packets are sent out. If both packets are successfully delivered, the congestion window increases by one, the backoff counter is cleared, and the state jumps to (3, 0); if the first packet is successfully transmitted and the second packet is lost, the state jumps to (1, 1), and the acknowledgment of the first packet also triggers a packet sending; in all other cases, no new acknowledgment is received, and the state jumps to (1, k + 1). The ’End’ state means that the TCP connection is dropped due to too many backoffs. In order to make the chain to be positive recurrent, we add an additional transition from state ’End’ to state (1, 11) with probability 1. Thus, the equilibrium distribution the Markov chain can be calculated. However, because of the additional state transition, the packet drop probability will be overestimated, and our simulation results also confirm this difference. Suppose πi is the equilibrium distribution of state i, and l is the packet size, i.e., l = (M SS + 40) ∗ 8 bits, where M SS is the maximum segment size in TCP protocol. Then, the traffic rate generated by a single TCP source is approximated by � l ∀i πi E(Pi ) , r(p) = � ∀i πi E(Ti )
Γ(p) stands for the percentage of packet loss on the congested link. Thus, the fixed point solution of Γ(p) is the average packet drop probability pd in the transient period of TCP saturation. That is, pd satisfies the following equation: Γ(pd ) = pd .
(1)
Because Γ(p) is a continuous monotonically decreasing function of p ∈ [0, 1], and Γ(p) ∈ [0, 1], it is guaranteed that Γ(p) has one and only one fixed point. Through binary search, we can solve Eq. (1) and obtain the approximate result of packet drop probability. This approximation is derived based on the assumptions that every TCP flow has the same RTT and there is no queue at the router. When the queue exists, this value actually provides an upper bound of the packet drop probability. By using SSFNet simulator, we compare the pd calculated from Eq. (1) with the results obtained from the simulation. Three types of links and different queue sizes are tested (based on the topology in Fig. 1). Each TCP flow has RT T = 30ms (not including the queuing delay). The results are shown in Fig. 4. The solid lines represent the packet drop probability pd that is averaged in the whole transient period (about 500 seconds); the error bars represent the 95% confidence interval of pd that is averaged at time scale of 1 second. It is not surprising to observe that the drop probability has a large variance at small time sale. However, our fixed point model tracks pd at the large timescale (shown as the solid line Fig. 4) very well. The small amount of overestimation is caused by two factors: the introduction of the queue and the special treatment of the ‘End’ state as mentioned at the beginning of this section. In addition, Fig. 4(a) shows that a larger queue size incurs less packet drop probability. The packet size also matters (Fig. 4(b)). An interesting fact is observed: the packet drop probability under the (10Mbps, l=1000B) case is the same as that of the (5Mbps, l=500B) case. This can be explained by capitalizing on our fixed point model, i.e., in both cases, the link has the same forwarding capacity in terms of the number of packets, and thus results in the same fixed point solution. Due to this result, in what follows, we will focus only on the cases with packet size 1000 bytes. The fixed point model gives us an estimation on pd in transient period. In addition, if the number of the TCP connections is not very large, then no TCP connection is actually dropped. Under this circumstance, the transient period extends
where E(Pi ) is the expected number of packets that are sent 5
0.7
to the initial number of TCP connections, though they have different pd ’s in the transient state. The reason is that when the number of TCP connections is larger, the packet drop probability in the transient state is higher, and thus the drop rates of TCP connections are also higher than those in the cases of smaller connection numbers. In addition, because of TCP’s congestion control scheme (mainly timeouts during extremely congested periods), the remaining TCP connections enter a safety state4 , and the packet drop probability remains stable around the same pd . (2) Whether the RTT is uniformly or randomly distributed significantly influences the equilibrium state of pd . The random RTT leads to lower equilibrium pd than the uniform RTT. Moreover, when the TCP hosts have uniform RTT, increasing queue size can effectively absorb the burstiness of TCP flows and decrease pd (shown in Fig. 5(b)). On the other hand, Fig. 5(c) demonstrates that the queue size does not has too much impact on the equilibrium pd , when the RTT is randomly distributed5 . Due to this reason, in Section IV we will see that the queue size has only minor impact on the BGP session lifetime.
Packet drop probability
0.6
0.5
0.4
0.3
0.2
Fixed Point Model qlen=500 pkts qlen=75 pkts (CI: 95%)
0.1
0 0
500
1000
1500
2000
2500
3000
3500
4000
The number of TCP connections
(a) T1 link, rtt = 0.03s, and l = 1000B 0.7
Packet drop probability
0.6
0.5
0.4
0.3
0.2
Fixed Point Model, 5Mbps, L=1000B Fixed Point Model, 10Mbps, L=1000B 10Mbps, L=1000B 5Mbps, MSS=500B 5Mbps, L=1000B (CI: 95%)
0.1
0 0
2000
4000
6000
8000
10000
B. Packet Loss in UDP Bandwidth Saturation Different types of worms may have specific scanning behaviors. In this paper, we assume the worms scan IP addresses randomly. Because UDP packets generated by worms are nonelastic, the influence of the queue size can be ignored. Thus, we can calculate the packet drop probability more easily than in the cases of TCP. Suppose we have m hosts in one domain, which have been infected by worms. Every host sends out scanning packets to randomly generated IP addresses. Let r denote the rate of the packets that are sent to the addresses of other domains by each host, i.e., each infected host contributes r packets per second to the link between routers r1 and r2 in Fig. 1. m and r can be obtained from the network address allocation information and the routing tables. Thus, the packet drop probability can be calculated as � c � , (2) pd = 1 − mrl + where l is the size of the UDP packet. If the propagation process of worms needs to be addressed, the number of infected hosts is an increasing function of time. We use the epidemic model to characterize the worm propagation. Suppose β is the contact rate of two hosts, and n is the total number of hosts in one domain. Initially, there is one host been infected. At the ith period, i.e., t ∈ ((i − 1)∆T, i∆T ), the number of infected hosts [8] is n m(t) = (3) 1 + (n − 1)e−βni
12000
The number of TCP connections
(b) 5Mbps and 10Mbps links, rtt = 0.03s, and qlen = 75 pkts Fig. 4. state.
Packet drop probability pd wrt. the number of flows in transient
to the entire time axis and thus the results obtained by this model provide an approximation for the whole time period. In general, under severe congestion, the above model is incapable of generating satisfactory results as time goes to infinity, and we aim to explore the behavior of the packet drop probability in long-term period by empirical study. 2) Long-term Behaviors of TCP: In the long run, as the bottleneck link gets saturated, some TCP connections are dropped gradually, which leads to smaller number of TCP connections competing the bandwidth on the bottleneck link. Usually, it is intractable to get a closed-form result of pd over time. Therefore, we study the behavior of packet drop by simulations. The results are shown in Fig. 21. We only show the cases where RTT is 30ms (for the 120ms cases, we get similar results.). The packet drop probability pd is obtained by averaging the instantaneous results over a time granularity of 600 seconds. In the figures, both axes are in logarithmic scale, therefore a straight line implies a powerlow behavior. In other words, pd decreases approximately in a power-low, which means that the decreasing rate of pd is much slower than an exponential decreasing way. To be more conservative, we refer to a milder notion: subexponential distribution, which includes power-low ones. After the time exceeds 104 seconds, pd levels off, which indicates that the network enters the equilibrium state (in term of packet drop). There are two interesting observations on pd in this state: (1) Given a fixed queue size, pd is insensitive
where ∆T is the length of each infection period. Thus, by plugging m(t) into Equation 2, we get the packet drop probability � � t c pd � p∗d − e−βn� ∆T � (4) rl + 4 i.e., the equilibrium state in which the drop rate of TCP connections decrease to a very small value, and no further TCP connection drop happens. 5 However, large queue size can still substantially decrease p in the d transient state.
6
T1 link, Uniform rtt=30 ms
0
0. 5
10
conn=1000, qlen=500 conn=500, qlen=75 conn=1000, qlen=75 conn=2000, qlen=75
Packet drop probability pd
Packet drop probability pd
Percentage of remaining TCP connections
T1 link, Random rtt=30 ms
T1 link, Uniform rtt=30 ms
10
10
conn=1000, qlen=500 conn=500, qlen=75 conn=1000, qlen=75 conn=2000, qlen=75
3
10
0. 6
10
0. 5
0. 7
10
0. 8
10
0. 6
10
0. 9
10
4
5
10
10
3
4
10
3
5
10
10
10
Time (seconds)
Time (seconds)
(a) Remaining TCP connections. Fig. 5.
conn=1000, qlen=500 conn=500, qlen=75 conn=1000, qlen=75 conn=2000, qlen=75 4
10
5
10
Time (seconds)
(b) Packet drop probability (uniform rtt).
(c) Packet drop probability (random rtt).
TCP behavior under bandwidth saturation in long-term period.
where, p∗d is the drop probability when the worm propagation is matured in the domain (all �the hosts in the domain are � c . Different from the TCP infected), and p∗d = 1 − nrl + saturation, pd in worm scanning increases in an exponential way toward the matured value p∗d .
A. BGP Lifetime under TCP Saturation Recall that in Section III, under TCP saturation, the packet drop probability, pd , decreases in an approximately subexponential way (power-low), and whether or not the TCP connections possess the same RTT matters. So, to make a clearer description, we consider the BGP session lifetime distribution under the two sub-cases separately: (1) the RTT’s are randomly distributed with mean rtt; (2) all TCP connections have the same RTT (uniform RTT). 1) Random RTT: To make a concise report of our findings, we only show several representatives of the empirical CCDF of Tb in Fig. 67 . Fig. 6(a)-Fig. 6(d) show the results when we change conn, qlen, rtt and c, while keeping other parameters unchanged respectively. Notice that the y-axis is in logarithmic scale, so a straight line indicates an exponential distribution. Thus, a straightforward conclusion is that Tb has an exponential distribution under different conn’s, qlen’s, rtt’s and c’s. However, if the number of TCP connections is not large enough, for example the 10Mbps curve in Fig. 6(d), the lifetime distribution tends to have a heavier tail than the exponential distribution. This reminds us that other type of distributions, such as Weibull distribution, should be applied (see Section V). In the figures, the solid staircase-lines are the empirical CCDF’s, and the dotted lines are the fitted CCDF’s of exponential distributions. λ is the rate of the exponential distribution. From the figure, we also notice that the empirical CCDF’s do not start from time zero (we will see this more clearly in the following figures.). This is because the BGP session does not break until the Hold Timer expires. It takes at least Th − Tk seconds for the Hold Timer to expire from the beginning of the bandwidth saturation. Therefore, the CCDF has a positive shift. We show the empirical mean and variance of the BGP session lifetime under different network configurations in Fig. 7. There are several observations: (1) The mean of the lifetime is approximately the square root of the variance of the lifetime, which further confirms the exponential behavior of the BGP lifetime; (2) The queue size at the router has impact on the BGP lifetime. On average, a larger queue size usually results in a longer lifetime, especially when the number of
IV. CCDF T EST ON L IFETIME OF BGP S ESSIONS In this section, we study the qualitative properties of BGP session lifetime under the bandwidth saturation introduced previously. We mainly focus on the shape of the distribution functions and classify the distribution categories for the BGP session lifetime. In Section V, we will give a quantitative description of the BGP session lifetime distribution. For convenience, the BGP session lifetime is denoted as Tb . The network simulation parameters are shown in Table I. For each combination of the parameters, we obtained 200 samples of Tb , and each sample is obtained by running the simulation for up to 150000 seconds (in simulation time). If the BGP session is still alive after 150000 seconds, the sample is right censored. We believe that the number of samples and the experiment stop time are large enough to lead us to the correct conclusions. Totally, we collected over 20000 BGP session lifetime samples, which cover a wide range of network configurations. We study the properties of BGP session lifetime using its Complementary Cumulative Distribution Function (CCDF), which is also called survival function, S(t)6 : S(t) = P [Tb > t] Every CCDF S(t) is estimated by employing the KaplanMeier estimator [12] from 200 samples. We study the distribution families that S(t) belongs to by testing the behavior of CCDF, and find the relationship between the lifetime and the network configuration parameters, including the number of connections (conn), RTT (rtt), queue size (qlen), worm contact rate (β), etc.. In the following parts, we first look at the TCP saturation case, and then discuss the UDP case. 6 In the following sections, we use survival function and CCDF interchangeably.
7 We
7
get similar results for the cases that are not shown here.
0
0
10
10
conn=500,λ=0.0005
qlen=500 (unit:pkts),λ=0.0013 −1
10
−1
CCDF
CCDF
10
conn=2000,λ=0.0022 −2
10
qlen=75 (unit:pkts),λ=0.0015
−2
10 conn=3000,λ=0.0031
0
2000
4000
6000
8000
10000
12000
0
500
1000
1500
2000
2500
3000
3500
4000
BGP lifetime:Tb
BGP lifetime:Tb
(a) T1 link, qlen = 250, and rtt = 0.03s
(b) T1 link, conn = 1000, and rtt = 0.03s
0
0
10
10
c=10Mbps,λ=0.0003,conn=5000 rtt=0.12,λ=0.0004 −1
10
CCDF
CCDF
−1
10
rtt=0.03,λ=0.0013
−2
c=5Mbps,λ=0.0005
10
c=1Mbps,λ=0.0027
−2
10
0
2000
4000
6000
8000
10000 12000 14000 16000 18000
0
2000
BGP lifetime:Tb
10000
12000
(d) conn = 3000, qlen = 75, and rtt = 0.03s
5
8
10
conn=500 conn=1000 conn=1500 conn=2000 conn=3000
8000
CCDF of BGP session lifetime Tb (S(t)) in TCP saturation (random RTT).
Fig. 6. 4
6000
BGP lifetime:Tb
(c) T1 link, conn = 1000, and qlen = 500
10
4000
7
10
9
10
conn=500 conn=1000 conn=1500 conn=2000 conn=3000
conn=500 conn=1000 conn=1500 conn=2000 conn=3000
conn=500 conn=1000 conn=1500 conn=2000 conn=3000
8
10
10
Empirical variance
3
10
Empirical mean
Empirical variance
Empirical mean
4
10
6
10
3
10
6
5
10
10
2
10
0
200
400
600
800
Queue size (unit:pkts)
(a) T1 link, and rtt = 0.03s Fig. 7.
1000
2
4
10
0
7
10
10 200
400 600 Queue size (unit:pkts)
800
1000
(b) T1 link, and rtt = 0.03s
0
5
200
400 600 Queue size (unit:pkts)
800
(c) T1 link, and rtt = 0.12s
1000
10
0
200
400 600 Queue size (unit:pkts)
800
1000
(d) T1 link, and rtt = 0.12s
Empirical mean and variance of BGP session lifetime in TCP saturation (random RTT).
TCP connections is small. However, if the number of TCP connections is large, the impact of the queue size is minor (Fig. 7 (a) and (c)); (3) Smaller RTT of the background TCP traffic leads to a shorter BGP lifetime, because TCP tends to send packets more promptly, if the RTT is small; (4) The number of TCP connections plays an important role in affecting the BGP lifetime. Specifically, the fewer the TCP connections, the larger the mean of the lifetime. Therefore, during the traffic engineering failures, the fate of the BGP session is mainly determined by the volume of the TCP traffic dumped to the bottleneck link, because the RTT of the background traffic is out of our control, and the queue size is not effective in amortizing a large number of TCP connections.
Fig. 8. Recall that in a log-log plot, a straight line indicates a power-law behavior. When every TCP connection has the same RTT, the CCDF’s of the BGP lifetime can be approximated as a power-law distribution, i.e., S(t) = P [Tb > t] = ct−α We fit the CCDF’s to Pareto distributions (as shown in dotted lines in Fig. 8) with the shape parameter α’s. In our simulation results, the fitted α ranges from 0.76 to 1.9, which indicates the heavy-tailedness of the BGP session lifetime, i.e., Tb has infinite variance. It also implies that under severe TCP congestion, the majority of the BGP sessions have short lifetimes, but there exist a minor portion of the BGP sessions whose lifetimes are extremely long and cause the variance of the BGP session lifetime to approach infinity. In the case when α < 1, the lifetimes of the minor portion of the BGP sessions
2) Uniform RTT: In the uniform RTT scenario, the BGP session lifetime has distinct difference in the statistic distribution from the random RTT case. We show two of the results in 8
0
10
in a domain, and the worm traffic resembles a constant bitrate type of traffic. We consider the second phase first and then discuss the first phase. 1) Constant Bit-rate Traffic: For the constant bit-rate traffic, the packet drop probability pd does not vary over time. In our simulations, the total number of UDP flows is n = 500. From a given pd and Equation 2, we can calculate the sending rate in each UDP flow, r (pkts/sec), as follows: c , r= nl(1 − pd )
conn=1000,α=0.76
CCDF
−1
10
conn=3000,α=1.08
−2
10
1
10
2
10
3
10
4
10
5
10
6
where c is the link capacity, and l is the UDP packet size. When the packet drop probability, pd , is not very high, the constant bit-rate UDP saturation leads to exponentially distributed BGP lifetimes. The simulation results are shown in Fig. 9. We only show the simulation results for the cases where the link capacity equals 10Mbps (the results for the other link bandwidth are similar). Again, a straight line with logarithmic y-axis indicates an exponential distribution. However, we find
10
BGP lifetime:Td
(a) T1 link, rtt = 0.03s, and qlen = 75 0
10
CCDF
−1
10
0
10
qlen=500 (unit:pkts),α=1.8 qlen=75 (unit:pkts),α=0.77 −2
10
pd=0.3,λ=0.0004 2
10
3
10
4
10
5
10
−1
6
10
CCDF
1
10
BGP lifetime:T
b
10
(b) T1 link, rtt = 0.03, and conn = 1000.
pd=0.4,λ=0.0022
Fig. 8. CCDF of BGP session lifetime Tb (S(t)) in TCP saturation (uniform RTT).
pd=0.6,λ=0.0053
−2
10
0
2000
4000
6000
8000
10000
12000
14000
BGP lifetime:T
are so long that even the mean value of the lifetime does not exist (tend to infinity). Although at present we cannot explain the above phenomenon thoroughly, we make efforts to explore the underline mechanisms that trigger it. We notice that for uniform RTT, all the TCP connections are similarly configured, and hence global synchronization happens. In other words, each TCP connection adjusts its congestion window and the backoff counters in the same pace. Specifically, when the backoff counters of all TCP connections reach a large value, the packet arrival rate at the drop-tail queue is small (because the TCP timeout value is large); on the other hand, if every connection achieves a large congestion window size, the packet arrival rate at the bottleneck link is high. Therefore, the aggregated traffic is much more bursty than that in the random RTT case. This makes the packet drop process for the uniform RTT an onoff-alike process. One conjecture we can make is: the on-off packet drop pattern may contribute to the heavy-tailedness of Td , albeit it is not the unique reason. Proof of this conjecture would be part of our future work.
b
(a) 10Mbps link and qlen = 250 0
10
qlen=1000 (unit:pkts),λ=0.0024
CCDF
−1
10
qlen=500 (unit:pkts),λ=0.0021 −2
10
0
500
1000
1500
2000
2500
BGP lifetime:Tb
(b) 10Mbps link and pd = 0.4 Fig. 9. bit-rate.
CCDF of BGP session lifetime in UDP saturation with constant
that when pd is large, the tail of the lifetime tends to decrease faster than an exponential way8 . The simulation results are shown in Fig. 10, where the two groups of curves correspond to pd = 0.8 and pd = 0.95. This figure exposes two important
B. BGP Lifetime under UDP Saturation As we have mentioned, the UDP saturation is caused by the worm scanning. The worm propagation consists of two phases: first, the worms spread and the worm-generated traffic rate increases steadily; second, the worm propagation is mature
8 When p is so large (p ≥ 0.9) that no packet is actually delivered d d successfully, Tb depends only on the starting time of the bandwidth saturation, and follows uniform distribution in [Th − Tk , Th ]. We skip this trivial case in the following sections.
9
4
10
Empirical mean
facts: (1) The lifetime decreases faster than the exponential way and hence it is supexponential; (2) As pd increases, the lifetime tends to be shorter. These results are intuitively right. This is because with large pd , the majority of the packets are dropped, the BGP session also experiences extremely harsh messages loss, and tends to terminate promptly.
p =0.3 d p =0.4 d p =0.6 d p =0.8 d
3
10
0
10
qlen=1000,p =0.8
2
d
10
0
200
400 600 Queue size (unit:pkts)
800
1000
CCDF
−1
10
(a) 10Mbps link
qlen=75,p =0.8 d
qlen=75,p =0.95 d
8
10
qlen=1000,pd=0.95
7
10
−2
pd=0.3 pd=0.4 pd=0.6 pd=0.8
50
100
150
200
250
Empirical variance
10
300
BGP lifetime:T
d
Fig. 10. BGP session lifetime deviates from the exponential distribution when pd is large.
6
10
5
10
4
10
Fig. 11 demonstrates the variation of the lifetime distributions, as pd increases. The empirical mean is approximately the square root of the empirical variance in the three pairs of the curves that correspond to pd equals 0.3, 0.4, and 0.6, respectively. This fact is a norm for the exponential distributions. However, when pd = 0.8, the mean is over 100, but the variance is only around 2000. This shows that when pd is large, the distribution of the lifetime deviates from the exponential distribution and tends to be supexponential. Recall that in the TCP saturation with random RTT, the lifetime distributions remain exponential for very large number of flows and do not turn to supexponential. The reason why the supexponential pattern does not appear in TCP case is that for TCP flows, pd usually cannot be too large and stay large for a long time due to TCP’s congestion control scheme. If pd is large, TCP connections shrink the congestion window multiplicatively, the retransmission timers are set to large values, and some connections are even dropped. All these factors make pd decrease from the large value promptly (Fig. 21). From Fig. 9(b) and Fig. 11, we notice that the impact of queue size on the lifetime is very small. The most influential factor in determining the BGP lifetime is the amount of the UDP traffic, whose influence can be reflected by changing pd in the figures. 2) Worm propagation Traffic: In order to simulate the impact of worm propagation process on the BGP lifetime, we use the worm traffic model described in Section III-B. The worm contact period ∆T is set to be 30 seconds. In simulations, the start time of each UDP source is scheduled according to Equation 3, that is, the j th source starts at time (n−1)j ∆T nβ ln n−j , where n is the total number of hosts in the domain, and n equals 500 in our simulations. The CCDF’s of the BGP lifetime are shown in Fig. 12. Again, the distribution of Td can be approximated by expo-
3
10
0
200
400
600
800
1000
Queue size (unit:pkts)
(b) 10Mbps link Fig. 11. Empirical mean and variance of BGP session lifetime in UDP saturation (constant bit-rate).
nential distributions: S(t) = P [Tb > t] = e−λ(t−µ) From the figures, we observe that the rate parameter λ of the lifetime distribution is mainly influenced by the matured packet drop probability p∗d only. The transient stage during the worm propagation does not change the type of the lifetime distribution. Moreover, the transient stage does not has much impact on the shape of the distribution either. In Fig. 12(b), it is shown that the λ’s of the two curves, under different worm contact rates β’s, are almost the same. Furthermore, if β goes to ∞, the worms infect all hosts instantly, and then this case is equivalent to the constant bit-rate UDP saturation scenario. From Fig. 9(a), we can see that the λ is 0.0022, which is consistent with the results shown in Fig. 12(b). Therefore, the contact rate β only influences the parameter µ, and has nothing to do with λ. The impact of contact rate β can also be observed from Fig. 13, which shows that as β increases, the mean of BGP lifetime decreases. In addition, pd is still the dominant factor in affecting the BGP lifetime, which reflects the impact of the UDP traffic volume. C. Summary Qualitatively speaking, The lifetime distribution is determined by the property of pd . In the scenario of UDP saturation, if pd is not large, Tb follows exponential distribution. With respect to large pd , the distribution of Tb deviates from the 10
0
10
V. F ITTING THE D ISTRIBUTION OF BGP S ESSION L IFETIME p* =0.4,λ=0.0024,µ=385 d
To refine our empirical study of the BGP session lifetimes, we provide a quantitative analysis in this section. Specifically, based on our previous observations in Section IV, we present three models to fit the distributions of the BGP session lifetime. The adopted procedures include: (1) use Most Likelihood Estimation (MLE) to estimate the parameters of the proposed models; (2) apply the Kolmogorov-Smirnov test[15] on the empirical CCDF and the proposed fitting models to check whether or not the models are appropriate. Although the scenario of TCP saturation with homogeneous RTT provides us more insight into the lifetime distribution, it is unlikely to happen in practice. Thus, in what follows, we mainly focus on the UDP saturation and the TCP saturation with random RTT’s. ˆ is the estimated survival function from one of Suppose S(t) the three models, and S(t) is the empirical survival function ˆ from the sample data. Hypothesis H = 0 means that S(t) is accepted to be the estimation of the survival function for the samples; otherwise, H = 1. The K-S test statistic is ˆ i ) . kss = maxi S(ti ) − S(t
CCDF
−1
10
p* =0.6,λ=0.0111,µ=359 d
−2
10
0
500
1000
1500
2000
2500
BGP lifetime:T
b
(a) 10Mbps link, qlen = 75, and β = 0.002 0
10
β=0.001,λ=0.0025,µ=604
−1
CCDF
10
β=0.004,λ=0.0026,µ=253 −2
10
0
500
1000
1500
2000
ˆ S(t) is accepted, i.e., H = 0, only if kss is smaller √ than a critical value. In our test, the critical value is 1.36/ n [15], which offers the significance level of 0.059 . Besides kss, we also define the average error ξ between the estimated function and the empirical function as follows: n 1 ˆ i ) . ξ= S(ti ) − S(t n i=1
2500
BGP lifetime:Tb
(b) 10Mbps link, qlen = 75, and p∗d = 0.4 Fig. 12.
CCDF of BGP lifetime in worm propagation traffic.
4
10
p*d=0.4 p* =0.6 d p* =0.8
Empirical mean
d
A. Distribution Models for BGP Session Lifetime Based on the CCDF study in Section IV, we propose three fitting models for BGP session lifetime distributions. The first model is the shifted exponential distribution; the second one is a hybrid model combing a uniform distribution and an exponential one; the third one is the Weibull distribution. 1) Shifted Exponential Model (SEM): The results in Section IV show that in many cases the CCDF of the BGP session lifetime Tb follows an exponential way. We also notice that the CCDF of the lifetime has a positive shift from the zero, i.e., the minimal value of Tb is greater than zero. Recall that Tb is defined as the time interval from the beginning of the saturation to the expiration of the Hold Timers. Because the KeepAlive messages are sent to the peers every Tk seconds, and the Hold Timers are reset once the KeepAlive messages are received, the lifetime Tb is at least Th − Tk , which is the smallest value that Tb can take. Therefore, the straightforward way to fit the BGP session lifetime distribution is a Shifted Exponential Model (SEM):
3
10
2
10 0.5
1
1.5
2 2.5 Worm rate:β
3
3.5
4 −3
x 10
Fig. 13. Empirical mean of BGP session lifetime in worm propagation traffic.
exponential distribution and its tail becomes lighter. The worm propagation process basically only imposes a shift to the distribution function (the µ item), and its influence on the shape of the distribution is not significant. In TCP bandwidth saturation, if every TCP connection has randomly generated RTT, the lifetime is approximately exponentially distributed, which corresponds to the scenario that different TCP connections may possess different RTT’s. However, if every TCP connection has the uniform RTT, the lifetime distribution follows power-law. We conjecture that this property is resulted from the synchronization among the TCP connections that have the uniform RTT.
S(t) = e−λ(t−b) ,
(5)
where b is the shift parameter, and λ is the rate. 9 A significance level of 0.05 means that the probability of deciding H = 1 while the actual value holds 0 is 0.05.
11
TABLE III F ITTING THE BGP LIFETIME DISTRIBUTIONS IN TCP TRAFFIC
The rate parameter λ and shift parameter b can be estimated based on n lifetime samples {ti } from the simulations using the Most Likelihood Estimation technique. Without loss of generality, we assume ti is sorted in an increasing order (ti ≤ ti+1 , 1 ≤ i < n). The first r elements in {ti } are the lifetime samples of BGP sessions that break during the simulation. The remaining elements stand for the truncation time Ts , which means that n − r BGP session lifetime samples exceed the total simulation time, and thus the real lifetime samples are not available. Thus, the likelihood function reads: r n � � λe−λ(ti −b) e−λ(Ts −b) L(λ, b) = i=1
rtt
0.03
i=r+1
It is easy to see that there is no nontrivial b to maximize the above function, and we choose b∗ = min(ti ). Given b, L is a ∗ concave function of λ. By solving ∂L ∂λ = 0, we obtain λ that maximizes the likelihood function L. �r
−1 (Ts − b)(n − r) i=1 ti −b+ λ∗ = (6) r r
0.12
Models SEM
RSEM
WM
pd 0.2 0.4 0.6 0.8 0.2 0.4 0.6 0.8 0.2 0.4 0.6 0.8
α 0.8854 1.067 1.291 1.676
b/b1 135.7 101.8 62.35 61.69 135.7 202.3 173.4 128.9 135.7 101.6 61.57 59.02
kss 0.06104 0.06523 0.1706 0.1772 0.06114 0.07352 0.08019 0.06125 0.04904 0.08098 0.09808 0.03639
ξ 0.02521 0.02608 0.06227 0.08726 0.02463 0.02438 0.02737 0.02842 0.02282 0.02891 0.04213 0.01092
b/b1 98.54 68.46 63.92 241.4 134.0 141.1 98.53 68.09 63.33 107.8 99.69 62.01 161.7 210.2 204.6 107.8 99.68 62.00
kss 0.03986 0.04774 0.09567 0.04568 0.04222 0.06223 0.04409 0.04545 0.05666 0.1118 0.1050 0.08531 0.1121 0.1096 0.09296 0.03857 0.06090 0.08088
ξ H 0.01499 0 0.01421 0 0.03185 1 0.01863 0 0.01010 0 0.01562 0 0.01540 0 0.01339 0 0.01801 0 0.04877 1 0.05369 1 0.03848 0 0.04894 1 0.05785 1 0.03601 0 0.01090 0 0.02170 0 0.03775 0
Empirical CCDF SEM RSEM WM −1
CCDF
10
−2
10
−3
10
10M BPS LINK . qlen = 75. K-S SIGNIFICANCE LEVEL IS 0.05. λ ×10 0.6000 21.79 48.09 155.6 0.5986 23.32 64.83 303.0 1.931 14.05 9.117 7.219
α 0.9731 1.053 1.1660 0.8172 0.8249 0.9832
0
TABLE II F ITTING THE BGP LIFETIME DISTRIBUTIONS IN UDP TRAFFIC
−4
Models conn λ ×10−4 500 7.513 SEM 1000 14.80 2000 23.19 500 7.817 RSEM 1000 15.45 2000 25.32 500 9.223 WM 1000 10.26 2000 7.924 500 1.523 SEM 1000 4.360 2000 8.643 500 1.524 RSEM 1000 4.428 2000 9.197 500 8.306 WM 1000 18.67 2000 9.808 10
The detailed results of fitting SEM and K-S test are shown in Table II and III. Due to space limitations, we only present the results when qlen equals 75. The other cases have similar results and lead to the same conclusions.
SATURATION .
T1 LINK . qlen = 75. K-S SIGNIFICANCE LEVEL IS 0.05.
SATURATION .
−4
10
H 0 0 1 1 0 0 0 0 0 0 0 0
50
100
150
200
250
300
350
BGP lifetime: T
b
Fig. 14. CCDF test of UDP saturation. 10mbps link, pd = 0.8, and qlen = 75. The empirical CCDF shows a concave down pattern.
uniform distribution, we envision the shift parameter b in the lifetime distribution to be a uniformly distributed random variable, instead of treating it to be deterministic. Thus, we have the following model. 2) Randomly Shifted Exponential Model (RSEM): We model the BGP session lifetime by summing a uniformly distributed random variable b and an exponential random variable κ: Tˆb = κ + b, (7)
We observe that SEM performs well (smaller kss and ξ) in UDP saturation when the packet drop probability pd is not very large. In the first two cases, pd = 0.2 or 0.4, the fitted SEM model is accepted by the K-S test. However, when pd is larger than 0.6, the errors increase considerably. While, for the TCP saturation, SEM does not provide satisfactory performance, especially when the congestion level is either too high (small rtt and large conn) or too low (large rtt and small conn). In order to demonstrate the cases where SEM does not perform well, we show an example of the empirical CCDF and the fitted curves in UDP saturation in Fig. 14. Due to the heavy bandwidth saturation (pd = 0.8), the empirical CCDF (the staircase curve in the figure) is a concave down curve, deviating from the linear pattern, and thus SEM fails to match it. Since the empirical CCDF shows a concave down pattern in severe UDP saturation, which resembles the behavior of
where κ and b are independent, κ follows exponential distribution with rate λ, and b is uniformly distributed in [b0 , b1 ]. b0 equals Th − Tk , which is the minimum value of the BGP session lifetime. b1 and λ are the parameters to be estimated from the lifetime samples. It is straightforward to derive the BGP session survival function from Equation 7 as follows: � 1 λb1 − eλb0 )e−λt : if t ≥ b1 λ(b1 −b0 ) (e S(t) = 1 −λ(t−b0 ) [1 − λ(t − b ) − e ] : if b0 ≤ t < b1 , 1 λ(b1 −b0 ) (8) and the density function of the session lifetime is � 1 λb1 − eλb0 )e−λt : if t ≥ b1 b1 −b0 (e f (t) = (9) 1 −λ(t−b0 ) ] : if b0 ≤ t < b1 . b1 −b0 [1 − e 12
In order to estimated λ and b1 , the likelihood function is defined as follows: L(λ, b1 ) =
r �
f (ti )
i=1
n �
Similar to RSEM, in the Weibull model, we have to take numerical methods to find the values of λ∗ , α∗ , and b∗ , such that L is maximized. The results of Weibull model are shown in Table II and III. WM can approximate the BGP session lifetime well in all scenarios, and the errors are acceptable in K-S test. In Fig. 14 and 15, WM fits the distribution with satisfactory precision when the survival function is either concave up or concave down. Furthermore, we compare the fitting errors of the three models in Fig. 16. We treat SEM as the base case, and show the ratio of the fitting errors of RSEM and WM to the error of SEM. In general, RSEM and WM outperform SEM. Specifically, (1) in UDP saturation (Fig. 16(a) and 16(b)), SEM is comparable to the other models when the pd is relatively small; for all pd ’s, RSEM and WM perform roughly the same, but RSEM is a little better. (2) In TCP saturation (Fig. 16(c) and 16(d)), when the TCP connection number is not too small, the normalized fitting errors of WM and RSEM are close to each other; when the number of connections is around 1000, SEM has similar performance as RSEM and WM. In the next section, we discuss the underlying reasons that cause these performance differences for the models.
S(Ts ).
i=r+1
In general, we rely on numerical methods to find λ∗ and b∗1 , such that L is maximized. However, in a special case, where b1 is known and b1 ≤ ti ≤ Ts for all i, λ∗ can be calculated analytically: � ti /n − b0 1 ln �i . λ∗ = b1 − b 0 i ti /n − b1 The fitted results of RSEM model are shown in Table II and III. We can say that, compared with SEM, RSEM fits all cases of UDP bandwidth saturation well, and the model is accepted by the K-S test. Fig. 14 also demonstrates that RSEM fits the survival function nicely even when the packet drop probability is large. In TCP saturation, from Table III, we observe that RSEM performs well when the congestion level is high (large conn and small rtt). When the congestion level is low (small conn and large rtt), the fitting result is poor. We can also see this in Fig. 15, where 5000 TCP connections are simulated in a link of 10Mbps. Due to the large link capacity, the congestion level is low, and the empirical CCDF has a concave up pattern, and both RSEM and SEM fail to track this pattern. This motivates us to look for more flexible models.
B. Change of the Distribution of BGP Session Lifetime From the previous discussion, by applying MLE and the KS test, we know that WM can precisely fit the distribution of BGP session lifetime in almost all scenarios, while the exponential distribution based models, SEM and RSEM, are acceptable only in some of the cases. In this section, we seek to explain the reasons why this happens by discussing the properties of some important parameters in the lifetime distribution under different bandwidth saturation scenarios. 1) Shape Parameter α: In Section IV, we show that the tail of the lifetime distribution deviates from the exponential 2 is function in some scenarios. In WM, when α > 1, d ln(S(t)) dt2 smaller than zero, and S(t) is concave down in the CCDF test; otherwise, it is concave up. Thus, the presence of the shape parameter α in WM is the essential reason why WM can fit the lifetime distribution better than the other two. From Equation 5 and 10, we can see that SEM is a special case of WM, with α = 1. SREM is also an exponential model when t > b1 , as shown in Equation 8. However, when t ∈ [b0 , b1 ), the uniform component makes the distribution to be concave down. Specifically, we have
0
10
Empirical CCDF SEM RSEM WM −1
CCDF
10
−2
10
−3
10
−4
10
0
0.5
1
1.5
2
2.5
BGP lifetime: Tb
3 4
x 10
Fig. 15. CCDF test of TCP saturation. 10mbps link, conn = 5000, rtt = 0.03 and qlen = 75. The empirical CCDF shows a concave up pattern.
3) Weibull Model (WM): So far, we find that SEM and RSEM perform well in some cases, where the real survival functions are either linear or concave down. On the other hand, they are not good candidates in fitting real survival functions with a concave up pattern. Thus, we turn to a third model for BGP session lifetime — Weibull distribution, which is more flexible than the previous two models. The Weibull model is defined as follows: S(t) = e−λ(t−b) , α
� � � � d2 ln (S(t)) = A λ2 e−λ(t−b0 ) − 1 − λ3 (b1 − t) e−λ(t−b0 ) < 0, 2 dt
�−2 � where A = 1 + λ(b1 − t) − eλ(t−b0 ) > 0. Thus, S(t) in RSEM is concave down in the CCDF test, and it corresponds to the shape parameter α greater than or equal to 1.0. We thus conclude that the limitations of SEM and RSEM come from their linear or concave down shape in CCDF, while WM is much more flexible and its shape parameter can be tuned to fit linear, concave up or concave down distribution functions. By fitting WM to the empirical CCDF’s of all simulation scenarios, we can study how the shape parameter changes
(10)
where α is the parameter to control the shape of the survival function. The MLE function is L(λ, α, b) = λr αr e−λ
�n
i=1 (ti −b)
α
r �
(ti − b)α−1 .
i=1
13
0.4
0.2
0.6
0.4
0.2
0.2
0.3
0.4 0.5 0.6 0.7 Packet drop probability pd
0.8
0 0.1
0.9
0.3
0.4 0.5 0.6 0.7 Packet drop probability p
0.8
0.9
d
(a) UDP and 10mbps link.
1.8
0
0.4
0.2
500
1000 1500 2000 TCP connections conn
3000
0
500
1000 1500 2000 TCP connections conn
3000
(d) TCP, T1 link and rtt = 0.03.
Fig. 18 shows the relationship between β and b. As β increases, the time, which is needed for the worm traffic to be saturated, decreases accordingly, and this leads to smaller β. p∗d also plays a role in affecting b. By studying the fitted results, we find that the relationship between b and β can be approximated by a power-low equation: b = aβ −η + c, where a, η and c are determined by network configurations. In determining the values of these parameters, given β and p∗d , we can calculate the time, tb , needed for the packet drop probability to reach a value p�d . From our experimental study, we notice that by choosing an appropriate p�d the shift parameter b can be approximated by tb , especially when p∗d is large. By studying various cases, we obtain the following empirical function to characterize the quantitative relationship between b, β and p∗d nicely. � � n(1 − p∗d ) ∆T 2Th − Tk b= ln (11) + βn p∗d − p�d 2
1.25
1.7
1.2
1.6
Shape α of lifetime distribution
Shape α of lifetime distribution
0.4
0.6
Normalized fitting errors of RSEM and WM averaged on qlen = 75, 250, 500, and 1000.
under various network configurations. The results are shown in Fig. 17. In UDP saturation (Fig. 17(a)), α varies between 0.9 and 1.0, when the packet drop probability is small. Since α is close to 1.0, SEM and RSEM fit the lifetime distribution precisely. On the other hand, when the congestion level is higher, α increases noticeably, because high congestion level leads to smaller lifetimes and lighter tails. Since SEM can only represent distributions with shape parameter 1.0, it can not provide satisfactory fitting when pd is too large. However, RSEM still performs well in this scenario, because the uniformly distributed component enables it to accommodate larger shape parameters (α > 1).
1.5 1.4 1.3 1.2 qlen=75 qlen=500 qlen=1000
1
rtt = 0.03 rtt=0.12
1.15 1.1 1.05
where p�d = 0.3 in our experiment. The right hand side of Equation 11 consists of two part. The second term is the normal amount of shift, as has been explained in the model of SEM. The first term is the time delay for worm traffic to reach the drop probability p�d . In Fig. 18, the dotted curves are (b) TCP, T1 link and rtt = 0.03. α’s ∗ are averaged on qlen = 75, 250, 500 generated by the above empirical equation with pd = 0.4 and 0.8, respectively. The figure shows that Equation 11 gives a and 1000. good approximation for b. 1
0.95
0.9
0.9 0.8 0.2
0.6
(c) TCP, T1 link and rtt = 0.03.
(b) UDP and 10mbps link.
Fig. 16.
1.1
0.8
0.2
0.2
RSEM WM
1
0.8 Normalized kss
0.6
RSEM WM
1
0.8 Normalized ξ
Normalized kss
0.8
0 0.1
RSEM WM
1
Normalized ξ
RSEM WM
1
0.3
0.4 0.5 0.6 0.7 Packet drop probability pd
(a) UDP, 10Mbps link.
Fig. 17.
0.8
0.9
0.85 500
1000
1500 2000 TCP connections conn
2500
3000
Shape change of lifetime distribution.
1100 Shift parameter b of lifetime distribution
The behavior of BGP sessions in TCP saturation is more complex. Because of the conservative packet transmission and the connection drops of the TCP sessions, the packet drop probability in TCP saturation seldom reaches a large value. Thus, the shape parameter in TCP saturation is smaller than that of UDP saturation. This fact is observed in Fig. 17(b). When the congestion level is high (for example qlen is small, rtt is small, conn is large, or link capacity is low.), the shape parameter is close to or greater than 1.0, and thus RSEM can provide satisfactory fitting for the lifetime distribution. Due to its simplicity in characterizing the shape parameter of the lifetime distribution, SEM can only perform well in some cases. 2) Shift Parameter b: Weibull distribution can also model the scenario of worm propagation precisely. Due to the space limitation, we do not show the K-S test results in this paper. We focus on investigating the impact of worm propagation rate β on the shift parameter b in WM.
*
1000
pd=0.4
900
pd=0.8
*
800 700 600 500 400 300 200 100 0.5
Empirical shift function 1
1.5 2 2.5 3 Worm propagation rate β
3.5
4 −3
x 10
Fig. 18. Shift parameters of lifetime distribution wrt. worm propagation rate β (10Mbps link and qlen = 75). The dotted curves are the empirical functions for the shift parameters.
Summary: Our findings on the models for the BGP session lifetime are summarized in Fig. 19. WM is the most effective model among the three, and it can fit the lifetime distribution 14
in almost all cases we considered. The only exception is the TCP saturation with uniform RTT. In this scenario, we have shown in Section IV that the tail of the lifetime tends to be power-law (can be fitted by Pareto distributions). RSEM can be used for severe TCP saturation, which is caused by a large number of TCP connections, small link capacity, small queue size or small RTT. In UDP saturation, without considering worm propagation process, RSEM provides satisfactory performance. The usage of SEM is limited to the cases where the UDP bandwidth saturation is not severe.
(0, 0)
(0, 1)
(0, 2)
(1, 1)
(1, 2)
(0, t0 ) (t0,t 0) (1, t1 ) (t1,t 1)
(2, 2)
END (2, t2 )
(t2,t 2)
(]-1, ]-1)
(]-1, t]−1 )
(], t ] )
TCP Saturation
Random RTT
UDP Saturation
Uniform RTT
Worm
Power-law tail
WM
WM
Heavy Saturation
Fig. 20. Markov chain for BGP U2D time. The dotted arrows stand for packet loss transitions, which happen with probability pd ; the solid arrows stand for transitions of successful packet deliveries, which happen with probability 1 − pd .
Large pd Small pd WM, RSEM
WM, RSEM, SEM
message is initially transmitted. s is the current TCP backoff counter, when the BGP message is transmitted or thereafter retransmitted. Let us denote the maximum value of backoff counter as ζ. Thus, s0 ranges from 0 to ζ. Given R0 , Rm and Hold Timer period Th , the range of s has to satisfy the following two constraints: 1) s� 0 ≤ s ≤ ζ, s i 2) i=s0 min(Rm , 2 R0 ) < Th . Obviously, the maximum value of s depends on s0 . We thus denote the maximum value of s, given s0 , as ts0 , which is also shown in Fig. 20 and can be obtained from the above two constraints. On each packet loss, s increases by one. When the maximum value ts0 is exceeded, the state transits to ‘End’, i.e., the Hold Timer expires. On the other hand, if the packet is transmitted for the first time and it is successfully delivered, the Hold Timer and backoff counter are reset, and the state transits from (i, i) to (0, 0). If the packet is retransmitted successfully, the Hold Timer is cleared, but the backoff counter is unchanged, and therefore the state transits from (i, j) to (j, j) (i �= j). Based on this Markov model, the BGP U2D time Tu2d is the duration of an excursion from state (0, 0) to ‘End’, which can be further calculated easily by solving a set of linear equations. With the knowledge of Tu2d , we next discuss how to calculate the BGP session lifetime Tb .
WM, RSEM
Fig. 19.
Models of BGP session lifetime in different scenarios.
VI. E XPECTED L IFETIME OF BGP S ESSIONS WITH C ONSTANT pd In previous sections, we focus on studying the lifetime distribution of BGP sessions. In practice, it is also very important to understand the characteristics of the average value of the lifetime and its relationship with network configurations, especially TCP retransmission behaviors. As has been discussed in Section I, it is difficult to model Tb and its expected value precisely. In this section, we make two assumptions to make the analysis of the expected lifetime tractable: (1) the packet drop probability is a fixed number; (2) there are always BGP messages ready for transmission. These assumptions are also used by the analysis in [7], but in this paper, we consider more realistic TCP retransmission behavior and extend the U2D time to the lifetime by using the empirical study results introduced in previous sections. A. Modeling the U2D Time The U2D time Tu2d is defined based on a single Hold Timer and it denotes the time interval from the beginning of the network congestion to the happening of the Hold Timer expiration event. Tu2d is different from the BGP lifetime Tb defined in our paper. Tb is based on two Holder Timers related to one session, and upon either expiration of the two timers, the session fails. We employ a Markov model for investigating the U2D time of BGP sessions. We take into consideration more realistic TCP retransmission behaviors than [7], and the simulation results, which will be presented later, show that our model can predict the U2D time more precisely. The proposed Markov chain is described in Fig. 20. Except for the ‘End’ state, each state is a two-tuple (s0 , s). s0 is the initial value of the TCP backoff counter, when a BGP
B. Modeling the Expected Lifetime Tb The BGP U2D time only characterizes the time when the single Hold Timer expires. In reality, a BGP session fails when the Hold Timer of either routers expires. Let � stand for the BGP U2D time of the two Tu2d and Tu2d routers. According to our definition, the BGP lifetime is the � ). minimum of the two U2D times, i.e., Tb = min(Tu2d , Tu2d Since the two BGP routers detect the session failure events � can also be taken as independent independently, Tu2d and Tu2d variables. We can calculate the BGP lifetime Tb from the U2D time. Based on the results in Section IV and Section V, the BGP session lifetime can be characterized by Weibull 15
distribution, which provides a way to relate the U2D time with the lifetime. Lemma 1: If the BGP U2D time Tu2d follows a Weibull distribution with shape parameter α and shift parameter b, the relationship between the expected lifetime and the expected U2D time is
overestimation is due to the ignorance of the realistic control scheme in TCP retransmission backoff counter. One issue worth mentioning is that the expected BGP lifetime with constant packet drop probability is not exactly the same as the expected BGP lifetime with the UDP induced bandwidth saturation. This is because, in UDP saturation, the packet drop probability is modulated by the instantaneous network conditions. Therefore, although the average drop probability is fixed, each specific BGP packet experiences different dropping procedures. This fact may lead to differences between the real UDP saturation and the fixed packet drop probability adopted in this model. Despite the existence of these differences, the proposed model still provides us valuable hints in understanding the BGP session lifetimes.
1
E [Tb ] = 2− α (E [Tu2d ] − b) + b. (12) Proof: Suppose the distribution of the U2D time is α FTu2d (t) = 1−e−λ(t−b) . The distribution of the BGP lifetime is FTb (t), and we have � FTb (t) = P r [min(Tu2d , Tu2d ) < t]
= =
� 1 − P r [Tu2d > t] P r [Tu2d > t] α −2λ(t−b) 1−e
Therefore, the expected lifetime Tb is � ∞ α E [Tb ] = b + e−2λt dt 0 � ∞ α 1 −α = b+2 e−λx dx 1
D. Impact of TCP Retransmission on BGP Sessions The lifetime of BGP sessions is essentially determined by the maximum number of packet retransmissions that can be carried out before the Hold Timer expires. After a KeepAlive message is delivered, the probability that the Hold Timer expires in the next Th seconds decreases as the number of TCP retransmissions increases. In theory, the failure probability of BGP sessions approaches zero asymptotically, as the number of TCP retransmissions tends to infinity. Thus, by making TCP retransmit packets more aggressively, we can improve the robustness of BGP sessions. Although TCP can not achieve infinite number of retransmissions in a finite time period, we can tune TCP’s retransmission behavior slightly, by changing the maximum backoff counter ζ and the maximum RTO Rm , so as to obtain significant improvement for the BGP session lifetime. Fig. 21(b) shows the impacts of Rm and ζ on the U2D time of BGP sessions when packet drop probability is 0.4. A larger ζ leads to more TCP retransmissions and thus increases BGP U2D time. However, when Rm is large, ζ’s impact on the BGP U2D time is not significant. For example, if Rm is set to be the default value, 64 seconds, the figure shows that the BGP U2D time changes little as ζ increases. The reason is that due to the large Rm , a few number of retransmission attempts take longer time than Th , and the Hold Timer expires. Thus, the BGP session is dropped far ahead of the time instance when the TCP retransmission counter reaches its limit ζ. Therefore, ζ’s impact is little. Similarly, when ζ is small (e.g., the default ζ of TCP is 12), the impact of Rm is not significant either. This is because, whatever Rm is, before the Hold Timer expires, ζ has been reached, and thus only ζ matters here. The default working point of BGP and TCP is also shown in Fig. 21(b). Obviously, there is a large room of improvement for BGP session lifetime. Based on the above observations, we can increase the BGP session U2D time and the lifetime by adjusting the two TCP parameters, ξ and Rm . Fig. 21(c) compares the U2D time of the default TCP settings with the U2D time when Rm takes different values and ζ = 30. Specifically, by decreasing Rm from its default value 64 seconds to 8 seconds, the robustness of BGP sessions is improved by multiple orders of magnitude. In most of cases (pd ≤ 0.7), the improvement of the BGP
0
= b + 2− α (E [Tu2d ] − b) . According to the study in previous sections, the shift parameter b is Th − Tk , i.e., the minimum value of Tb . The shape parameter α is 1.0 or a little bit larger than 1.0. As an approximation for the expected lifetime, we take α = 1.0, and thus E[Tu2d ] + Th − Tk . (13) E[Tb ] � 2 Therefore, we can calculate the expected U2D time E[Tu2d ] by the previous Markov model, and then calculate the expected lifetime using the result of this lemma. C. Model Validation In this section, we validate the model by comparing the results of the expected BGP lifetime model with the simulation results. We implement a queuing module in SSFNet simulator, which drops any incoming packet with a specified probability pd . Thus, we can obtain many lifetime samples of a BGP session subject to constant packet drop probability. The results are summarized in Fig. 21(a). The analytical result is derived from Equation 12, and α is obtained by the MLE based on the simulated samples. The figure shows that the analytical results fit the simulation results very well. Moreover, we calculate the BGP session lifetime by using the simplified Equation 13, and the results are quite close to those calculated using Equation 1210 . In order to compare the model in [7] with ours, we calculate the U2D time by using the model in [7] and the session lifetime by Equation 12. The results are plotted with the legend ‘simple model’ in Fig. 21(a). It is shown that the simple model overestimates the expected lifetime and U2D time considerably, especially when the packet drop probability is small. The 10 We
do not show this curve in the figure to make the picture clearer.
16
5
Average Lifetime and U2D time of BGP sessions.
10
Analytical U2D time Analytical Tb Analytical U2D time (simple model) Analytical Tb (simple model) Tb from simulation results
4
10
3
10
2
10
1
10 0.1
0.2
0.3
0.4 0.5 0.6 0.7 Packet drop probability pd
0.8
0.9
(a) Model validation. 14
10
R =64, ζ=12 (default setting) m R =4, ζ=30 m R =8, ζ=30 m R =10, ζ=30 m R =14, ζ=30
8
12
Average U2D time of BGP sessions
Average U2D time of BGP sessions
10
6
10
4
10
2
10 40
10
10
m
10
8
10
6
10
4
10 30
TCP maximum 20 backoff counter ζ 10
0
64
10
1
default working point
10
TCP maximum RTO
2
10
R
0.3
0.4
0.5 0.6 0.7 Packet drop probability p
0.8
0.9
d
(b) Impact of TCP parameters on the expected BGP U2D time. pd = 0.4 Fig. 21.
0.2
m
(c) Increasing BGP lifetime by tuning TCP parameters.
Expected lifetime of BGP sessions and U2D time. Th = 90 sec and Tk = 30 sec.
session lifetime is significant, as shown in Fig. 21(c). Our studies can thus serve as the directions on how how to adjust the parameters and how much reliability gain can be achieved. Setting Rm and ζ in TCP module is a trivial job. Thus, the induced implementation overhead in making this improvement is minor. Furthermore, the behavior of TCP is not affected if the congestion does not happen. We also argue that the incurred message overhead due to the decrease of Rm and the increase of ζ is negligible. The reason is that only the TCP modules on BGP routers are modified, and they generate a very small amount of extra traffic in Internet.
most of the cases the BGP lifetime approximately follows exponential distribution or Weibull distribution. However, in the TCP bandwidth saturation with uniform RTT, the lifetime distribution has a power-law tail. We also refine a previously proposed model [7] on the expected BGP session U2D time by considering more realistic TCP retransmission behaviors, which improves the accuracy in predicting the U2D time. Moreover, we propose a method to calculate the expected BGP lifetime based on the results in the distribution study and investigate the impact of TCP parameters on BGP session robustness. We show that by changing TCP parameters a little, the expected BGP session lifetime can be dramatically increased. In general, our research results provide the essential information in understanding the behaviors of BGP in the severe network circumstances, i.e., the bandwidth saturation. The findings in the paper provide instructive guidance in designing resilient Internet routing infrastructures.
VII. C ONCLUSION The reliability of BGP sessions is an important metric in evaluating the resilience of Internet routing infrastructure. In this paper, by using simulations and statistical methods, we study the packet drop probability and the BGP session lifetime under severe network congestion, which can be caused by TCP or UDP traffic. For both traffic, we characterize the behavior of the packet drop in the transient period and the long-term period respectively, by using fixed point model, epidemic model, and simulations. The distribution of the BGP session lifetime is studied systematically. By employing CCDF test and Kolmogorov-Smirnov test, we argue that in
R EFERENCES [1] Y. Rekhter and T. Li, A Border Gateway Protocol 4 (BGP-4). IETF RFC 1771., March 1995. [2] R. Malan and F. Jahanian, “An extensible probe architecture for network protocol performance measurement,” in Proceedings of ACM SIGCOMM, 1998.
17
[3] C. Labovitz, R. Malan, and F. Jahanian, “Internet routing instability,” IEEE Transaction on Networking, vol. 6, October 1998. [4] L. Xiao and K. Nahrstedt, “Reliability models and evaluation of internal BGP networks,” in Proceedings of IEEE INFOCOM, 2004. [5] L. Wang, X. Zhao, D. Pei, R. Bush, D. Massey, A. Mankin, S. F. Wu, and L. Zhang, “Observation and analysis of BGP behavior under stress,” in Proceedings of ACM SIGCOMM Internet Measurement Workshop, 2002. [6] M. Lad, X. Zhao, B. Zhang, D. Massey, and L. Zhang, “Analysis of bgp update burst during slammer attack,” in Proceedings of the 5th International Workshop on Distributed Computing, December 2003. [7] A. Shaikh, A. Varma, L. Kalampoukas, and R. Dube, “Routing stability in congested networks: Experimentation and analysis,” in Proceedings of ACM SIGCOMM, 2000. [8] N. Bailey, The Mathematical Theory of Infectious Diseases. Lubrecht & Cramer Ltd, 1975. [9] J. Padhye, V. Firoiu, D. F. Towsley, and J. F. Kurose, “Modeling TCP Reno performance: A simple model and its empirical validation,” IEEE Transaction on Networking, vol. 8, April 2000. [10] P. Tinnakornsrisuphap and A. M. Makowski, “Limit behavior of ECN/RED gateways under a large number of tcp flows,” in Proceedings of IEEE INFOCOM, 2003. [11] Cisco Systems Inc., “Output queue overflow on an interface,” in http://www.cisco.com/warp/public/650/43.pdf. [12] J. P. Klein and M. L. Moeschberger, Survival Analysis: Techniques for Censored and Truncated Data. Springer Verlag, 1997. [13] “Scalable Simulation Framework Network Models (SSFNet),” in http://www.ssfnet.org/homePage.html. [14] G. R. Wright and W. R. Stevens, TCP/IP Illustrated Volume 2 - The Implementation. Addison Wesley, 1995. [15] K. S. Trivedi, Probability and Statistics with Reliability, Queuing and Computer Science Applications. John Wiley & Sons, Inc., 2002.
18