Jul 13, 2009 - validating existing and future ring current models in terms of their ability to correctly represent ... behavior of lowâlatitude and midlatitude geomagnetic fluctuations. ..... bursty behavior directly induced by the solar wind. In this.
Click Here
JOURNAL OF GEOPHYSICAL RESEARCH, VOL. 115, A03215, doi:10.1029/2009JA014642, 2010
for
Full Article
Understanding bursty behavior in midlatitude geomagnetic activity James Wanliss1 and Vadim Uritsky2 Received 13 July 2009; revised 21 December 2009; accepted 27 January 2010; published 26 March 2010.
[1] We provide a new example of a natural system exhibiting statistical signatures of complex scaling behavior predicted by the contemporary theory of nonequilibrium phase transitions. We examine statistical properties of bursty multiscale energy dissipation in the inner magnetosphere of Earth based on the dynamics of the SYM‐H index, a global marker of low‐latitude geomagnetic fluctuations. We show that on average, and for time scales shorter than 2 h, temporal development of SYM‐H bursts follows an algebraic form consistent with the predictions from the theory of nonequilibrium phase transitions. Probability distributions of sizes and lifetimes of the activity bursts reveal no characteristic scales other than the scales imposed by technical limitations of the analysis. This behavior is observed for a wide range of SYM‐H burst durations starting from about 5 min up to 10–15 days. The power law exponents describing the probability distributions suggest that the main energy dissipation in the inner magnetosphere takes place because of large activity bursts such as major space storms as opposed to smaller activations whose contribution is less significant despite their much higher relative occurrence. The results obtained provide statistical evidence that the energy dissipation mechanisms associated with magnetospheric activity in the inner magnetosphere are essentially “scale‐free,” displaying dynamical and statistical self‐similarity. Our results can also be used for validating existing and future ring current models in terms of their ability to correctly represent the cross‐scale coupling effects in this system. They show what could be the first quantitative evidence for the same universality class as directed percolation in a natural system. Citation: Wanliss, J., and V. Uritsky (2010), Understanding bursty behavior in midlatitude geomagnetic activity, J. Geophys. Res., 115, A03215, doi:10.1029/2009JA014642.
1. Introduction [2] Energy dissipation in the terrestrial magnetosphere often follows an intermittent temporal pattern consisting of periods of high activity with sharply increased convection, particle bursts, impulsive enhancements of O+/H+ density ratio, compressional pulses, intensified fluctuations of field‐ aligned currents and other bursty processes, separated by periods of quiescence [Korth et al., 2003]. Bursty intermittency is evident in both in situ and ground observations [Hori et al., 2005], and has been observed under a wide variety of interplanetary conditions [Pulkkinen et al., 2007]. Although physical mechanisms of individual activity bursts in the inner magnetosphere have been investigated in numerous case studies, little is known about ensemble‐averaged statistical properties of these events.
1 Department of Physics and Computer Science, Presbyterian College, Clinton, South Carolina, USA. 2 Department of Physics and Astronomy, University of Calgary, Calgary, Alberta, Canada.
Copyright 2010 by the American Geophysical Union. 0148‐0227/10/2009JA014642
[3] The necessity of such statistical analysis is rooted in the fact that, in general, nonlinear systems with multiple spatially distributed sources of instability cannot be completely characterized in deterministic terms. A significant portion of information on the dynamics of such systems, which can be extracted by appropriate statistical physical methods of analysis, is contained in multiscale correlations of non‐Gaussian random variables. Some questions that can be addressed by this approach, and that have not been answered before, are: What is the characteristic temporal signature of midlatitude geomagnetic disturbances of various sizes? What are the relative contributions of small‐ and large‐scale disturbances to the overall energy dissipation in the inner magnetosphere? Is there a distinct characteristic scale indicating a dominant role for a specific dissipation mechanism? [4] These questions are the motivation of our work, and they led us to a number of novel results regarding the dynamics of energy dissipation in the inner magnetosphere. The numerical methods that we apply have been tested in previous statistical studies of high‐latitude magnetospheric disturbances [see, e.g., Consolini, 2002; Uritsky et al., 2003, 2006]. These studies were concentrated on various measures
A03215
1 of 9
A03215
WANLISS AND URITSKY: BRIEF REPORT
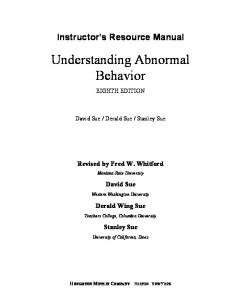
Figure 1. SYM‐H index for the year 2000 A.D. of activity bursts in local and global geomagnetic variations as well as on spatiotemporal development of auroral emissions. [5] In the above analyses robust power law statistical relations consistent with the dynamics of nonequilibrium systems undergoing transitions between multiple metastable configurations were obtained. The relations reported in these papers strongly suggested that the observed activity bursts have no dominating characteristic spatial, temporal or energy scales, and so the energy dissipation mechanisms associated with magnetospheric activity at high latitudes are essentially “scale‐free” [Uritsky et al., 2006]. Our analysis will show that similar scaling laws and relations, with a different set of power law exponents, govern bursty behavior of low‐latitude and midlatitude geomagnetic fluctuations. [6] The physics of the inner magnetosphere of Earth is significantly different from other magnetospheric regions, which is why there has been a trend to couple various models describing these regions. In terms of ground‐based observations there is a similar realization. There is not, for instance, a one‐to‐one correspondence between geomagnetic indices like AE and SYM‐H. Both these indices are global measures of geomagnetic disturbances in the magnetosphere. They are computed from convolutions of data from multiple ground‐based magnetometer stations that represent all longitudes. AE represents high‐latitude effects in that all its component magnetometer stations are in or near the auroral oval, a region of intense auroral activity caused primarily by precipitating protons and electrons. For this reason AE provides limited information about the behavior at lower‐latitude regions. [7] At low latitudes, closer to Earth’s equator, the plasma and electrodynamic coupling between the Earth and magnetosphere map along magnetic field lines to regions called the ring current and near‐Earth plasma sheet. Thus SYM‐H provides information related to those regions; like AE it is a global geomagnetic index but is constructed from data at low‐latitude magnetometer stations. The standard paradigm holds that driving by the solar wind injects particles into the inner magnetosphere. Their subsequent drift creates a symmetric ring of westward electric current encircling the Earth. Magnetic fluctuations due to this ring current reduce the
A03215
strength of Earth’s magnetic field, and are measured by SYM‐H. SYM‐H thus measures the horizontal magnetic field fluctuation near the geomagnetic equator and is partly reflective of perturbations in the ring current. It was recently shown that SYM‐H is operationally interchangeable with Dst [Iyemori, 1990; Wanliss and Showalter, 2006] the traditional low time resolution (1 h) index used to study energetics of the inner magnetosphere. [8] An example of SYM‐H data are shown in Figure 1, taken from the data set used in this study. The most prominent activity bursts represent space storms. These storms are global geomagnetic disturbances that result from the interaction between magnetized plasma that propagates from the Sun and plasma and magnetic fields in the near‐Earth space plasma environment. Space storms include a rich variety of complex plasma electromagnetic processes extending from the ionosphere into space, with the primary locus of activity being in the near‐Earth geospace environment [Baker et al., 1997; Li et al., 1997; Reeves et al., 1998]. In what follows we will study behavior of the low‐ latitude SYM‐H fluctuations to test the recent hypothesis of a global critical state of the inner magnetosphere [Wanliss and Weygand, 2007; Wanliss and Dobias, 2007].
2. Statistical Theory [9] Critical behavior in equilibrium systems is characterized by the propagation of long‐range correlations through the system through fine tuning of a control parameter. This shows that near the critical point, various systems tend to produce long‐range scale‐free correlations with universal statistical properties. The most familiar setting for discussion of critical system reconfigurations is phase transitions found in thermodynamic equilibrium. [10] Critical reconfigurations occur also in nonequilibrium situations such as the onset of convection in fluids. Models of market dynamics, population dynamics, epidemics, are also good examples, and references above suggest the magnetosphere may be party to a similar universality. The most uncomplicated explanation for scale‐invariant dynamics in driven disordered systems comes from the nascent theory of nonequilibrium critical phenomena. As mentioned, critical behavior is usually associated with the tuning of system parameters. In the so‐called self‐organized criticality (SOC) the scale‐free correlations usually associated with criticality appear to arise spontaneously. Searching for a specific trigger initiating explosive system change can therefore be a frustrating exercise, because there is no often no unambiguously defined trigger that is unique. Not only this, but systems in a SOC state are far from equilibrium and barely stable. They respond resiliently to driving by returning to a critical state. In the case of the ring current and inner magnetosphere there are driving processes (such as mass loading from the ionosphere) and quenching processes at play that contribute to generating such a state. It is important to remember that a demonstration of scale invariance at a point in parameter space does not explain scale invariance in nonequilibrium natural systems, or how the system is maintained at the critical point. [11] Dickman [1996] and Muñoz et al. [2001] developed a theory to characterize dynamical properties of critical reconfigurations (the so‐called avalanches [Bak et al.,
2 of 9
A03215
WANLISS AND URITSKY: BRIEF REPORT
1988]) occurring in a general class of nonlinear systems with many coupled degrees of freedom. It has been predicted that if N(t) is the average number of active avalanche sites (average area of excitation in the continuum limit), where t is the delay time measured from the initiation of each avalanche, then close to the critical point, and for delay times less than the time scale introduced by finite size effects, N ∝ t h. Similarly, if Ps(t) is the probability that an avalanche survives by this time, then Ps ∝ t −d. The power law exponents h and d are called spreading exponents [Muñoz et al., 2001]. One can also measure the size S of each avalanche, which is the total number of active sites contributing to the reconfiguration, and its lifetime T. In a nonequilibrium critical state such as SOC, there exists a relationship between the avalanche size and avalanche lifetime. Using the definition of d and h, it is easy to show that the average number of active site in the surviving runs which produced avalanches with T > t scales as t h+d. The characteristic size S of the event described by this lifetime is given by the time integral of this quantity, and therefore S ∼ T1+h+d (see Muñoz et al. [2001] for more details). Scaling laws similar to this expression are called scaling relations and play a central part in quantitative analysis of nonequilibrium critical systems [Paczuski et al., 1996; Marro and Dickman, 1999; Dickman et al., 2000]. [12] In this paper we wish to examine the extent to which the traditional avalanches of statistical physics, mentioned above, can be related to bursts of geomagnetic activity in the inner magnetosphere of Earth. To attain this goal, we apply the time series based version of the spreading exponent analysis introduced by Uritsky et al. [2001]. In this approach, temporal bursts in SYM‐H measurements are treated as manifestations of spatiotemporal spreading dynamics in the ring current system. Note, however, that due to the lack of spatial information, the scaling exponent obtained by this method can differ from actual scaling exponent describing the magnetospheric dynamics.
3. Data and Analysis Method [13] If the inner magnetosphere, whose globally averaged perturbations are to some extent represented by SYM‐H, is in or close to a critical state, then one should be able to recover the power law relations introduced above. We have tested this idea via analysis of SYM‐H fluctuations during January–December 2000, as well as solar wind data from WIND and ACE satellite missions. Solar wind data were propagated to the dayside bow shock at a nominal 17 RE using the Weimer et al. [2003] method. Both data sets were downsampled to a 5 min temporal resolution to allow for propagation errors. [14] We compared SYM‐H dynamics with a variable related to the magnetohydrodynamic version of solar wind qffiffiffiffiffiffiffiffiffiffiffiffiffiffiffiffi electric field, viz. VByz = Vx B2y þ B2z sin4(’/2), where the interplanetary magnetic field (IMF) components Bx, By, and Bz are in GSM coordinates, and ’ is the IMF clock angle. We have followed the methodology of Uritsky et al. [2001] and decomposed the SYM‐H and solar wind data into series of activity bursts. We define an activity burst (AB) to be a transient increase of the studied geomagnetic or solar wind time series above a specified constant activity threshold. In a
A03215
physical system the time interval between two bursts of activity is called a waiting time. For SOC‐like signals, there can be a wide range of thresholds in which the gradient of the power law portion of the burst lifetime distribution is essentially constant as demonstrated recently for SYM‐H [Wanliss and Weygand, 2007]. [15] We determined the lifetime, T = t2 − t1, and the total duration � = t2 − t0 for each AB, in addition to the AB size, R S = fT g (X(t) − L)dt, where L is the chosen threshold and the signal is from the set X(t) = {∣SYM‐H∣, VByz}. Here the lifetime is the time the data exceeds a certain threshold. The total duration is the time between two successive downward crossings of the threshold. We assume that X is related to the rates of energy dissipation and supply in the midlatitude magnetosphere. Indeed, the Dessler‐Parker‐Sckopke (DPS) relation [Dessler and Parker, 1959; Sckopke, 1966] shows that the magnetic disturbance produced at the center of a ring of current is directly proportional to the total energy of the drifting particles creating the current, DB = −m0URC/ 2pBERE3, where URC is the energy density in the ring current, BE is the equatorial magnetic field on the surface of the Earth (∼30,000 nT) and RE is the Earth’s radius. Thus we have URC ∝ ∣SYM‐H∣. Therefore, SYM‐H burst size is a representation of magnetic energy dissipation during a given time interval, a definition utilized by several previous studies [Metallinou et al., 2004; Ahn et al., 2002]. Since VByz is a solar wind power input parameter the size S is proportional to the magnetic flux the magnetosphere receives from the solar wind during the lifetime of a VByz burst. As discussed above, Dst is thought to provide some measure to estimate the ring current energy density. A word of caution is needed. This is because recent studies have indicated that it contains contributions from several sources other than the azimuthally symmetric ring current. For example, it is estimated that the tail current contributes about one quarter to the total of the horizontal magnetic field [Turner et al., 2000]. Skoug et al. [2003] show that the situation can be far worse; they present a case where Dst is almost completely driven by the tail current. It is thus necessary to note that it is not clear that Dst (or SYM‐H) provides a clear representation of the symmetric ring current [Campbell, 1996, 2004]. It is therefore safer to refer to the SYM‐H index as a general proxy of inner magnetospheric dynamics. [16] Our definitions of T and S are consistent with energy‐ based estimates of lifetimes and sizes of critical avalanches in “running” SOC models subject to continuous driving conditions [Hwa and Kardar, 1992]. Furthermore, in some sandpile models the number N of active elements is usually proportional to the dissipated energy, so by analogy for ∣SYM‐H∣ we define an N* that we assume scales in the same manner as N; N* = 〈X(t1 + t) − L〉. The survival probability gives the likelihood an AB lasts a certain time: Ps(t) = n(t)/ m, where n is the number of ABs with T > t and m is the total number of ABs.
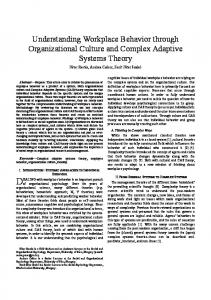
4. Results and Discussion [17] Figure 2 (top) shows plots of N*(t) for ∣SYM‐H∣ (circles) and for solar wind VByz (filled squares). Figure 2 (bottom) shows the associated plots for the survival probabilities Ps(t). Results shown are for thresholds of L = 6.3 nT for ∣SYM‐H∣ and L = 0.37 mV/m for VByz, which correspond
3 of 9
A03215
WANLISS AND URITSKY: BRIEF REPORT
A03215
Figure 2. (top) N* as a function of t (in s) for ∣SYM‐H∣ (left axis) and solar wind VByz (right). (bottom) Survival probability Ps. Slopes for ∣SYM‐H∣ are given for t < t 0.
to one quarter of the standard deviations for each signal. It is possible to fit a power law over a reasonably large range of thresholds for ∣SYM‐H∣ results, up to the 90th percentile, over the interval t < 120 min, but there is no consistent power law scaling regime for VByz. The location of the break at t = t 0, where N*(t) begins to depart from power law behavior, is indicated by the vertical dotted line in Figure 2 (top). The best fit critical scaling exponents, calculated in a least squares sense, were h = 0.263 ± 0.008 and d = 0.416 ± 0.004. The relatively narrow scaling ranges of the spreading functions as well as the negative slope of N*(t) at large time scales can be a manifestation of the characteristic time scale of the substorm cycle. Indeed, essentially all previous studies of auroral electrojet indices have shown a similar break at about t 0 to 2t 0. These studies were based on a variety of data analysis methods (Fourier power spectrum, autocorrelation function, structure functions), and they provided consistent results for different lengths of the studied time series ranging form several days to several years [see Watkins, 2002, and references therein]. We note also the difference between our results and those of Uritsky et al. [2001] which looked at high‐latitude auroral zone AE data. For AE they found the best fit critical scaling exponents were h = 0.411 ± 0.005 and d = 0.420 ± 0.003. The results for the d critical scaling exponent are identical, but are significantly different for h. They argued, on the basis of simulation results of Muñoz et al. [1999], that the high‐ latitude (AE) values point to a physical mechanism involving a one‐dimensional mass and/or energy transport realized in a two‐dimensional medium. This is consistent with the geometry of plasma flows generated in the magnetotail plasma sheet. In our case, at lower latitudes, the geometry of plasma flows is more complicated. [18] When they exist, the dynamic critical exponents can, to some extent, be related theoretically with avalanche scaling exponents. The latter are calculated from the probability distributions of avalanche sizes and lifetimes. We approximated these distributions by power laws with
exponential cutoffs P(S) ∝ S−ts exp(−S/Sc) (and P(T) ∝ T−tT exp(−T/Tc)), with the latter accounting for deviations from self‐similar statistics at largest scales which occurs because of the paucity of ABs with these largest time scales introduced by full size magnetic storms. In Figure 3 we have plotted these distributions for one of the thresholds. Table 1 presents the power law exponents and other fitting parameters calculated by a least squares fit of the probability distributions for all studied thresholds; they were robust irrespective of threshold used. [19] The results make it possible to compare the relative importance of small and large ABs in the overall magnetic energy dissipation in the ring current. Using the DPS energy relation and the scaling ansatz for p(S) given above, the total
Figure 3. Avalanche probability distributions P(S) (red) and P(T) (black) for a threshold of L = 6.3 nT. The distributions have been fitted by the power laws with exponential cutoffs (tS = 1.13, tT = 1.27, Sc = 1 × 10⁷ nTs, Tc = 4 × 10⁵ s), with their shape being essentially independent of the threshold.
4 of 9
A03215
WANLISS AND URITSKY: BRIEF REPORT
Table 1. Avalanche Scaling Exponents From the Probability Distribution of Lifetimes and Avalanche Size for Different Thresholds of ∣SYM‐H∣ From the 90th Percentile Threshold
tS
90 (45.0 nT) 75 (27.8 nT) 50 (15.0 nT) 25 (7.0 nT) 10 (3.0 nT) s/4 (6.3 nT)
1.14 1.13 1.09 1.09 1.13 1.13
± ± ± ± ± ±
tT 0.03 0.03 0.04 0.03 0.03 0.03
1.30 1.13 1.11 1.11 1.26 1.27
± ± ± ± ± ±
0.04 0.06 0.05 0.05 0.03 0.04
energy released per unit time by the ensemble of bursts should scale as ZSc Etot � S0
�S S 2�tS �� c SpðSÞdS � ; tS 6¼ 2 2 � t S �S 0
where S0 � Sc is the smallest burst size in the sample. One can easily notice that if tS < 2, the largest bursts dominate the release of energy; conversely, if tS > 2, the smallest ABs are energetically dominant. From our analysis it follows that tS is well below 2, and so the largest ABs seem to prevail in the total energy dissipation of the ring current. [20] To relate the avalanche exponents tS and tt, we note that p(S)dS ∼ p(T)dT (conservation of probability) and use the scaling law S ∼ T1+h+d derived above. For the power law portions of the two avalanche distributions, we obtain tT = (1 + h + d)(tS − 1) + 1. Since d is the survival probability exponent, it should be equal to the power law slope tT − 1 of the cumulative probability distribution of avalanche lifetimes. This yields tT = (h[tS − 1] + 1)/(2 − tS). The obtained scaling relation is consistent with the analysis of avalanche and spreading exponents presented by Muñoz et al. [2001] who showed that tS = (h + 2d + 1)/(h + d + 1). The latter expression reduces to our formula after the substitution d = tT − 1. [21] The relation tS = (h + 2d + 1)/(h + d + 1) seems to work fairly well in the case of midlatitude geomagnetic activity: for the SYM‐H data the predicted value is tS = 1.24 ± 0.03 (for s/4), which is close to the value measured directly, viz. tS = 1.13 ± 0.03 (the two estimates are statistically indistinguishable at the confidence level p = 0.95). We note that the lifetime distribution exponents reported in Table 1 are near the value obtained for the burst lifetime distribution of the solar wind Perrault–Akasofu driving function [Freeman et al., 2000], which may indicate that the SYM‐H bursts are influenced by the solar wind. However, the significant difference in dynamical scaling of SYM‐H and VByz seen in Figure 2 suggests that this influence should be rather nonlinear and strongly dependent on the temporal scale. [22] In addition to the above results, if the bursty dynamics of the SYM‐H index is due to a critical avalanching process, the exponent g ST relating burst sizes and lifetimes (S ∼ Tg ST) should allow one to predict the power law slope b of the Fourier power spectrum P(f) describing the average shape of ABs. It has been shown [Kuntz and Sethna, 2000; Laurson et al., 2005] that for tS < 2 (which is the case for both the SYM‐H bursts and sandpile avalanching models) the integral relating P(f) with the avalanche size probability
A03215
distribution and the conditional energy spectrum of avalanches of a given size is dominated by a frequency‐ dependent upper cutoff, yielding the simple scaling relation b = g ST. [23] To verify this relation, we adopted the methodology described in [D’Amicis et al., 2006] and performed two semi‐independent statistical tests (Figure 4). In the first test, we put together SYM‐H bursts with T < 240 min in their natural order by eliminating the quiet periods separating the bursts. The resulting time series is analogous to the time dependence of the number of topplings in an avalanching model studied under the infinitely slow driving condition (no driving during avalanches). In the second test, we overlapped the bursts by randomizing their starting times and taking their sum for each time step. The time series obtained mimics the dynamics of “running” sandpiles with slow but continuous driving producing no interference between concurrent avalanches. In both tests, the power spectra have a distinct power law region for frequencies above (240 min)−1 with the exponent b being approximately equal to the g ST exponent as predicted for critical avalanching systems. It is interesting that the obtained values are close to the famous 5/3 power spectral exponent predicted for fully developed hydrodynamic turbulence [Kolmogorov, 1991]. It remains to be understood whether this proximity indicates a homogeneous turbulent environment in the ring current system similar to that considered by A.N. Kolmogorov, or has a different reason. [24] To make sure that the obtained spectra characterize correlations within AB we also checked the power spectrum of the lifetime dynamics as represented by consecutive T values (inset in Figure 4). The spectrum of the lifetimes has a clear white noise shape indicating that the interburst
Figure 4. Power spectra of the time series of the sequential SYM‐H bursts and of the overlapped bursts with randomly chosen starting times (lifetime T < 240 min in both cases). The overlapped data spectrum is shifted for easier comparison; the dashed lines show linear regression slopes. The spectral exponents are statistically indistinguishable from the value of the exponent g ST = 1.69 ± 0.10 describing the scaling of burst size with bust lifetime for the chosen range of T. The inset shows the power spectrum of the time series constructed from consecutive T values of SYM‐H bursts displaying no distinct autocorrelations in the AB lifetime dynamics.
5 of 9
A03215
WANLISS AND URITSKY: BRIEF REPORT
Figure 5. Burst size S as a function of (a) T (s) and (b) � (s) estimating the total duration of bursts. The slope line in Figure 5a and the equation for the upper boundary in Figure 5b correspond to the best fit for T < T0. The inset shows the local slopes for the S‐T curve. The shape of the plot in Figure 5b indicates a well‐defined upper limit Smax of burst sizes for every given �: the effect that can be used for statistical prediction of magnetospheric activity. (c–d) The conditional average sizes hS(T)i and hS(�)i, respectively, as discussed in the work of Kuntz and Sethna [2000] and Laurson et al. [2005]. 6 of 9
A03215
A03215
WANLISS AND URITSKY: BRIEF REPORT
A03215
Figure 6. Scatterplot of the SYM‐H burst size S versus integrated solar wind input I.
correlations have no significant effect on the AB shape, in agreement with the behavior of the described class of critical avalanching models. [25] In Figure 5a we have plotted the avalanche sizes versus their lifetimes; their linear correlation coefficient is r = 0.880. There is clearly a strong correlation and power law relationship between the variables. A weak break in scaling exists near T0 = 240 min. T0 ≈ 2t 0 because growing and decaying fronts of bursts have approximately the same duration. The inset shows the local slope which has values close to 1.7 prior to T0, but begins to decrease thereafter. The best fit critical exponent calculated for T < T0, indicated by the vertical dotted line, was 1.705 ± 0.022. As mentioned previously, in critical avalanching systems, the size and lifetimes should be related as S ∝ T1+h+d. Again, we have found that the experimentally determined relationship between avalanche size and lifetime is near the theoretical value predicted for this state (1 + h + d = 1.679 ± 0.063). Figure 5b shows the relationship between the size of the bursts and total time duration between the end of subsequent ABs, �, which exhibits a sharp upper boundary whose slope matches the S(T) scaling. In Figures 5c and 5d we show the conditional average sizes 〈S(T)〉 and 〈S(�)〉, respectively [Kuntz and Sethna, 2000; Laurson et al., 2005]. The exponents calculated from these plots are very close to the original exponents and also consistent with the spectral exponent describing the shape of the activity bursts. [26] The dependence of the burst sizes for SYM‐H activity on the solar wind electric field has been R t ��tanalyzed more directly via the coupling function I = t02��t vByz(t)dt, proportional to the magnetic flux the magnetosphere receives from the solar wind during the cycles of energy loading and unloading measured with the time lag Dt. Unlike the high‐ latitude results found from AE, where the linear correlation between I and S was weak for small ABs and rather strong
for large ABs, here the correlation is low for the entire range of observations, as shown in Figure 6.
5. Conclusion [27] The paper has two levels of results. The first level is observational evidence of a broadband scaling in the dynamics of the SYM‐H index which is distinct from that in the solar wind drive. Irrespective of its physical interpretation, this observation adds a valuable piece of information to the existing picture of the solar wind – magnetosphere interaction by revealing its multiscale nonlinearity (our statistics show that there are no time scales at which the magnetospheric response is linear). It can also be used for validating existing and future ring current models in terms of their ability to correctly represent the cross‐scale coupling effects in this system. The second, so far less solid level of results is our demonstration of the possibility that the multiscale dynamics of the ring current system, as reflected by SYM‐H, is a result of its cooperative behavior governed by a specific statistical principle. We associate this dynamics with nonlinear interactions of spatially distributed degrees of freedom (e.g., current filaments) keeping the system in the vicinity of a global critical point. This interpretation, although supported by the obtained statistics, cannot be treated as final and will need to be verified in future observational and theoretical studies. [28] We have found that on average, and for time scales shorter than about 2 h, temporal development of midlatitude bursts follows an algebraic form consistent with predictions of the theory of nonequilibrium phase transitions. Probability distributions of sizes and lifetimes of the activity bursts in the SYM‐H index reveal no characteristic scales other than the scales imposed by the analysis. This statistical behavior has been observed for a wide range of burst
7 of 9
A03215
WANLISS AND URITSKY: BRIEF REPORT
durations starting from about 5 min up to 10–15 days. The results obtained provide direct statistical evidence for dynamical and statistical self‐similarity in the inner magnetosphere and signal its possible critical behavior. In the solar wind we find no evidence of similar critical behavior. The difference between these results shows clearly that the inner magnetosphere undergoes a pattern of fluctuations dissimilar from the solar wind, indicating some degree of internal dynamics independent of the external driver. [29] The power law exponent describing the burst size distribution suggests that the main energy dissipation in the ring current system, described by SYM‐H, takes place due to large ABs such as major storms as opposed to smaller activations whose contribution is less significant despite their much higher relative occurrence. Based on the ts value obtained, the total energy released per unit time by the ring S+2 ∼ S0.9 current scales as S−t c c and is therefore controlled by the upper cutoff scale, diverging in the limit Sc → ∞. On the other hand, the continuous shape of the p(S) distribution described by a single power law exponent strongly suggests that both small‐ and large‐scale ABs can be a manifestation of an emergent behavior in the ring current associated with an intensive cross‐scale coupling of a variety of intrinsic dissipation mechanisms such as convection, ion acceleration, and Joule heating. [30] These results, together with previous studies, begin to paint a coherent picture of critical fluctuations in the inner magnetosphere. At this time it is impossible to conclude whether the observed scale‐invariant behavior is a manifestation of bursty behavior in the magnetospheric plasma, as would be assumed in the SOC scenario, or if it reflects bursty behavior directly induced by the solar wind. In this context, the two groups of statistics presented here provide contradictory results by showing close similarity between SYM‐H and VByz bursts in terms of lifetime distributions and their significant deviation in terms of spreading analysis. Previous studies [Uritsky et al., 2001; D’Amicis et al., 2006] found that the lifetime distributions for the solar wind variable were highly variable over a solar cycle, so it is possible that the results of this work might be explained in future in such terms. [31] The existence of simple algebraic relations between different types of scaling exponents is not a definitive feature of systems that are “critical” in the sense used here. In theory, such relations can be expected for any fractal stochastic process, however, their form varies significantly depending on the underlying physics. For instance, Carbone and Stanley [2004] have studied avalanche exponents characterizing burst statistics in the one‐dimensional fractional Brownian motion (fBm), often considered as a “null” model of multiscale time. Using a time‐varying threshold inspired by detrended fluctuation analysis [Peng et al., 1994] they found that tS = 2/(1 − H) and tT = 2 − H, and hence tT = 3 − (2/tS). This means that tT is uniquely defined by the value of tS irrespectively of the Hurst exponent H describing the correlation structure of the time series. Therefore, the scaling in fBm is strikingly different compared to that in some critical avalanching systems and in the SYM‐H dynamics. The scaling relations found by Carbone and Stanley were subsequently seen to also using fixed thresholds, for fBm, by Rypdal and Rypdal [2008] and Watkins et al. [2009]. It is possible that a probabilistic model
A03215
where the net value of H is controlled by more than one other exponent (such as linear fractional stable motion [Watkins et al., 2005, 2009] where it depends on both memory d and the stability exponent alpha) could reproduce our scaling relation without relying on the scaling arguments used in our analysis. The search for appropriately rich, yet still stochastic, models as appropriately complex “null models” for comparison with SOC has previously been advocated [Watkins, 2002; Watkins et al., 2009]; it could be an interesting topic for future studies of inner magnetosphere, or ring current, dynamics. Z.‐G. Yu et al. (Modelling and simulation of the horizontal component of the magnetic field by fractional stochastical differential equations in conjunction with empirical mode decomposition, submitted to Journal of Geophysical Research, 2010) show that this direction is justified. [32] The existence of simple algebraic relations between different types of scaling exponents is not a definitive feature of critical systems. In theory, such relations can be expected for any fractal stochastic process, however, their form varies significantly depending on the underlying physics. For instance, Carbone and Stanley [2004] have studied avalanche exponents characterizing burst statistics in the one‐dimensional fractional Brownian motion (fBm) often considered as a “null” model of multiscale time. They found that tS = 2/(1 − H) and tT = 2 − H, and hence tT = 3 − (2/tS). This means that tT is uniquely defined by the value of tS irrespectively of the Hurst exponent H describing the correlation structure of the time series. Therefore, the scaling in fBm is strikingly different compared to that in critical avalanching systems and in the SYM‐H dynamics. It is possible that a more elaborate probabilistic model such as fractional Levy motion [Watkins et al., 2005] could reproduce our scaling relation without relying on the scaling arguments used in our analysis. As mentioned above, a search for such model could be an interesting topic for future studies of the ring current dynamics. [33] One should also be careful by not overstating the consistency of the SYM‐H dynamics with the scaling relations predicted for a specific class of critical models with absorbing configurations [see, e.g., Dickman, 1996; Muñoz et al., 2001]. As noted in the recent review by Hinrichsen [2006, page 26], the existence of the absorbing states are, in fact, “a highly idealized requirement that is difficult to realize experimentally.” However, after decades of trying, it has recently been achieved [Hinrichsen, 2009]. Our results here show what could be the first quantitative evidence for the same universality class as directed percolation in a natural system. It remains unclear whether certain dynamical states in space plasmas, such as, e.g., the frozen‐in condition, can be treated as absorbing configurations. Our analysis of scaling exponents suggests the affirmative answer to this question. However, more theoretical research will have to be done to place this hypothesis on a solid basis. [34] Acknowledgments. This material is based upon work supported by the National Science Foundation under grants 0449403 and 0417690. SYM‐H data are from WDC‐Kyoto. Solar wind data are from CDAWEB. We are grateful to the referee Nick Watkins for informing us of important recent results for nonequilibrium systems. SDG. [35] Amitava Bhattacharjee thanks Nicholas Watkins and another reviewer for their assistance in evaluating this paper.
8 of 9
A03215
WANLISS AND URITSKY: BRIEF REPORT
References Ahn, B.‐H., et al. (2002), Universal time variation of the Dst index and the relationship between the cumulative AL and Dst indices during geomagnetic storms, J. Geophys. Res., 107(A11), 1409, doi:10.1029/2002JA009257. Bak, P., C. Tang, and K. Wiesenfeld (1988), Self‐organized criticality, Phys. Rev. A, 38, 364–374, doi:10.1103/PhysRevA.38.364. Baker, D. N., et al. (1997), Recurrent geomagnetic storms and relativistic electron enhancements in the outer magnetosphere: ISTP coordinated measurements, J. Geophys. Res., 102, 14,141–14,148, doi:10.1029/97JA00565. Campbell, W. H. (1996), Geomagnetic storms, the Dst ring‐current myth, and lognormal distributions, J. Atmos. Terr. Phys., 58, 1171–1187, doi:10.1016/ 0021-9169(95)00103-4. Campbell, W. H. (2004), Failure of Dst index fields to represent a ring current, Space Weather, 2, S08002, doi:10.1029/2003SW000041. Carbone, A., and H. E. Stanley (2004), Direct self‐organized critical patterns emerging from fractional Brownian paths, Physica A, 340, 544– 551, doi:10.1016/j.physa.2004.05.004. Consolini, G. (2002), Self‐organized criticality: A new paradigm for the magnetotail dynamics, Fractals, 10, 275–283, doi:10.1142/ S0218348X02001397. D’Amicis, R. D., et al. (2006), On the scaling of waiting‐time distributions of the negative IMF Bz component, Ann. Geophys., 24, 2735–2741. Dessler, A. J., and E. N. Parker (1959), Hydromagnetic theory of magnetic storms, J. Geophys. Res., 64, 2239–2252, doi:10.1029/JZ064i012p02239. Dickman, R. (1996), Nonequilibrium critical spreading in two dimensions, Phys. Rev. E, 53(3), 2223–2230, doi:10.1103/PhysRevE.53.2223. Dickman, R., M. A. Muñoz, A. Vespignani, and S. Zapperi (2000), Paths to selof‐organized criticality, Braz. J. Phys., 30(1), 27–41, doi:10.1590/ S0103-97332000000100004. Freeman, M. P., N. W. Watkins, and D. J. Riley (2000), Evidence for a solar wind origin of the power law burst lifetime distribution of the AE indices, Geophys. Res. Lett., 27, 1087–1090. Hinrichsen, H. (2006), Non‐equilibrium phase transitions, Physica A, 369, 1–28, doi:10.1016/j.physa.2006.04.007. Hinrichsen, H. (2009), Observation of directed percolation—A class of nonequilibrium phase transitions, Physics, 2, 96, doi:10.1103/ Physics.2.96. Hori, T., et al. (2005), Storm‐time convection electric field in the near‐ Earth plasma sheet, J. Geophys. Res., 110, A04213, doi:10.1029/ 2004JA010449. Hwa, T., and M. Kardar (1992), Avalanches, hydrodynamics, and great events in models of sandpiles, Phys. Rev. A, 45, 7002–7023, doi:10.1103/PhysRevA.45.7002. Iyemori, T. (1990), Storm‐time magnetospheric currents inferred from midlatitude geomagnetic field variations, J. Geomag. Geoelectr., 42, 1249–1265. Kolmogorov, A. N. (1991), Dissipation of energy in a locally isotropic turbulence, Proc. R. Soc. London A, 434, 15–17. Korth, A., et al. (2003), O+ Transport into the ring current: Storm versus substorms, in Disturbances in Geospace: The Storm‐Substorm Relationship, Geophys. Monogr. Ser., vol. 142, edited by A. S. Sharma, Y. Kamide, and G. S. Lakhina, pp. 59–73, AGU, Washington, D. C. Kuntz, M. C., and J. P. Sethna (2000), Noise in disordered systems: The power spectrum and dynamic exponents in avalanche models, Phys. Rev. B, 62, 11,699–11,708, doi:10.1103/PhysRevB.62.11699. Laurson, L., M. J. Alava, and S. Zapperi (2005), Power spectra of self‐ organized critical sandpiles, J. Stat. Mech., L11001, 1–8, doi:10.1088/ 1742-5468/2005/11/L11001. Li, X., D. N. Baker, M. A. Temerin, T. E. Cayton, G. D. Reeves, R. A. Christensen, J. B. Blake, M. D. Looper, R. Nakamura, and S. G. Kanekal (1997), Multisatellite observations of the outer zone electron variation during the November 3–4, 1993, magnetic storm, J. Geophys. Res., 102, 14,123–14,140, doi:10.1029/97JA01101. Marro, J., and R. Dickman (1999), Nonequilibrium Phase Transitions in Lattice Models, 327 pp., Cambridge Univ. Press, Cambridge, U. K. Metallinou, F.‐A., et al. (2004), Study of the Dst‐AL correlation during geospace magnetic storms, IEEE Trans. Plasma Sci., 32, 1455–1458, doi:10.1109/TPS.2004.831734. Muñoz, M. A., R. Dickman, A. Vespignani, and S. Zapperi (1999), Avalanche and spreading exponents in systems with absorbing states, Phys. Rev. E, 59, 6175–6179, doi:10.1103/PhysRevE.59.6175.
A03215
Muñoz, M. A., et al. (2001), Sandpiles and absorbing‐state phase transitions: Recent results and open problems, in Modeling Complex Systems, edited by J. Marro and P. L. Garrido, AIP Conf. Proc., 574, 102–110. Paczuski, M., S. Maslov, and P. Bak (1996), Avalanche dynamics in evolution, growth, and depinning models, Phys. Rev. E, 53, 414–443, doi:10.1103/PhysRevE.53.414. Peng, C.‐K., S. V. Buldyrev, S. Havlin, M. Simons, H. E. Stanley, and A. L. Goldberger (1994), Mosaic organization of DNA nucleotides, Phys. Rev. E, 49, 1685–1689, doi:10.1103/PhysRevE.49.1685. Pulkkinen, T. I., et al. (2007), Differences in geomagnetic storms driven by magnetic clouds and ICME sheath regions, Geophys. Res. Lett., 34, L02105, doi:10.1029/2006GL027775. Reeves, G. D., R. H. W. Friedel, R. D. Belian, M. M. Meier, M. G. Henderson, T. Onsager, H. J. Singer, D. N. Baker, X. Li, and J. B. Blake (1998), The relativistic electron response at geosynchronous orbit during the January 1997 magnetic storm, J. Geophys. Res., 103, 17,559–17,570, doi:10.1029/97JA03236. Rypdal, M., and K. Rypdal (2008), Modeling temporal fluctuations in avalanching systems, Phys. Rev. E, 78, 051127, doi:10.1103/ PhysRevE.78.051127. Sckopke, N. (1966), A general relation between the energy of trapped particles and the disturbance field near the Earth, J. Geophys. Res., 71, 3125–3130. Skoug, R. M., et al. (2003), Tail dominated storm main phase: March 31, 2001, J. Geophys. Res., 108(A6), 1259, doi:10.1029/2002JA009705. Turner, N. E., D. N. Baker, T. I. Pulkkinen, and R. L. McPherron (2000), Evaluation of the tail current contribution to Dst, J. Geophys. Res., 105, 5431–5439, doi:10.1029/1999JA000248. Uritsky, V. M., A. J. Klimas, and D. Vassiliadis (2001), Comparative study of dynamical critical scaling in the auroral electrojet index versus solar wind fluctuations, Geophys. Res. Lett., 28, 3809–3812, doi:10.1029/ 2001GL013026. Uritsky, V. M., A. J. Klimas, and D. Vassiliadis (2003), Evaluation of spreading critical exponents from the spatiotemporal evolution of emission regions in the nighttime aurora, Geophys. Res. Lett., 30(15), 1813, doi:10.1029/2002GL016556. Uritsky, V. M., A. J. Klimas, and D. Vassiliadis (2006), Analysis and prediction of high‐latitude geomagnetic disturbances based on a self‐ organized criticality framework, Adv. Space Res., 37, 539–546, doi:10.1016/j.asr.2004.12.059. Wanliss, J. A., and P. Dobias (2007), Space storm as a phase transition, J. Atmos. Sol. Terr. Phys., 69, 675–684, doi:10.1016/j.jastp.2007.01.001. Wanliss, J. A., and K. Showalter (2006), The high resolution global storm index: Dst versus SYM‐H, J. Geophys. Res., 111, A02202, doi:10.1029/ 2005JA011034. Wanliss, J. A., and J. M. Weygand (2007), Power law burst lifetime distribution of the SYM‐H index, Geophys. Res. Lett., 34, L04107, doi:10.1029/2006GL028235. Watkins, N. W. (2002), Scaling in the space climatology of the auroral indices: Is SOC the only possible description?, Nonlinear Processes Geophys., 9, 389–397. Watkins, N. W., D. Credgington, B. Hnat, S. C. Chapman, M. P. Freeman, and J. Greenhough (2005), Towards synthesis of solar wind and geomagnetic scaling exponents: A fractional Levy motion model, Space Sci. Rev., 121, 271–294, doi:10.1007/s11214-006-4578-2. Watkins, N. W., D. Credgington, R. Sanchez, S. J. Rosenberg, and S. C. Chapman (2009), Kinetic equation of linear fractional stable motion and applications to modeling the scaling of intermittent bursts, Phys. Rev. E, 79, 041124, doi:10.1103/PhysRevE.79.041124. Weimer, D. R., et al. (2003), Predicting interplanetary magnetic field (IMF) propagation delay times using the minimum variance technique, J. Geophys. Res., 108(A1), 1026, doi:10.1029/2002JA009405. V. Uritsky, Department of Physics and Astronomy, University of Calgary, 2500 University Dr. NW, Calgary, AB T2N 1N4, Canada. J. Wanliss, Department of Physics and Computer Science, Presbyterian College, 503 South Broad St., Clinton, SC 29325, USA.
9 of 9