UNDERSTANDING IMPARTIAL VERSUS UTILITY-DRIVEN QUALITY ASSESSMENTS IN LARGE DATASETS (Completed Paper, IQ Measures)
Adir Even and G. Shankaranarayanan Information Systems Department Boston University School of Management
[email protected],
[email protected]
Abstract: Establishing and sustaining very high data quality in complex data environments is expensive and often practically impossible. Quantitative assessments of quality can provide important inputs for prioritizing improvement efforts. This study explores a methodology that evaluates both impartial and utility-driven assessments of data quality. Impartial assessments evaluate and measure the extent to which data is defective. Utility-driven assessments measure the extent to which the presence of quality defects degrades utility of that data, within a specific context of usage. The quality assessment methodology is empirically assessed using real-life alumni data – a large data resource that supports managing alumni relations and initiating pledge campaigns. The results provide important inputs that can direct the implementation and management of quality improvement policies in this data repository.
Key Words: Data Quality, TDQM, Information Products, Data Management, CRM
INTRODUCTION Establishing and sustaining very high data quality is desirable from the data consumer’s perspective. However, with rapidly increasing data volumes, this goal can rarely be achieved. Sustaining perfect quality is costly and often practically impossible. From an economic perspective, targeting perfect quality might be sub-optimal, as the cost of improving quality offsets the benefits gained. Given the difficulties in reaching perfect quality and the economic tradeoffs associated with sustaining it, there is a clear need to prioritize data quality improvement efforts and preferentially treat certain data elements or data subsets. Quantitative assessments can provide important inputs to data quality management and direct improvement efforts and policies. Today, such assessments are mostly impartial, measuring the extent to which quality defects exist, disregarding usage context. In this study, we suggest that quality assessment can be significantly enhanced by considering the utility of data, the value contribution of data within a context of usage. We refer to this as utility-driven assessment of data quality. We develop a methodology that measures both impartial and utility-driven quality along different quality dimensions (illustrated here using completeness and currency). The results of this evaluation offer insights on quality characteristics and guide the development of quality improvement policies. We demonstrate this methodology in the context of Customer Relationship Management (CRM), using large samples from a data resource used by
a university for managing alumni relations, soliciting donations, and initiating pledge campaigns. The utility of information resources is derived from use [14], and depends on usage context (e.g., a decision task). The same data resource may have different utility in different contexts and, accordingly, the presence of data quality defects may differentially impact the degradation of utility. We therefore suggest that measuring quality as the extent to which utility degrades, affords contextual assessment of the impact of quality defects. Research in data quality has highlighted the importance of contextual assessment (e.g., [9], [12], [16]), but does not minimize the value of impartial quality assessments. Our objective here is to illustrate the application of the utility-driven assessment of data quality, using a reallife data environment, and highlight its implications for data quality management. This paper makes several important contributions. First, it validates the utility-driven assessment technique proposed in [5] by illustrating its application in a real-life data environment. Second, it offers a comparative analysis of impartial and contextual quality assessments and shows how the inter-relationships between these can offer important insights. Third, a utility-driven analysis of the data shows that individual dataset records may significantly differ in utility contribution. Further, different types of defects may affect the utility contribution of records differently, and this difference is reflected in utility-driven measurements. The study illustrates how such differences have important implications for managing data quality in large datasets; specifically, in terms of prioritizing quality improvement efforts. It is important to note that the variability in utility and its reflection in quality measurements are context-specific. Generalizing these results to other datasets (even within the same domain) requires repeating the evaluation. The final contribution here is the illustration of how this technique may be applied to understand utility and associated variations, and how such observations can guide the implementation of data quality improvement methods and policies. In the remainder of this paper, we first discuss the challenges in managing the quality of large data resources and briefly review methods for assessing and improving quality that influence our research. We then propose a methodology for quality assessment, driven by the utility contribution of records. We apply this methodology to the alumni data and use the results to formulate quality improvement efforts that must be applied to this data resource. We finally highlight the contributions of this study, discuss managerial implications, and propose directions for further research.
BACKGROUND High data quality is critical for successful integration of information systems in organizations. Data is subject to different types of quality defects – e.g., missing, corrupted, inaccurate, invalid or outdated content [5]. The presence of defects degrades quality, harms usability, and damages revenues and credibility [10]. Recent trends (e.g., data warehousing, enterprise resource planning (ERP), RFID, Supply-chains, and Clickstream) have mandated the need for complex data analysis. Consequently, organizations manage large and complex data resources. Targeting defect-free datasets in complex data management environments can be very expensive and often practically impossible. Further, targeting quality levels along multiple dimensions (e.g. accuracy vs. timeliness, completeness vs. consistency) can have inherent tradeoffs [1], [2]. Efficient quality management requires assessing these tradeoffs, optimizing (not necessarily maximizing) quality levels while allowing some imperfections [6], and prioritizing improvement efforts accordingly. Methods for data quality improvement can be classified into three general categories [10]: a) Error Detection and Correction – errors can be detected by comparing data to a correct baseline (e.g., real-world entities, predefined rules/calculations, a value domain, or a validated dataset). Algorithms for automated detection/correction have been suggested (e.g., [8], [15]), and several commercial software
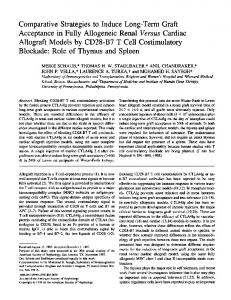
packages support automated error detection and data cleansing [13]. When automated correction fails to achieve the desired results, firms may consider manual correction, or hiring external agencies that specialize in data cleansing. While error detection/correction can help raise the quality level to the desired target, it cannot fix root causes and prevent recurrence [10]. b) Process Control and Improvement – the Total Data Quality Management (TDQM) [17] suggests a continuous cycle of defining quality requirements, measuring along these definitions, analyzing the results and improving data processes accordingly. Unlike error detection and correction, this methodology can help detecting and fixing root causes and has shown to be successful in preventing recurrence. Different methodologies support the TDQM cycle – e.g., the Information Processing Map (IPMAP) for documentation [12], optimization of quality tradeoffs [3] and tools for visualization of quality trends [9]. c) Process Design – data processes can be built from the start (or existing processes redesigned) such that quality is more manageable and the likelihood of errors is smaller. Process design principles are discussed in a plethora of studies (e.g., [3], [10], [17]) – e.g., management involvement, embedded control, data modeling, processing procedures, and operational efficiency. The methodology proposed offers important insights along all these categories. Specifically, this study addresses the prioritization of improvement efforts with respect to a large tabular dataset – multiple records with identical attribute structure. Although the method proposed can be applied to any tabular dataset, we focus on large tables in a data warehouse (DW), differentiating between two categories – fact and dimension (Figure 1). Fact tables capture transactional data. Depending on the database design, a record may represent a single transaction or an aggregation. A fact record includes numeric measurements (e.g., quantity and amount) and descriptors (e.g., time-stamps, payment/shipping instructions). It also includes dimension identifiers that link transactions to the business entities that describe them (e.g., customers, products, locations). The dimension table stores a list of dimension instances and associated descriptors (e.g., time-stamps, customer names, demographics, geographical locations, products, and categories).
Figure 1: Dimension and Transaction Tables This study addresses the quality improvement of dimensional data. Fact data, while not a subject for improvement in this study, is used for assessing the quality of dimensional data and developing improvement policies accordingly. The quality of dimensional data is critical in decision support environments. . For example - database marketing experts use sales data to analyze consumption behavior and manage promotion campaigns that target specific customers and products at specific locations [11]. Maintaining the associated dimensional data (i.e., customers, products, and locations) at a high quality is critical - otherwise, campaigns might fail to reach the right target. A common issue in data warehouses is the “slowly changing dimensions” [7] – dimension characteristics (e.g., income, marital status, and occupation) change over time and without proper tracking, transactional data and the associated dimensional data become unsynchronized and, hence, skew decisions. Improving the quality of datasets has to consider: (a) Target: the targeted level can be evaluated along a continuum: at one end is a perfect quality level (i.e., data with no quality defects), and at the other end is a “hands off” approach - accepting quality as is, without making any efforts to improve it. Between these ends, we may consider a policy that improves quality to some extent but permits imperfections. (b) Scope:
we may consider an equal treatment of all records and attributes or, alternately, a differentiating policy – giving higher priority to improving the quality of certain records and/or attributes, and possibly making no significant efforts to improve others. Along these aspects, different types of policies can be evaluated: Prevention: certain measures can be taken to prevent or reduce quality defects and the rate of their occurrence during data acquisition and processing - e.g., improving data acquisition interfaces, disallowing missing values, validations against a value domain, enforcing integrity constraints, or using a different (and possibly more expensive) data source with inherently cleaner data. Auditing: quality defects may occur not only at acquisition, but also during data processing (e.g., due to miscalculation of new fields, or code-mismatch that incorrectly integrates multiple sources), or even after it has been stored (e.g., due to changes in the real-world entity that a dimension record describes). This requires auditing records, monitoring the process, and detecting the existence of defects. Correction: even when defects are detected, correcting them is often questionable. In certain cases, correction is time consuming and costly (e.g., when a customer has to be contacted, or when missing content has to be purchased). One might choose to avoid the correction if the cost cannot be justified. Usage: in certain cases, one might recommend users not to use certain subsets of records and/or attributes, or prevent usage altogether – e.g., when the quality is too low and cannot be significantly improved, or when the context of certain subsets turns out to be misleading in certain usage contexts. Determining the target and the scope of certain policies has to consider the improvement that can be achieved, its impact on data usability, and the utility/cost tradeoffs that are associated with the implementation. Quantitative assessment of the anticipated utility/cost tradeoffs and the overall economic impact can help evaluate alternative policies and choose from among them [6]. The measurement methodology applied in this study can provide important inputs for such evaluation.
IMPARTIAL VERSUS UTILITY-DRIVEN ASSESSMENTS Data quality is typically measured along multiple dimensions (e.g. accuracy, completeness, and currency), which reflect different hazards [16]. Quality is often measured on a scale between 0 (poor) and 1 (perfect) [9], [10]. Some methods are driven by physical characteristics (e.g., item counts, time tags, or failure rates) and assume an absolute and objective quality standard, disregarding the context in which the data is used. Alternative methods derive metrics from data content and evaluate them within specific usage contexts. The former approach is termed as structure-based (or structural), and the latter, content-based [2]. Quality can be measured impartially, representing perception that is based on the data itself regardless of usage, or contextual, reflecting usage-dependent perception [16]. In certain cases, the same dimension can be measured impartially and/or contextually, depending on the purpose of measurement [9]. As both impartial and contextual assessments contribute to the overall perception, it is important to address both. This study explores a methodology that evaluates the presence of quality defects (an impartial perspective) and their impact on utility degradation (a contextual perspective). Observing both perspectives is shown to provide important insights for quality improvement efforts and the development of associated policies [17]. This study adopts the measurement framework suggested in [5]. This framework, briefly described here, permits contextual measurement of quality along different dimensions and, with certain relaxations, allows impartial assessment as well. The quality measurement in this framework is driven by the utility of the dataset - a non negative measurement of its value contribution. This framework measures quality as a ratio; hence, it is indifferent to the utility-measurement units if used consistently. In this study, we consider the utility for a single usage; however, the framework in [5] accounts for multiple usages as well.
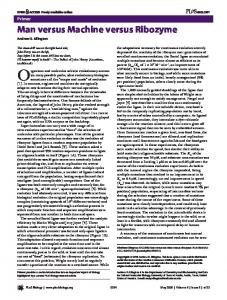
The evaluated dataset has N records (indexed by [n]), and M attributes (indexed by [m]). The data content of attribute [m] in record [n] is denoted fn,m. The quality measure qn,m reflect the extent to which attribute [m] of record [n] suffers from a quality defect (between 0 - severe defects, and 1 - no defects). The overall utility UD is attributed along records {URn}, based on relative importance such that UD=Σn=1..NURn. The utility-mapping function u used in this framework links record contents and quality to its utility: (1)
({ }
U nR = u f n ,m
m =1.. M
{ }
, q n ,m
m =1.. M
)
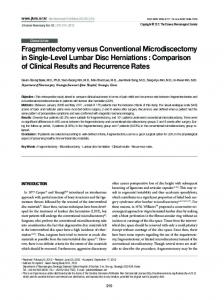
For a given set of attribute contents {fn,m}, record utility reaches an upper limit URMAXn when all attributes have perfect quality (i.e., {qn,m=1}) and may be reduced by an extent when certain attributes are defective. The record quality QRn is defined as a [0,1] ratio between the actual utility URn and the upper limit URMAXn: (2)
( ({ }
QnR = U nR U nRMAX = u f n ,m
m =1.. M
{ }
, q n ,m
m =1.. M
))/ (u ({f }
n ,m m =1.. M
{
}
, qn ,m = 1 m=1..M
))
Similarly, dataset quality QD is the ratio between the actual and the maximum possible utility: (3)
QD =
(∑
n =1.. N
U nR
) (∑
n =1.. N
) (∑
U nRMAX =
n =1.. N
U nRMAX QnR
) (∑
n =1.. N
U nRMAX
)
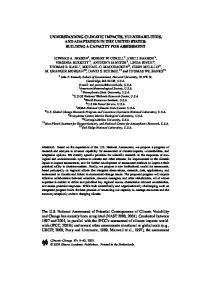
When utility is allocated independent of attribute content (i.e., constant URMAXn=UD/N), the result is an impartial measure that reflects a ratio between the counts of perfect items and total items, which is consistent with common structural definitions (e.g., [9], [10]): (4)
QnR = (1 M )∑m=1..M qn ,m , and Q D = (1 MN )∑n=1.. N ∑m=1..M qn ,m
This definition permits measurement along different dimensions, each reflecting a specific quality defect. For example, completeness reflects missing values, validity reflects failure to conform to a value-domain, accuracy reflects incorrect content, and currency reflects the extent to which data items are not up-to-date. The magnitude of utility inequality is greater in some datasets than others [4]. The likelihood of the occurrence of quality defects in a record may be independent of its utility. However, recognizing a record as having a higher utility may encourage more focused efforts to reduce its quality defects. Utility-driven measurement reflects the impact of defects on the value contribution of the data, i.e., the extent to which utility is reduced by the presence of defects. Comparing the results of utility-driven to impartial assessments is important for managing quality in such datasets. At a high-level, we can differentiate between three cases with respect to such a comparison: (a) Utility-driven scores are significantly higher than impartial scores: this indicates that records with high utility are less defective. Two complementary explanations are possible: first, defective records are less usable to begin with, hence, have inherently lower utility. Second, some differentiating error-correction policies may have been applied – some efforts were made to maintain records with higher utility at a high quality level and eliminate their defects. (b) Utility-driven scores not significantly different from impartial scores: this indicates no association – the proportion of quality defects does not depend on the utility of certain records, whether high or low. This may also indicate high equality – utility that is nearly evenly distributed between all records, and (c) Utility-driven scores significantly lower than impartial scores: this indicates that records with high utility have a higher rate of quality defects. This abnormality may indicate a systematic cause of defects for record with high utility. This may also indicate high inequality in the dataset (i.e., a large proportion of utility associated with a small number of records), and some substantial damage to high-utility records. Understanding the relationships between impartial measurement and utility-driven measurement can help develop DQM policies, as demonstrated with our empirical assessment of the alumni data.
ASSESSING THE QUALITY OF ALUMNI DATA To demonstrate utility-driven assessment of quality and its implications for prioritizing quality improvement efforts, we evaluate a sizably large sample of alumni data. This critical data resource helps generate a significant portion of the university’s revenue. The alumni data is used by different
departments for contacting donors, tracking their gift history and managing pledge campaigns. This data resource, and the system that manages it, can be viewed as a form of Customer Relationship Management (CRM). Such systems are used for managing customer relations, tracking their past contributions, analyzing gifting patterns, and segmenting them for better targeting future promotion campaigns.
Methodology for Data Collection and Evaluation This study uses samples from two key datasets, Profiles and Gifts (Table 1): The Profiles dataset (dimensional data) has 358,372 records with contact and demographic data on alumni and other potential donors. The source dataset of the profile data has more than 100 attributes. Many of these are administrative, used for indexing and auditing purposes, hence, have low relevance to data consumers. In this study, we focus on six profile attributes that are extensively (based on our observations over the last year and interviews with key decision-makers) used for decision making: School of graduation, Gender, Marital Status, Income, Ethnicity, and Religion. These are all categorical attributes, i.e., each is associated with a value domain that consists of a finite set of possible values (stored in an associated lookup table). In addition, we observe two profile time-stamps: Graduation Year, in which a record was added to the dataset, and Update Year, in which a profile record was last updated. The Gifts dataset (fact data) has 1,415,432 records and reflects the history of donations made. Some records in this dataset include data on actual gifts, while others contain data on commitments for future gifts (differentiated by a Record Type attribute). Each record has the gift amount and the year in which the gift was made, linked to a single profile. Dataset
Records
Growth
Attributes
Description
Profiles – data on alumni, parents, and friends. One record per name listed
358,372
Annual average: 7,044
Profile ID
A unique identifier of the profile record
Graduation Year
The year in which a profile record was added
Update Year
The year in which a profile record was last updated
Gifts – detailed historical archive of gift transactions
STD: 475
1,415,432
Annual average: 45,884 STD: 6147
School
The school from which the person graduated (28 categories)
Gender
Male/Female
Marital
Marital status (7 categories)
Income
Income category (3 categories)
Ethnicity
Ethnic group (7 categories)
Religion
Religion (31 categories)
Other Attributes
Contact information (e.g., address, phone), demographics, administrative fields
Gift ID
A unique identifier of the gift record
Record Type
Some records represent pledges that have been paid later, or multiple payments on behalf of a gift
Profile ID
A foreign key to the Profiles dataset. Each record is associated with one profile, but some profiles are not associated with any gifts.
Gift Amount
The gift value (in USD)
Gift Year
The year in which the gift record was added to the dataset
Other Attributes
Additional details – e.g. pledge efforts, gift allocation, payment methods
Table 1: Alumni Data Due to confidentiality constraints, our dataset includes only ~40% of the actual data volume, certain attributes were masked by codes, and gift amounts have been multiplied by a constant factor. The source data was collected between 1983 and 2006. In 1983 and 1984 (soon after initiation), a bulk of records that reflect prior activity were added (203,359 profile records, 405,969 gift records). Since 1985, both datasets
have been updated regularly and steadily grown in size. Our evaluation follows these steps: (a) Preliminary evaluation: we collected summary statistics for all the variables used for quality assessment, and detected possible correlations and dependencies. (b) Impartial quality assessment: we used the ratio measurements, which are based on item-counts (Equation 4), to evaluate impartial quality. Following [5], we initially considered four types of quality defects, with respect to the profile attributes that we evaluate: 1. Missing values: when recording a new profile (or updating an existing one) the source system permits leaving these attributes unfilled. A preliminary evaluation indicates that in a significant proportion of the records the values for these attributes are missing. 2. Invalid data: our initial evaluation indicated no invalid data with respect to the examined attributes, and all non-missing values conformed to the value domain. 3. Up-to-date: a significant number of profiles have not been updated for many years; hence, this is certainly a severe issue in this dataset. In some cases – they have never been updated since the record was added to the dataset. As a simple indicator of how current the record is, we use a binary variable – 1 if the record has been updated recently, and 0 if not. We evaluate this indicator both for a 1-year period (2006) and for a 5-year period (2002-2006). A more refined measurement is the exponential transformation [5] that converts age to a [0,1] measure:
{ (
)}
(5)
t = exp − α Y C − Y U , where
YC, YU -
Current year (here, 2006), and the year of last record update, respectively
α-
A sensitivity factor, reflecting the rate of profiles becoming outdated. Here α=0.25, assuming that ~20%-25% of the profiles become outdated every year (e-0.25 = ~0.77).
t-
Up-to-date rank, ~0 for records that have not been updated for a long period (i.e., YC >>YU) and 1 for records that are up-to-date (i.e., YC=YU=2006).
4. Inaccuracies: according to the administrators of the source system, a significant number of profile records contain inaccurate attributes. This is mostly due to changes in a person’s demographics that have been not tracked over the years, and less due to data-entry errors. However, due to the lack of appropriate baseline, in this study we could not evaluate the impact of inaccuracies. Following this preliminary assessment, we focus on two defect types - missing values and up-to-date, and the associated quality measurements – completeness and currency, respectively. Completeness is evaluated at the data-item level (per attribute and overall), and at the record level. At the data-item level, impartial completeness is the ratio between the number of missing items and the total number. For assessing completeness at the record level, we consider two different methods: (1) Absolute – a record is marked as defective if at least one attribute (out of the 6 that are evaluated) has a missing value (i.e. 0 if defective, 1 if no defects are present), and (2) Grade – the number of non-defected attributes divided by the total number of attributes (i.e., a grade of 0 when all attributes are missing, 0.5 when half are missing, 1 where none are missing). It can be shown that calculating record-level completeness in the latter case is equivalent to calculating item-level completeness for all attributes combined. The last update time-stamp refers to the entire record and not to a specific attribute; hence, we have calculated currency at the record level only, using the binary indicators and the up-to-date rank. (c)Utility-driven quality assessment: we repeat the quality assessment, using utility measurement as scaling factors (Equation 1-3). Using the Gifts dataset, we evaluate two utility measurements per profile: 1. Inclination: a binary variable that reflects a person’s inclination to make a gift. This measurement has been evaluated for two time periods – the last 1 year (2006), and the previous 4 years (2002-2005). 21,485 profiles (~6%) are associated with donations in 2006, and 43,157 (~12%) within 2002-2005.
2. Amount: the total amounts of gifts made; evaluated for the last 1 year and the previous 4 years. These two utility measurements reflect different potential usages – inclination, for example, is likely to be observed for pledge campaigns that target a large donor base. Amount, on the other hand, is more useful for targeting specific donors who can potentially make very high contributions. (d) Analysis: evaluating and comparing the results of impartial and utility driven quality assessments provides useful insights and has some important implications for developing DQM policies. To demonstrate this calculation methodology, we use the illustrative sample of alumni profile data in Table 2, in which some attributes are missing (highlighted) and some records have not been updated recently. ID
Gender
Marital Status
Income Level
Record Complete (Absolute)
Record Complete (Grade)
Last Update
Recent Updated (1y)
Up-to-date Rank
Inclination
Amount
A
Male
Married
Medium
1
1
2006
1
1
1
200
B
Female
Married
NULL
0
0.667
2003
0
0.47
1
800
C
NULL
Single
NULL
0
0.333
2005
0
0.78
0
0
D
NULL
NULL
NULL
0
0
1996
0
0.08
0
0
2
1000
Table 2: Illustrative Alumni Profile Example We observe that 2 out of 4 records are missing the value for gender; hence, impartial completeness with respect to this attribute is 0.5. Similarly impartial completeness with respect to marital status is 0.75 (1 out of 4 missing), and 0.25 with respect to income level (3 out of 4 missing). For all attribute combined, the impartial completeness is 0.5 (6 out of 12 missing). For record-level completeness – calculating along the absolute rank, 3 out of the 4 records have missing values (at least one attribute), hence, completeness is 0.25. Using the grade rank, the record-level completeness (i.e., the average record grade) is 0.5. For utility-driven completeness measurement, we observe that only 2 out of the 4 profile records are associated with utility, and we use inclination and amount as scaling factors. With respect to gender and marital status – none of the utility-contributing records has missing values; hence, the utility-driven completeness is 1. With respect to income level – one utility-contributing record is missing the value. Factoring by inclination, the completeness is (1*1+1*0)/2=0.5, and factoring by amount, completeness is (1*200+0*800)/1000=0.2. At the record level, factoring the absolute rank by inclination yields a completeness level of (1*1+0*1)/2=0.5, and factoring by amount yields (1*200+0*800)/1000=0.2. Factoring the grade rank by inclination yields (1*1+0*0.667)/1.667=0.6, and by amount (1*200+0.667*800)/1000=0.733. The impartial currency using the recent update indicator is 0.25, and using the up-to-date rank is 0.58. For utility-driven currency measurement, factoring by inclination yields (1*1+1*0)/2=0.5 and (1*1+1*0.47)/2=0.74, respectively. Factoring by amount yields (1*200+0*800)/1000=0.2 and (1*200+0.47*800)/1000=0.58, respectively.
Results First, we have calculated the following variables for each profile record: (a) Missing-Value Indicators: for each attribute (6 overall), the corresponding variable reflects whether the value is missing (=0) or not (=1). We have also calculated for each record the absolute rank (0 if at least one attribute is missing, 1 otherwise), and the grade rank (the average of the 6 attribute indicators)
(b) Up-to-date: we calculated a binary indicator that reflects whether a record has been updated within the last 1-year; and another for a 5-year period. We have also used the up-to-date rank, based on Equation 5. (c)Utility Measurements: We have computed the inclination to donate (0 or 1) and the total donation amount, each for the last 1 year (2006) and the previous 4 years (2002-2005). Summary statistics for these variables and the correlations between them are summarized in Table 3.
Utility
Record
Attribute
Correlation* Avg.
STD.
10
11
12
13
14
15
1.
School
0.99
0.01
-
L*
L*
L*
L*
L*
L*
L*
L
L
L
L
L
L
L
2.
Gender
0.99
0.10
L*
-
M*
M*
M*
L*
L*
M*
L*
L*
L*
L*
L*
L
L
3.
Marital
0.89
0.30
L*
M*
-
M*
M*
M*
M*
H*
L*
L*
L*
L*
L*
L
L*
4.
Income
0.48
*
*
*
*
*
*
*
*
*
5.
Ethnicity
6.
Religion
7.
Absolute
8.
Grade
9.
Recent-1
0.17
10. Recent-5
0.51
0.63 0.59 0.60 0.36 0.78
0.49 0.49 0.48 0.20
1
L
2
3
4
5
6
7
8
M
*
M
*
*
L L
*
L
*
*
L
*
L
*
*
M
*
M
-
M *
M
*
-
M
*
*
M
M
*
*
*
M M
*
H
H
*
*
H
*
-
H *
H
*
M
*
*
H *
*
L
*
L
L
L
M
L
L
L
-
0.50
L
L*
L*
L*
M*
L*
L*
L*
M*
*
*
*
*
M
*
L
*
L
*
*
L*
L
L
L
L
12. Inclin.1
0.06
0.24
L
L*
L*
M*
L*
L*
*
*
*
*
*
H
L
L
*
0.35
15. Amt.-2/5
M
H
*
*
*
L
*
H
*
-
L
*
0.37
*
H
H
*
0.42
14. Amt.-1
H
*
11. Up-to-date 13. Inclin.2/5
*
M
*
H
H
L
*
H
M
9
-
L *
L
L* *
*
L
*
L
*
L
*
L
*
M
M
M
L
L*
*
*
L
L
*
L
L*
L
L
L
*
L
L
*
L
*
L
*
L
*
L L
*
M
*
M
*
*
L
*
L
L
L*
-
H*
M*
L*
L*
L*
*
L
*
L
L*
H*
L*
L*
*
L
L*
-
L*
*
H
-
L*
M*
L*
*
L *
*
L
L
L
M
L
L
M
M
L
L
L
H
-
50
7.1K
L
L
L
L*
L
L
L
L*
L*
L*
L*
L*
L*
L
*
*
*
*
*
*
190
11.7K
L
L
L
L
L
*
L
L
L
L*
*
L
L
0.33
*
*
H
0.12
*
*
M
*
*
H
*
*
L
L
L
L
*
L
-
H: >0.5, M: 0.1 to 0.5, L: