The current issue and full text archive of this journal is available at www.emeraldinsight.com/0263-5577.htm
Understanding performance drivers of third-party logistics providers in mainland China A replicated and comparative study Qiang Wang School of International Trade and Economics, University of International Business and Economics, Beijing, China
Understanding performance drivers 1273 Received 12 May 2010 Revised 10 June 2010 Accepted 19 June 2010
Baofeng Huo Xi’an Jiaotong University, Xi’an, China and Centre for Supply Chain Management & Logistics, Li & Fung Institute of Supply Chain Management & Logistics, The Chinese University of Hong Kong, Shatin, Hong Kong
Fujun Lai College of Business, University of Southern Mississippi, Long Beach, Mississippi, USA, and
Zhaofang Chu School of International Trade and Economics, University of International Business and Economics, Beijing, China Abstract Purpose – The paper’s aim is to replicate and compare Huo et al.’s study to better understand performance drivers of third-party logistics (3PL) in mainland China and to disseminate Hong Kong 3PL providers’ experience to mainland China’s peers. Design/methodology/approach – A structural model is estimated to test the construct relationships using data collected from 105 mainland China’s 3PL providers. The results are compared with the results of Huo et al.’s study of Hong Kong 3PL providers. Findings – While the operations emphasis of low cost may still be effective for mainland China’s 3PL providers, it may result in worse financial performance for Hong Kong 3PL providers. In mainland China, low- cost emphasis is affected by local competition, but not by operational challenges, while it is influenced by both local competition and operational challenges in Hong Kong. Operational challenges have a positive impact on low-cost emphasis in Hong Kong, but no impact in mainland China. Originality/value – The study enriches the literature on China’s logistics and provides mainland China’s 3PL managers valuable insights from the business practices of their Hong Kong peers. Keywords Business performance, China, Distribution operations, Corporate strategy, Modelling Paper type Research paper
1. Introduction China is a manufacturing center which plays a critical role in global supply chains. However, as a developing country, China’s logistics costs are nearly double that of Western countries (Tian et al., 2008). Therefore, it is critical that Chinese companies
Industrial Management & Data Systems Vol. 110 No. 9, 2010 pp. 1273-1296 q Emerald Group Publishing Limited 0263-5577 DOI 10.1108/02635571011087392
IMDS 110,9
1274
reduce their logistics costs. More companies continue to outsource their logistics activities to third-party logistics (3PL) providers to reduce their logistics costs (Gadde and Hulthe´n, 2009; Lau and Wang, 2009). 3PL is becoming a source for companies to gain competitive advantages by reducing logistics cost, enhancing core competency, and improving service quality (Huo et al., 2008; Wang et al., 2006). China’s logistics industry is experiencing rapid development and plays an increasingly important role in China’s global economic development. China’s total logistics expenditures had an average annual growth of about 25 percent from 2000 through 2007 (Wang et al., 2008), reaching 19.5 percent in 2008, which represented 18.1 percent of China’s gross domestic product in 2008 (National Development and Reform Commission, National Bureau of Statistics and China Federation of Logistics and Purchasing, 2009). In 2008, logistics contributed about Renminbi 2 trillion of China’s value added (16.5 percent from the servicing industry) and had an annual increase of 15.4 percent (National Development and Reform Commission, National Bureau of Statistics and China Federation of Logistics and Purchasing, 2009). Though the 3PL industry in mainland China is important, little is known about Chinese 3PL providers, especially their environments, operations strategies, and performance (Huo et al., 2008; Zhao et al., 2007). Not only is the research on mainland China’s 3PL still in its infancy (Lau and Wang, 2009; Wang et al., 2008; Zhao et al., 2007), but the practices of 3PL in mainland China are not well examined (Wang et al., 2008, 2006). To the best of our knowledge, there is only one study addressing operations strategies of mainland China’s 3PL (Wang et al., 2006), and no research was identified that has examined the influence of the competitive environment on 3PL strategies and practices. Although China’s entry into the WTO in 2001 and the opening up the logistics markets at the end of 2005 allowed its logistics industry to grow at an even faster rate, the added competitive challenges from global players and increased uncertainties of China’s transition economy have led to a more complex competitive environment in China’s logistics market. To meet the mounting requirements of reliable, speedy, and flexible delivery to global customers, mainland China’s 3PL providers have to reengineer their operations and revisit their competitive strategies. Therefore, the research on the relationships among competitive environments, operations strategies, and performance is important and urgent. As a world-class logistics leader, Hong Kong has a highly developed logistics industry and has a significant influence in Asia-pacific areas. Wang et al. (2008) stated that Hong Kong’s logistics industry is a developed and mature industry. The expertise and experience accumulated in the long-time development of Hong Kong’s logistics may set up an excellent reference for mainland China’s logistics industry. To transfer Hong Kong’s experience to mainland China’s 3PL providers, the replication research of Hong Kong’s logistics management in mainland China’s context and the comparative research on these two contexts are needed. Frohlich and Dixon (2001, p. 543) argued that: [. . .] theoretical discovery is not the final goal of research, and the principle of replication is widely recognized as the hallmark of scientific knowledge. Theory building must be followed by rounds of verification and elaboration. They typically endorsed replication as a necessary part of research.
In addition, Wang et al. (2008, p. 49) specifically argued that: [. . .] the comparison (between Hong Kong and mainland China) can shed light for mainland China 3PL providers to learn the valuable expertise and lessons from the logistics development of Hong Kong so that mainland China logistics can develop better strategies to avoid the pitfalls that occurred in the logistics history of Hong Kong.
Therefore, this study is designed to replicate and compare Huo et al.’s (2008) model to the mainland China’s context. Huo et al.’s (2008) model examined competitive environments, operations emphasis, and business performance of Hong Kong 3PL providers, which is an important and urgent research topic for mainland China’s 3PL providers. In the next section, the literature on operations strategies, competitive environment, functional involvement, and business performance is reviewed, followed by a presentation of the research model and hypotheses. Then, a description of the research methodology and data analysis is presented, followed by discussion and managerial implications. Finally, conclusions and limitations are presented. 2. Theoretical background 2.1 Huo et al.’s (2008) overarching framework Using Hong Kong’s 3PL as a backdrop, Huo et al. (2008) proposed an overarching framework to examine the intervening relationships between competitive environment, operations emphasis, and business performance. In this framework, competitive environment consists of local competition, international competition, operational challenges, and functional involvement. Operations emphasis consists of low cost and differentiation. Business performance was examined from three aspects: cost performance, service performance, and financial performance. Huo et al. (2008) argued external and internal environment has significant impact on the operations emphasis, which in turn influences business performance. Their model was tested using data collected from Hong Kong 3PL providers. They found that to respond to the changes in the competitive environment, 3PL providers may have to establish an appropriate operations emphasis on differentiation and/or low cost and have their functional departments involved in the formulation and planning of this operations emphasis. The execution of an operations emphasis and functional involvement may improve operational performance, which in turn would drive financial performance. Are these findings from Hong Kong’s developed 3PL industry still applicable to mainland China’s developing 3PL industry? What can mainland China’s 3PL providers learn from their Hong Kong peers? To answer these questions, we must first replicate Huo et al.’s (2008) research using data collected from mainland China’s 3PL providers and then compare our results with those of Huo et al. (2008). In the following sections, the components of Huo et al.’s (2008) model are discussed. 2.2 Competitive environment Based on Huo et al.’s (2008) research, the competitive environment in this study is discussed from two aspects: external and internal. The external environment is measured from three dimensions: local competition, international competition, and operational challenges. The definitions of the three dimensions are the same as Huo et al. (2008).
Understanding performance drivers 1275
IMDS 110,9
That is, “local competition and international competition refer to the competition in the local or international markets, respectively” and: [. . .] operational challenges refer to the operational difficulties faced by the company, such as rising business costs, unreliable vendor quality, lack of suitable labor, and lack of innovation and technology adaptation (p. 776).
1276
With the increased globalization and intensified competition among today’s businesses, the influence of competitive environment on firms’ operations strategies is stronger than ever. This influence has been well examined in previous studies (Amoako-Gyampah, 2003; Ho, 1996; Schatzel et al., 2001; Ward and Duray, 2000; Ward et al., 1995, 2007; Williams et al., 1995). For example, Ward et al. (1995) found that the competitive environment influenced the choice of operations strategies, while Cagliano et al. (2005) suggested that an operations emphasis should be modified to meet the requirements of the changing competitive environment. 2.3 Functional involvement The internal environment is presented as a proxy for functional involvement, which refers to the extent of the participation of the executives from different functional departments in business strategic planning and decision making (Huo et al., 2008). Functional involvement, which has been less empirically examined (Barnes, 2001), relates to the internal business environment and represents the degree of the involvement by functional departments (i.e. marketing, finance, accounting, production, etc.) in the corporate strategic planning process (Menda and Dilts, 1997). Previous studies have examined the involvement of functional departments in strategy formulation and planning (Boyer and ˚ hlstro¨m, 2009; Qi et al., 2009; Spina and Pagell, 2000; Christiansen et al., 2003; Moses and A Zotteri, 2001; Sum et al., 2004) and investigated the impact of functional involvement on new product development efficiency and effectiveness (Fredericks, 2005; Song et al., 1998; Troy et al., 2008) and business performance (Brown et al., 2007; Ferguson et al., 1996; Meredith and Vineyard, 1993; Qi et al., 2009; Roth and Miller, 1990; Sum et al., 2004; Swamidass et al., 2001; Tracey et al., 1999). In general, it is believed that functional involvement in strategic decision making has a positive impact on business performance. 2.4 Operations emphasis When developing an appropriate operations strategy, there are tradeoffs between efficiency, cost and productivity in pursuing specific markets (Skinner, 1969). Operations strategy, which describes a company’s choice of tasks or key competitive capabilities, often has four common dimensions: cost, quality, delivery, and flexibility (Alegre-Vidal et al., 2004; Amoako-Gyampah and Meredith, 2007; Dangayach and Deshmukh, 2001; Gro¨ßler and Gru¨bner, 2006). However, a universal set of operations strategies does not exist for all the firms in the global marketplace (Chan, 2005; Spring and Araujo, 2009) and the dimensions of operations strategies are diversely formalized by researchers (Lai et al., 2008; Ward et al., 1998; Zhao et al., 2002). To gain competitive advantage, companies often emphasize different sets of operations strategies to formalize their competitive strategies. Porter (1980, 1985) identified three generic competitive strategies: differentiation, cost leadership, and focus. Competitive strategies and operations strategies were adapted to the 3PL industry in previous studies (Sum and Teo, 1999; Wang et al., 2006; Yeung et al., 2006).
As Huo et al. (2008) asserted, managers may just generally emphasize some of their operations rather than strictly differentiate between varying operations strategies when they are pursuing competitive strategies. Therefore, we follow Huo et al. (2008) by using an “operations emphasis” to represent the competitive strategies and/or operations strategies adopted by the companies. Similar to Huo et al. (2008), we only focus on cost leadership and differentiation. With a cost leadership strategy, a company competes by providing low-cost services. While a differentiation strategy means that the company competes by differentiating its services from its competitors’ services in the areas of such as quality, delivery, and flexibility.
Understanding performance drivers 1277
2.5 Performance Performance refers to the nature and quality of an organization’s behaviors to complete their main tasks and functions and to generate profit (Sink, 1991). Venkatraman and Ramanujam (1986) identified two core dimensions of business performance: operational and financial performances. Operational performance relates to a company’s performance in serving customers in terms of quality, flexibility, on time delivery, and so forth. Huo et al. (2008) suggested that operational performance can be further classified into two major dimensions: cost and service performances. Cost performance is related to cost and price, while service performance is related to service reliability, speed, variety, and so forth. In fact, cost has been treated as a separate dimension of operational performance in the previous literature (Martı´n-Pen˜a and Dı´az-Garrido, 2008; Porter, 1985; Roth and Miller, 1990; Roth and van der Velde, 1991; Toyli et al., 2008), and service performance is also commonly used in measuring operational service performance in terms of the quality of the service, on-time delivery, and flexibility of the service (Bernardes and Hanna, 2009; Daugherty et al., 2009; Green et al., 2008; Ketokivi and Schroeder, 2004; Neely et al., 1995; Ruamsook et al., 2009). In our study, operational performance is operationalized as Huo et al.’s (2008) two dimensions: cost and service performance. Financial performance is defined as the financial and market measures to evaluate the companies’ efficiency and effectiveness, including growth rate in market share, growth in annual sales, growth in return on sales, and growth in return on assets (Huo et al., 2008). 3. Research model and hypotheses The conceptual model (Figure 1) and hypotheses are the same as used by Huo et al. (2008). Along with detailed discussion in Huo et al. (2008), the present study provides further elaboration on these hypotheses. External and internal environment
Operations emphasis
Operational challenges Functional involvement
H1 b
Low cost
H5a
H5
H4a
b
H4c
H4
H2a H2b H
International competition
Financial performance
H1a
b
Local competition
Operational performance
H5c H7a
Financial performance
H4d
a H6 H6b
3a H3b
Cost performance
Differentiation
Service performance
H7b
H6c
Figure 1. Conceptual model
IMDS 110,9
1278
The first set of hypotheses relates to the influence of competitive environment on operations emphasis. In Huo et al.’s (2008, p. 777) study, they argued that “competitive environments force companies to form an appropriate operational strategic response, either through a low-cost or differentiation emphasis, to gain competitive advantage”. This argument is quite consistent with prior studies. For example, Ward et al. (1995) found that there was a strong relationship between environmental factors and operations strategy. They also reported that given perceived environments, high and low performers used different operations strategies. Badri et al. (2000) replicated Ward et al.’s (1995) study using a sample of manufacturers and found strong relationships between environmental factors (e.g. labor availability, competitive hostility, government laws and regulations, political concerns, and market dynamism) and competitive priorities. Similarly, Amoako-Gyampah and Boye (2001) conducted a study among 78 manufacturing firms in Ghana and found that perceived competitive hostility had the highest influence on operations strategy choices, as well as a direct effect on low cost, quality, and flexibility. Sinkovics and Roath (2004) found that competitor orientation had a positive impact on operational flexibility in 3PL industry. Recently, Ward et al. (2007) found that the companies adopting a hybrid strategy combining both cost leadership and differentiation faced the highest level of environment dynamism, while the companies adopting a pure cost leadership strategy faced the lowest level of environment dynamism. Wiersema and Bowen (2008) found that foreign competition was a significant factor explaining the degree and scope of international diversification of US firms. These studies have shown that when facing higher competition, uncertainties, and challenges, companies will have a stronger emphasis on operations strategies so that the companies can better respond environmental changes. Therefore, we propose: H1a. Companies facing more operational challenges will have an increased low-cost emphasis. H1b. Companies facing more operational challenges will have an increased differentiation emphasis. H2a. Companies facing higher local competition will have an increased low-cost emphasis. H2b. Companies facing higher local competition will have an increased differentiation emphasis. H3a. Companies facing higher international competition will have an increased low-cost emphasis. H3b. Companies facing higher international competition will have an increased differentiation emphasis. The second set of hypotheses address the relationships between functional involvement, operations emphasis, and performance. Huo et al. (2008) asserted that the higher functional involvement in the formation of business strategies, the more likely the company to adopt an appropriate strategy. The literature has widely reported that companies with different functional involvement into the formulation and planning of company’s business strategy had different operations strategic postures and different contributions to business performance. For example, Fawcett and Fawcett (1995) found
that the roles of purchasing, logistics, and operation functions in the formation of competitive strategies were different. Sum et al. (2004, 2001) found that companies paying more attention to business strategies had a high level of functional participation in the formulation and planning of their business strategies. Recently, Qi et al. (2009) found that functional involvement was positively related to cost, quality, delivery, and ˚ hlstro¨m (2009) flexibility strategies in Chinese manufacturing industries. Moses and A also reported that function invlovement played a crucial role in effective decision making. Furthermore, functional involvement is a fundamental element of supply chain integration (Flynn et al., 2010; Zhao et al., 2010). The logistics services are provided based on the cooperative relationship between 3PL providers and users. If 3PL providers have a better functional involvement (internal integration), they will be more likely to have a higher level of cooperation (external integration) with 3PL users (Zhao et al., 2010). In addition, both internal and external integration may lead to operational performance (Flynn et al., 2010), thus functional involvement may improve performance of 3PL providers. Therefore, we propose: H4a. Companies having higher functional involvement will have an increased low-cost emphasis. H4b. Companies having high functional involvement will have an increased differentiation emphasis. H4c. Companies having higher functional involvement will have better cost performance. H4d. Companies having higher functional involvement will have better service performance. The last set of hypotheses are about the relationships between operations emphasis and performance. Numerous research has examined the relationship between competitive strategies and firm performance (Amoako-Gyampah and Boye, 2001; Christiansen et al., 2003; de Lima et al., 2009; Garrido et al., 2007; Narasimhan et al., 2005; Ward and Duray, 2000). These studies reported that there were strong positive relationships between operations emphases and operational and financial performance, and between operational and financial performance. For example, Butler and Leong (2000) found that the emphasis on cost containment and service delivery consistently yielded superior business performance. Ward and Duray (2000) developed a conceptual model of manufacturing strategy with consideration of environment, competitive strategy, and business performance. They found that competitive strategy acted as a mediator between environment and manufacturing strategy, while manufacturing strategy acted as a mediator between competitive strategy and business performance. Aranda (2003) reported that service operations strategy had a significant positive and direct effect on service delivery performance. In a recent logistics study on 251 3PL providers in Hong Kong, Panayides (2006) found that innovation capability positively influenced logistics service quality, which in turn led to improved financial performance. In addition, numerous studies also reported that higher operational performance could lead to better financial performance (Panayides, 2006, 2007; Panayides and So, 2005). In sum, the literature has shown that appropriate operations strategies help companies improve business performance. Therefore, we propose:
Understanding performance drivers 1279
IMDS 110,9
H5a. Companies pursuing a low-cost emphasis will have better cost performance. H5b. Companies pursuing a low-cost emphasis will have worse service performance. H5c. Companies pursuing a low-cost emphasis will have better financial performance.
1280
H6a. Companies pursuing a differentiation emphasis will have worse cost performance. H6b. Companies pursuing a differentiation emphasis will have better service performance. H6c. Companies pursuing a differentiation emphasis will have better financial performance. H7a. Companies achieving better cost performance will have better financial performance. H7b. Companies achieving better service performance will have better financial performance. 4. Research methodology 4.1 Data collection The sampling frame for our study was drawn from a list of logistics companies that were registered with the Chinese Ministry of Communications and the membership list of the China International Freight Forwarders Association. The companies were contacted by telephone to obtain the name of the senior logistics manager and to confirm their mailing addresses. As a result, a total of 760 companies agreed to participate in the survey. Subsequently, questionnaires with cover letters explaining the purpose of the research, as well as a return-addressed, postage-paid envelope, were mailed to these 760 companies. The target respondents were middle or senior managers who were familiar with the company’s strategies and operations. A total of 105 usable completed questionnaires were received, which represents a 13.8 percent response rate. Although it is relative low, this response rate is comparable to other studies conducted in China (Lai et al., 2009; Zhao et al., 2006b) and other logistics studies (Wang et al., 2006). “These low response rates are common in South-East Asia and are attributable to numerous structural and cultural factors” (Harzing, 2000; Lai et al., 2009, p. 982; Zhao et al., 2006a). This response rate may also be related to our decision that only senior managers would be selected, in that “senior managers have the least amount of free time available and are typically inundated with requests to respond to surveys” (Lai et al., 2008, p. 28; Rodrigues et al., 2004). The sample represents a wide variety of 3PL providers in mainland China (Table I). In terms of ownership, 64.8 percent were state-owned or Chinese private companies, 14.3 percent were foreign owned, and the rest were joint venture companies. Of the total 105 respondents in mainland China, about 28 percent employed less than 50 full-time staff while 21 percent employed less than 500 full-time staff. More than half (58.4 percent) of the companies faced less than ten major competitors in their primary services and about 29 percent of the companies faced more than 20 major competitors, indicating fierce competition within the 3PL industry in mainland China. Most popular
Characteristics A. Ownership State-owned company Chinese private company Joint venture company Foreign company B. Number of full-time employees Less than 50 50-99 100-199 200-499 500-999 1,000 or more C. Number of major competitors 1-5 6-10 11-20 21 or more D. Service type Warehousing Sea freight Integrated logistics Land freight Inter-modal transportation Distribution Consulting Packing/repackaging
% 41.0 23.8 20.9 14.3
Understanding performance drivers 1281
28.0 17.0 15.0 19.0 8.0 13.0 39.3 19.1 12.4 29.2 61.9 52.4 50.0 49.5 46.7 39.0 33.3 25.7
logistics services provided included sea freight (52 percent), land freight (50 percent), and warehousing (62 percent), indicating that most 3PLs offer basic transportation and warehousing services. Non-traditional services such as distribution/channel selection (39 percent), packaging/repackaging (26 percent), and consulting (33 percent) were also provided by many 3PL providers in mainland China. Non-response bias was assessed by following the procedure suggested by Armstrong and Overton (1977). We compared the early and late responses in terms of demographical variables (i.e. physical assets, annual sales, and number of employees) and all construct scores. The t-tests showed no significant differences, indicating that non-response bias was unlikely present in our data. 4.2 Measures All measurement items were adapted from Huo et al. (2008). The items are listed in Tables II-VI. 5. Data analysis 5.1 Analysis strategy Our analysis used partial least squares (PLS) implemented on the PLS-Graph 3.0 software (Chin, 2001) to estimate the relationships between latent variables that measure our constructs. PLS is a widely adopted analysis tool, along with standard regression and structural equation modelling (SEM) techniques (Gefen and Straub, 2005). Unlike
Table I. Profile of respondents
IMDS 110,9 Itemsa
1282
Table II. Competitive environment
Keen competition in local markets (LC1) Low profit margins (LC2) Keen competition in China market (LC2) Lack of availability of suitable labor (OC1) Lack of innovation and technology adoption (OC2) Unreliable vendor/subcontractors’ quality (OC3) Keen competition in overseas markets (IC1) Declining demand in foreign markets (IC2) Eigenvalue Total variance explained
Local competition 0.841 0.796 0.772 0.136 20.017 0.470 0.007 0.092 2.19 71.99%
Factor loadings Operational International challenges competition 0.074 0.163 0.072 0.867 0.860 0.636 0.027 0.142 1.95
Note: aThese items were measured using a seven-point Likert scale, with “1” for “not at all relevant” and “7” for “highly relevant”
Itemsa
Factor loadings Functional involvement
Information systems (FI1) Logistics/operations (FI2) Marketing (FI3) Finance (FI4) Eigenvalue Total variance explained Table III. Functional involvement
0.865 0.837 0.784 0.606 2.43 60.77%
Note: aThese items were measured using a seven-point Likert scale, with “1” for “low involvement” and “7” for “high involvement”
Itemsa To provide reliable and consistent services (DI1) To maximize value added to products of clients (DI2) To provide good service in terms of design and performance (DI3) To meet customers’ specifications/special requirements (DI4) To introduce new services rapidly (DI5) To be flexible in accommodating changes (DI6) To provide a wide range of services (DI7) To keep price competitive (LCT1) To operate at low cost (LCT2) Eigenvalue Total variance explained Table IV. Operations emphasis
2 0.142 0.031 0.313 2 0.074 0.249 0.111 0.871 0.813 1.62
Factor loadings Differentiation Low cost 0.910 0.883 0.867 0.792 0.790 0.756 0.696 0.161 0.091 4.70 72.35%
0.088 0.032 0.093 0.370 0.353 0.457 0.483 0.784 0.689 1.81
Note: aThese items were measured using a seven-point Likert scale, with “1” for “not important” and “7” for “very important”
Items
a
Variety of services offered (SP1) Speed of introduction of new services (SP2) Customer service (SP3) Speed of delivery (SP4) Reliability of delivery (SP5) Relative cost position (CP1) Relative price position (CP2) Eigenvalue Total variance explained
Factor loadings Service performance Cost performance 0.837 0.833 0.819 0.809 0.764 0.107 0.204 3.36 71.52%
0.038 0.121 0.145 0.281 0.214 0.877 0.847 1.65
Note: aThe items were measured using a seven-point Likert scale, with “1” for “lower than major competitors” and “7” for “higher than major competitors”
Itemsa Percentage growth in return on sales (net profit over sales) over past two years (FP1) Percentage growth in return on assets (net profit over assets) over past two years (FP2) Average growth rate in market share (in terms of sales) over past two years (FP3) Average growth in annual sales over past two years (FP4) Eigenvalue Total variance explained
Understanding performance drivers 1283
Table V. Operational performance
Factor loadings Financial performance 0.959 0.903 0.902 0.883 3.33 83.23%
Note: aThese items were measured using a seven-point Likert scale, with “1” for “lower than major competitors” and “7” for “higher than major competitors”
linear structural relations (LISREL)-type SEM, PLS concerns more about the causal relationships between constructs (Gefen and Straub, 2005) and the predictive power of the independent variable (Chin, 1998), thus PLS is better suited for complex relationship explaining and theory building, as Wold (1985, p. 590) argued that “In large, complex models with latent variables, PLS is virtually without competition”. One advantage of PLS is its ability to handle relatively small sample size (Chin, 1998; Chin et al., 2003). With consideration of our sample size and the complexity of our conceptual model, this study used PLS to analyze the data, unlike Huo et al. (2008), who used LISREL for their data analysis. We employed a bootstrapping estimation procedure to exam the significance of the factor loadings of the scales in the measurement model and the significance of the path coefficients in the structural model (Gefen and Straub, 2005). 5.2 Measurement model The measures were adapted from Huo et al. (2008), who developed the scales based on previous extant studies. In addition, the measures were pre-tested in mainland China before the large-scale data collection. This procedure ensured the content validity. We analyzed the reliability, convergent validity, and discriminant validity of the multi-item scales by following the guideline of Fornell and Larcker (1981) and Gefen
Table VI. Financial performance
IMDS 110,9
1284
and Straub (2005). Composite reliability (CR), which measures the degree to which items are free from random error and therefore yield consistent results, was used to analyze reliability. CR values ranged from 0.768 to 0.952 (Table VII), greater than the recommended cutoff value of 0.70 (Fornell and Larcker, 1981), suggesting acceptable reliability. Convergent validity was assessed in terms of factor loadings, average variance extracted (AVE), and eigenvalues. Item loadings greater than 0.70 and significant at the p , 0.01 level (Gefen and Straub, 2005) suggest acceptable convergent validity. As shown in Table VIII, all item loadings were greater than 0.7 and significant at the 0.01 significance level and all AVE values were greater than 0.5, the cut-off value suggested by Fornell and Larcker (1981), indicating acceptable convergent validity of the scales. In addition, we checked the eigenvalue of each construct. A construct is considered to have convergent validity if its eigenvalue exceeds 1.0 in an exploratory factor analysis (EFA) and all factor loadings are greater than 0.30 (Hair et al., 2009). We conducted a series of EFA using principal component analysis and Varimax rotation with Kaiser normalization. The results shows all eigenvalues were higher than 1.0 and all factor loadings were higher than 0.50 (Tables II-VI). To sum up, the constructs demonstrated acceptable convergent validity. Discriminant validity was assessed from several perspectives. First, we examined if the square root of each construct’s AVE was larger than any inter-correlation between the focal construct and all other constructs. Table VIII shows that square root of each AVE was larger than the inter-correlations of the construct with the others. Second, we examined if each item loads substantially higher on its principal construct than on other constructs (Gefen and Straub, 2005). The results in Tables II-VI show that the cross-loading differences were substantially higher than the suggested threshold of 0.1 (Gefen and Straub, 2005). Third, a constrained confirmatory factor analysis model was estimated for each possible pair of constructs, in which the correlation among this pair of constructs was fixed to 1.0. These models were compared with the unconstrained models, in which the correlations among constructs were freely estimated. A significant difference of the x 2 statistics between the constrained and unconstrained models indicates discriminant validity (Chau, 1997). In this study, 36 pairs of constrained and unconstrained models were compared, with only two pairs found insignificantly different at the 0.05 significance level. These results indicate adequate discriminant validity. 5.3 Path model and hypotheses testing Results of hypothesis testing are presented in Table IX and Figure 2. Among 18 hypothesized relationships proposed in the conceptual model, eight path coefficients were insignificant and ten significant at the 0.05 significance level. Common method variance (CMV) was assessed per suggestions of Podasakoff et al. (2003), especially when only one informant per organization is selected and when the study is conducted in the Chinese context (Zhao et al., 2006a, p. 485). First, we conducted Harmon’s single factor test by following the analytical procedure suggested by Liang et al. (2007). CMV is present in data if one factor accounts for most of the covariance. Second, we checked the correlation matrix (Table VII). Common method bias is unlikely if there are no excessively high correlations (. 0.9) (Pavlou et al., 2007). The results of
0.854 0.859 0.858 0.813 0.768 0.951 0.873 0.916 0.952
0.661 0.607 0.669 0.692 0.628 0.734 0.775 0.686 0.832
AVE 0.813 0.255 0.399 0.249 0.297 0.346 0.253 0.392 0.255
X1 0.779 0.272 0.118 0.277 0.344 0.130 0.482 0.380
X2
0.818 0.155 0.348 0.253 0.152 0.224 0.02
X3
0.832 0.248 0.292 0.204 0.282 0.139
X4
0.792 0.434 0.363 0.422 0.201
X5
0.857 0.210 0.507 0.240
X6
0.880 0.358 0.382
X7
X9
0.912
X8
0.828 0.522
Notes: Squared root of AVE is shown on the diagonal of each matrix with italics; inter-construct correlation is shown off the diagonal
Operational challenges (X1) Functional involvement (X2) Local competition (X3) International competition (X4) Low cost (X5) Differentiation (X6) Cost performance (X7) Service performance (X8) Financial performance (X9)
CR
Understanding performance drivers 1285
Table VII. Composite reliability, Cronbach alpha, AVE, and correlations of constructs
IMDS 110,9
1286
Table VIII. Measurement model
Operational challenges OC1 OC2 OC3 Functional involvement FI1 FI2 FI3 FI4 Local competition LC1 LC2 LC3 International competition IC1 IC2 Low cost LCT1 LCT2 Differentiation DI1 DI2 DI3 DI4 DI5 DI6 DI7 Cost performance CP1 CP2 Service performance SP1 SP2 SP3 SP4 SP5 Financial performance FP1 FP2 FP3 FP4
Path loading
SE
t-statistics
0.780 0.795 0.862
0.142 0.154 0.171
5.476 5.148 5.032
0.8530 0.8270 0.780 0.614
0.039 0.048 0.067 0.121
21.879 17.339 11.940 5.094
0.807 0.855 0.791
0.096 0.054 0.067
8.400 15.887 11.766
0.658 0.976
0.193 0.029
3.412 33.222
0.894 0.676
0.064 0.169
13.901 4.000
0.883 0.838 0.840 0.873 0.863 0.868 0.831
0.036 0.040 0.041 0.035 0.034 0.038 0.035
24.594 20.757 20.761 24.625 25.298 22.621 23.661
0.895 0.866
0.039 0.057
23.107 15.235
0.822 0.837 0.828 0.853 0.800
0.048 0.035 0.041 0.038 0.053
17.310 24.024 20.284 22.329 15.010
0.962 0.914 0.899 0.870
0.010 0.030 0.032 0.044
96.393 30.616 28.280 20.011
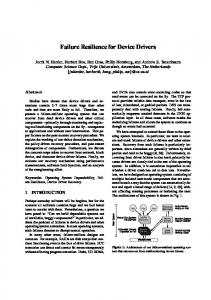
these two tests suggested that the results of this study were not impacted unduly by CMV. Detailed discussion on the results and the main findings are presented as follows. 6. Discussion and managerial implications 6.1 Operational and financial performances From Figure 2, we can see that the path coefficients from both cost and service performance to financial performance are positive and significant (b ¼ 0.24 and 0.48; p , 0.05 and 0.01, respectively). This means that both cost and service performances are
Outcome Hong Kong Mainland China
Hypothesis H1. Companies facing more operational challenges will have an increased: a: low-cost emphasis b: differentiation emphasis H2. Companies facing higher local competition will have an increased: a: low-cost emphasis b: differentiation emphasis H3. Companies facing higher international competition will have an increased: a: low-cost emphasis b: differentiation emphasis H4. Companies having higher functional involvement will have: a: an increased low-cost emphasis b: an increased differentiation emphasis c: better cost performance d: better service performance H5. Companies pursuing a low-cost emphasis will have: a: better cost performance b: worse service performance c: better financial performance H6. Companies pursuing a differentiation emphasis will have: a: worse cost performance b: better service performance c: better financial performance H7a. Companies achieving better cost performance will have better financial performance H7b. Companies achieving better service performance will have better financial performance
External and internal environment Operational challenges
Operations emphasis
(0.
36
**
)
n.s. (n.s.)
Functional involvement
Supported Rejected
Supported Rejected
Rejected Supported
Rejected Supported
Rejected Supported Rejected Supported
Rejected Supported Rejected Supported
Supported Rejected Rejected
Supported Rejected Rejected
Rejected Supported Rejected Supported
Rejected Supported Rejected Supported
Supported
Supported
Operational performance
1287
Table IX. Results of hypothesis tests
Financial performance
Low cost
*) .29* * (0 0.23 n.s. (n .s.)
n.s .)
Cost performance
n.s. (– 0.20*) 0.24*
(0.36*
*)
0.32** (0 .26**)
0.25 ** ( 0.24 **)
Service performance
.s.)
. (n
n.s
s.)
(n.
0.33* * (0.2 1*)
0.2 0* (
n.s. (n.s.)
. n.s
International competition
Rejected Supported
n.s.a (0.34b**)
0.2
0*
Local competition
Supported Supported
Understanding performance drivers
Differentiation
0.31* (0
.50**)
0.48**
*)
Financial performance
(0.45*
n.s. (n.s.)
0.20* (0.24**)
Notes: Significance at: *0.05 and ** 0.01 levels; n.s.: not significant; a: Mainland China; b: Hong Kong from Huo et al. (2008)
important for companies to achieve better financial performance. Figure 2 also shows that the impact of cost performance on financial performance is much lower than the impact of service performance on financial performance (0.24 vs 0.48). It implies that to improve 3PL provider’s financial performance, enhancing service performance is more
Figure 2. Path model with parameter estimates
IMDS 110,9
1288
efficient than improving cost performance. These findings are similar to Huo et al.’s (2008) findings for Hong Kong 3PL providers. This means that for all 3PL providers in developed and underdeveloped 3PL industries, both improving cost and service performances are important for 3PL companies to achieve better financial performance, while improving service performance is more efficient. Our findings of the significant impacts of cost and service performances on financial performance in 3PL industry are also consistent with previous findings for Chinese manufacturing industries (Qi et al., 2009). 6.2 Functional involvement, operations emphasis, and performance The results indicate that the low-cost emphasis significantly influences cost performance (b ¼ 0.33, p , 0.01), while differentiation significantly influences service performance (b ¼ 0.31, p , 0.05). The positive impact of the operations emphasis on corresponding operational performance is consistent to Huo et al.’s (2008) findings. In addition, the results show that the operations emphasis on low cost also has significant influence on service performance of mainland China’s 3PL providers (b ¼ 0.20, p , 0.05), while this influence is not significant for Hong Kong 3PL providers. These findings may imply that in mainland China’s underdeveloped 3PL industry, 3PL users may have relative lower service expectations, thus a low-cost emphasis also meets the service requirements of the customers. It is also probably because in the underdeveloped 3PL industry, the customers are relatively easier to satisfy due to their relatively simpler logistics requirements. These speculations have support from our post-hoc interviews with 15 3PL users in mainland China. These 3PL users mainly outsourced to 3PL providers the services of transportation and express delivery of document and samples. Most of the 3PL users set costs as the first criterion for the selection of 3PL providers. Very few users considered 3PL provider’s capability of offering value-added activities when they made the logistics service outsourcing decisions. Similarly, this finding of the positive relationship between operations emphasis and operational performance is also consistent with previous studies on manufacturing industries (Frohlich and Dixon, 2001; Zhao et al., 2006b). Although operations emphasis on differentiation has no significant direct influence on financial performance, it may indirectly influence financial performance through the improvement of service performance (0.31 £ 0.48 ¼ 0.15, p , 0.01). This finding is similar to Huo et al. (2008). Interestingly, it appears that low-cost emphasis also has a positive influence on financial performance (total effect: 0.33 £ 0.24 ( p , 0.05) þ 0.20 £ 0.48 ( p , 0.05) ¼ 0.18). This finding is contrary to Huo et al.’s (2008) finding of the negative impact of low-cost emphasis on financial performance of Hong Kong 3PL providers. In addition, in mainland China, low-cost emphasis has a slightly higher total impact on financial performance than differentiation emphasis (0.18 vs 0.15), while in Hong Kong differentiation emphasis has much higher impact on financial performance than low-cost emphasis (0.50 £ 0.45 ( p , 0.01) vs 0.21 £ 0.36 (p , 0.05) – 0.20, that is, 0.23 vs 2 0.12). These differences may be due to the status of logistics industries in mainland China and Hong Kong, underdeveloped and developed, respectively. In mainland China, both low cost and differentiation are order winners and important for 3PL providers to gain competitive advantages. However, in Hong Kong, low cost has become an order qualifier for 3PL providers and only differentiation is an order winner for 3PL providers to gain competitive advantages. In Hong Kong, it seems
difficult for 3PL providers with low-cost emphasis to survive in the markets (Wang et al., 2008). This finding provides valuable strategic implications for mainland China’s 3PL providers. Along with the rapid growth of logistics industry, mainland China’s 3PL providers with low-cost emphasis will probably are find it difficult to survive in the future, as it has been happening in Hong Kong’s developed logistics industry. The results indicate that functional involvement significantly influences differentiation emphasis and service performance (b ¼ 0.25 and 0.32, respectively; p , 0.01), but has no significant influence on low-cost emphasis or cost performance. These findings are similar to Huo et al. (2008). This similarity may be related to the fact that cost leadership emphasis is relatively simple, thus the functional involvement into pursuing cost leadership is relatively straightforward. It may be also because of the same culture of power distance between mainland China and Hong Kong, which determines the influences of functional involvement. The findings that functional involvement has a positive impact on operations strategies and operational performance are also consistent with previous studies (Qi et al., 2009; Sum et al., 2001). 6.3 Competitive environment and operations emphasis This study shows that low-cost emphasis is affected only by local competition (b ¼ 0.23; p , 0.05), but not by operational challenges. This result indicates that low-cost emphasis, as an order winner of mainland China’s 3PL providers, is only pushed by the local competition. In contrast, in the developed 3PL industry in Hong Kong, low-cost emphasis of 3PL providers was influenced by both local competition and operational challenges (Huo et al., 2008). Similar to Huo et al.’s (2008) findings, the differentiation emphasis is influenced by both international competition and operational challenges in mainland China. Our finding that external environment is positively related to operations emphasis in the 3PL industry is consistent with previous findings in manufacturing industries (Amoako-Gyampah, 2003; Amoako-Gyampah and Boye, 2001; Badri et al., 2000). 6.4 3PL providers in emerging 3PL industries We compared the performance drivers of 3PL providers in mainland China and Hong Kong, which represent a developing logistics industry and a developed logistics industry, respectively. The evolution of the competitive strategies in the developed logistics industry may help the practitioners in the developing logistics industry to foresee their development path. Although they also employ differentiation as their operations emphasis, mainland China’s 3PL providers are still competing based on cost and it is not surprising that cost is emphasized much by most of the 3PL providers. Although the low-cost emphasis may still bring reasonable business performance and competitive advantages for 3PL providers in a developing logistics industry (i.e. mainland China’s), it should be cautious that in the developed 3PL industry (i.e. Hong Kong’s) the low-cost emphasis may result in worse financial performance (Huo et al., 2008). 3PL providers in Hong Kong had to shift their operations emphasis from low cost to differentiation. This shift may illuminate mainland China’s 3PL providers for their future operation strategies. Along with sustaining and rapid growth and intensifying competition of the logistics industry, mainland China’s 3PL providers may have to undertake this strategic shift in the very near future.
Understanding performance drivers 1289
IMDS 110,9
1290
In emerging 3PL industry (i.e. mainland China’s), low-cost emphasis is affected by local competition but not by operational challenges, while it is influenced by both local competition and operational challenges in developed 3PL industry (i.e. Hong Kong’s). This finding implies that mainland China’s 3PL providers may not fully understand the important role of improving internal operations to reduce costs. For both developing and developed 3PL industries, functional involvement in the formation of the operations emphasis is important for the companies to develop differentiation emphasis and achieve service performance. This insight is helpful to encourage the functional managers to participate in the decision making of the operations emphasis and related managerial activities. 7. Conclusions and limitations This study replicates and compares Huo et al.’s (2008) study on Hong Kong 3PL providers, aiming at better understanding performance drivers of mainland China’s 3PL providers. The results suggest that mainland China’s 3PL providers should pay attention to both the internal and external environment when they formulate their operations emphases. Either low-cost or differentiation emphasis may improve the financial performance of mainland China’s 3PL providers, while only differentiation emphasis enhances financial performance of their Hong Kong counterparts. In underdeveloped 3PL industry in mainland China, low-cost emphasis may also maintain a reasonable service performance, which in turn leads to a better financial performance. In contrast, in the developed 3PL industry in Hong Kong, low-cost emphasis may deteriorate financial performance. This study enriches the literature on China’s logistics and operations strategy, as Zhao et al. (2007) stated that there were very few studies on China’s logistics from theoretical perspectives. In addition, the results also provide valuable insights for managers to better understand mainland China’s logistics. The comparative results offer mainland China’s 3PL providers valuable lessons accumulated from their peers in Hong Kong. These lessons may better prepare mainland China’s 3PL providers for their strategic transitions in the near future. There are several limitations in this study, which also open up venues for future studies. First, future research may extend the generalization of the results to regions with different social, economic, and culture backgrounds. The generalization can help better understand logistics behaviors in different environments. Second, future research can investigate the effect of time through a longitudinal study, as the current study was cross-sectional by design. A longitudinal study may help to better understand how logistics behaviors change over time along with social development, economic growth, and cultural shifts. Third, the model tested in this study is far from conclusive; future research may explore additional factors which may influence strategies and performance in 3PL industries. Additional studies also expand the research scope by incorporating factors such as technology adoption, information sharing, strategy formulation, operations practices, and benchmarking. Last, this study did not separate companies into high and low performer groups or 3PL provider categories across customer segments or industry types. Future studies could also shed light on a better understanding of the differences between high and low performers, or different 3PL provider groups, and the process that may transform a low performer to a high performer.
Acknowledgement This research was funded by the Program for New Century Excellent Talents in University (NCET-09-0301) and the Program of “211 Project of University of International Business and Economics”, and Centre for Supply Chain Management and Logistics, Li & Fung Institute of Supply Chain Management and Logistics, The Chinese University of Hong Kong.
Understanding performance drivers 1291
References Alegre-Vidal, J., Lapiedra-Alcami, R. and Chiva-Gomez, R. (2004), “Linking operations strategy and product innovation: an empirical study of spanish ceramic tile producers”, Research Policy, Vol. 33 No. 5, pp. 829-39. Amoako-Gyampah, K. (2003), “The relationships among selected business environment factors and manufacturing strategy: insights from an emerging economy”, Omega, Vol. 13 No. 4, pp. 287-301. Amoako-Gyampah, K. and Boye, S.S. (2001), “Operations strategy in an emerging economy: the case of the ghanaian manufacturing industry”, Journal of Operations Management, Vol. 19 No. 1, pp. 59-79. Amoako-Gyampah, K. and Meredith, J.R. (2007), “Examining cumulative capabilities in a developing economy”, International Journal of Operations & Production Management, Vol. 27 No. 9, pp. 928-50. Aranda, D.A. (2003), “Service operations strategy, flexibility and performance in engineering consulting firms”, International Journal of Operations & Production Management, Vol. 23 Nos 11/12, pp. 1401-21. Armstrong, J.S. and Overton, T.S. (1977), “Estimating nonresponse bias in mail surveys”, Journal of Marketing Research, Vol. 14 No. 3, pp. 396-402. Badri, M.A., Davis, D. and Davis, D. (2000), “Operations strategy, environmental uncertainty and performance: a path analytic model of industries in developing countries”, Omega, Vol. 28 No. 2, pp. 155-73. Barnes, D. (2001), “Research methods for the empirical investigation of the process of formation of operations strategy”, International Journal of Operations & Production Management, Vol. 21 No. 8, pp. 1076-95. Bernardes, E.S. and Hanna, M.D. (2009), “A theoretical review of flexibility, agility and responsiveness in the operations management literature”, International Journal of Operations & Production Management, Vol. 29 No. 1, pp. 30-53. Boyer, K.K. and Pagell, M. (2000), “Measurement issues in empirical research: improving measures of operations strategy and advanced manufacturing technology”, Journal of Operations Management, Vol. 18 No. 3, pp. 361-74. Brown, S., Squire, B. and Blackmon, K. (2007), “The contribution of manufacturing strategy involvement and alignment to world-class manufacturing performance”, International Journal of Operations & Production Management, Vol. 27 No. 3, pp. 282-302. Butler, T.W. and Leong, G.K. (2000), “The impact of operations competitive priorities on hospital performance”, Health Care Management Science, Vol. 3 No. 3, pp. 227-35. Cagliano, R., Acur, N. and Boer, H. (2005), “Patterns of change in manufacturing strategy configurations”, International Journal of Operations & Production Management, Vol. 25 Nos 7/8, pp. 701-18.
IMDS 110,9
1292
Chan, J.W.K. (2005), “Competitive strategies and manufacturing logistics: an empirical study of Hong Kong manufacturers”, International Journal of Physical Distribution & Logistics Management, Vol. 35 No. 1, pp. 20-43. Chau, P.Y.K. (1997), “Reexamining a model for evaluating information center success using a structural equation modeling approach”, Decision Sciences, Vol. 28 No. 2, pp. 309-34. Chin, W.W. (1998), “The partial least squares approach to structural equation modeling”, in Marcoulides, G.A. (Ed.), Modern Methods for Business Research, Lawrence Erlbaum Associates, Mahwah, NJ, pp. 295-336. Chin, W.W. (2001), PLS-graph User’s Guide, version 3.0, Software Modeling, Houston, TX. Chin, W.W., Marcolin, B.L. and Newsted, P.R. (2003), “A partial least squares latent variable modeling approach for measuring interaction effects: results from a monte carlo simulation study and an electronic-mail emotion/adoption study”, Information Systems Research, Vol. 14 No. 2, pp. 189-217. Christiansen, T., Berry, W.L., Bruun, P. and Ward, P. (2003), “A mapping of competitive priorities, manufacturing practices, and operational performance in groups of Danish manufacturing companies”, International Journal of Operations & Production Management, Vol. 23 No. 10, pp. 1163-83. Dangayach, G.S. and Deshmukh, S.G. (2001), “Manufacturing strategy: literature review and some issues”, International Journal of Operations & Production Management, Vol. 21 No. 7, pp. 884-932. Daugherty, P., Chen, H., Mattioda, D. and Grawe, S. (2009), “Marketing/logistics relationships: influence on capabilities and performance”, Journal of Business Logistics, Vol. 30 No. 1, pp. 1-18. de Lima, E., da Costa, S. and de Faria, A. (2009), “Taking operations strategy into practice: developing a process for defining priorities and performance measures”, International Journal of Production Economics, Vol. 122 No. 1, pp. 403-18. Fawcett, S.E. and Fawcett, S.A. (1995), “The firm as a value-added system: integrating logistics, operations and purchasing”, International Journal of Physical Distribution & Logistics Management, Vol. 25 No. 5, pp. 24-42. Ferguson, W.C., Hartley, M.F., Turner, G.B. and Pierce, E.M. (1996), “Purchasing’s role in corporate strategic planning”, International Journal of Physical Distribution & Logistics Management, Vol. 26 No. 4, pp. 51-62. Flynn, B.B., Huo, B. and Zhao, X. (2010), “The impact of supply chain integration on performance: a contingency and configuration approach”, Journal of Operations Management, Vol. 28 No. 1, pp. 58-71. Fornell, C. and Larcker, D.F. (1981), “Evaluating structural equation models with unobservable variables and measurement error”, Journal of Marketing Research, Vol. 18 No. 1, pp. 39-50. Fredericks, E. (2005), “Cross-functional involvement in new product development: a resource dependency and human capital perspective”, Qualitative Market Research, Vol. 8 No. 3, pp. 327-41. Frohlich, M.T. and Dixon, J.R. (2001), “A taxonomy of manufacturing strategies revisited”, Journal of Operations Management, Vol. 19 No. 5, pp. 541-58. Gadde, L. and Hulthe´n, K. (2009), “Improving logistics outsourcing through increasing buyer-provider interaction”, Industrial Marketing Management, Vol. 38 No. 6, pp. 633-40. Garrido, E.D., Martı´n-Pen˜a, M.L. and Garcı´a-Muin˜a, F. (2007), “Structural and infrastructural practices as elements of content operations strategy. The effect on a firm’s competitiveness”, International Journal of Production Research, Vol. 45 No. 9, pp. 2119-40.
Gefen, D. and Straub, D. (2005), “A practical guide to factorial validity using PLS-graph: tutorial and annotated example”, Communications of AIS, Vol. 16, pp. 91-109. Green, K.W. Jr, Whitten, D. and Inman, R.A. (2008), “The impact of logistics performance on organizational performance in a supply chain context”, Supply Chain Management: An International Journal, Vol. 13 No. 4, pp. 317-27. Gro¨ßler, A. and Gru¨bner, A. (2006), “An empirical model of the relationships between manufacturing capabilities”, International Journal of Operations & Production Management, Vol. 26 No. 5, pp. 458-85. Hair, J.F., Black, W.C., Babin, B., Anderson, R.E. and Tatham, R.L. (2009), Multivariate Data Analysis, 7th ed., Prentice-Hall, New Jersey, NJ. Harzing, A.-W. (2000), “Cross-national industrial mail surveys: why do response differ between countries?”, Industrial Marketing Management, Vol. 29 No. 3, pp. 243-454. Ho, C.-F. (1996), “A contingency theoretical model of manufacturing strategy”, International Journal of Operations & Production Management, Vol. 16 No. 5, pp. 74-98. Huo, B., Selen, W., Yeung, J.H.Y. and Zhao, X. (2008), “Understanding drivers of performance in the 3PL industry in Hong Kong”, International Journal of Operations & Production Management, Vol. 28 No. 8, pp. 722-800. Ketokivi, M. and Schroeder, R. (2004), “Manufacturing practices, strategic fit and performance: a routine-based view”, International Journal of Operations & Production Management, Vol. 24 Nos 1/2, pp. 171-91. Lai, F., Griff, M. and Babin, B. (2009), “How quality, value, image, and satisfaction create loyalty at a Chinese telecom”, Journal of Business Research, Vol. 62 No. 10, pp. 980-6. Lai, F., Li, D., Wang, Q. and Zhao, X. (2008), “The information technology capability of third-party logistics providers: a resource-based view and empirical evidence from China”, Journal of Supply Chain Management, Vol. 44 No. 3, pp. 22-38. Lau, K.H. and Wang, Y. (2009), “Reverse logistics in the electronic industry of China: a case study”, Supply Chain Management, Vol. 14 No. 6, pp. 447-65. Liang, H., Saraf, N., Hu, Q. and Xue, Y. (2007), “Assimilation of enterprise systems: the effect of institutional pressures and the mediating role of top management”, MIS Quarterly, Vol. 31 No. 1, pp. 59-87. Martı´n-Pen˜a, M.L. and Dı´az-Garrido, E. (2008), “Typologies and taxonomies of operations strategy: a literature review”, Management Research News, Vol. 31 No. 3, pp. 200-18. Menda, R. and Dilts, D. (1997), “The manufacturing strategy formulation process: linking multifunctional viewpoints”, Journal of Operations Management, Vol. 15 No. 4, pp. 223-41. Meredith, J.R. and Vineyard, M. (1993), “A longitudinal study of the role of manufacturing technology in business strategy”, International Journal of Operations & Production Management, Vol. 13 No. 12, pp. 4-24. ˚ hlstro¨m, P. (2009), “Nature of functional involvement in make or buy decision Moses, A. and A processes”, International Journal of Operations & Production Management, Vol. 29 No. 9, pp. 894-920. Narasimhan, R., Swink, M. and Kim, S.W. (2005), “An exploratory study of manufacturing practice and performance interrelations: implications for capability progression”, International Journal of Operations & Production Management, Vol. 25 No. 9, pp. 1013-33. National Development and Reform Commission, National Bureau of Statistics and China Federation of Logistics and Purchasing (2009), Briefing of China’s Logistics Operations in 2008, National Development and Reform Commission, Beijing.
Understanding performance drivers 1293
IMDS 110,9
1294
Neely, A., Gregory, M. and Platts, K. (1995), “Performance measurement system design: a literature review and research agenda”, International Journal of Operations & Production Management, Vol. 15 No. 4, pp. 80-116. Panayides, P. (2006), “Enhancing innovation capability through relationship management and implications for performance”, European Journal of Innovation Management, Vol. 9 No. 4, pp. 466-83. Panayides, P.M. (2007), “The impact of organizational learning on relationship orientation, logistics service effectiveness and performance”, Industrial Marketing Management, Vol. 36 No. 1, pp. 68-80. Panayides, P.S.M. and So, M. (2005), “The impact of integrated logistics relationships on third-party logistics service quality and performance”, Maritime Economics & Logistics, Vol. 7 No. 1, pp. 36-55. Pavlou, P.A., Liang, H. and Xue, Y. (2007), “Understanding and mitigating uncertainty in online exchange relationships: a principal-agent perspective”, MIS Quarterly, Vol. 31 No. 1, pp. 105-36. Podasakoff, P.M., MacKenzie, S.B., Lee, J.-Y. and Podasakoff, N.P. (2003), “Common method bias in behavioral research: a critical review of the literature and recommended remedies”, Journal of Applied Psychology, Vol. 88 No. 5, pp. 879-903. Porter, M.E. (Ed.) (1980), Competitive Strategy: Techniques for Analyzing Industries and Competitors, The Free Press, New York, NY. Porter, M.E. (Ed.) (1985), Competitive Advantage: Creating and Sustaining Superior Performance, The Free Press, New York, NY. Qi, Y., Sum, C.-C. and Zhao, X. (2009), “Simultaneous effects of functional involvement and improvement programs on manufacturing and financial performance in Chinese firms”, International Journal of Operations & Production Management, Vol. 29 No. 6, pp. 636-62. Rodrigues, A.M., Stank, T. and Lynch, D.F. (2004), “Linking strategy, structure, process and performance in integrated logistics”, Journal of Business Logistics, Vol. 25 No. 2, pp. 65-94. Roth, A.V. and Miller, J.G. (1990), “Manufacturing strategy, manufacturing strength, managerial success, and economic outcomes”, in Ettlie, J.E., Burstein, M.C. and Fiegenbaum, A.V.I. (Eds), Proceedings for the Joint Industry University Conference on Manufacturing Strategy, Ann Arbor, MI, USA. Roth, A.V. and van der Velde, M. (1991), “Operations as marketing: a competitive service strategy”, Journal of Operations Management, Vol. 10 No. 3, pp. 303-28. Ruamsook, K., Russell, D.M. and Thomchick, E.A. (2009), “Sourcing from low-cost countries”, International Journal of Logistics Management, Vol. 20 No. 1, pp. 79-96. Schatzel, K.E., Calantone, R.J. and Droge, C. (2001), “Beyond the firm’s initial declaration: are preannouncements of new product introductions and withdrawals alike?”, The Journal of Product Innovation Management, Vol. 18 No. 2, pp. 82-95. Sink, D.S. (1991), “The role of measurement in achieving world-class quality and productivity management”, Industrial Engineering, Vol. 23 No. 6, pp. 23-39. Sinkovics, R. and Roath, A. (2004), “Strategic orientation, capabilities, and performance in manufacturers-3PL relationships”, Journal of business Logistics, Vol. 25 No. 2, pp. 43-55. Skinner, W. (1969), “Manufacturing: missing link in corporate strategy”, Harvard Business Review, Vol. 47 No. 3, pp. 136-45. Song, X.M., Thieme, R.J. and Xie, J. (1998), “The impact of cross-functional joint involvement across product development stages: an exploratory study”, The Journal of Product Innovation Management, Vol. 15 No. 4, pp. 289-303.
Spina, G. and Zotteri, G. (2001), “The strategic context of customer-supplier partnerships: evidence from a global survey”, Integrated Manufacturing Systems, Vol. 12 Nos 6/7, pp. 483-92. Spring, M. and Araujo, L. (2009), “Service, services and products: rethinking operations strategy”, International Journal of Operations & Production Management, Vol. 29 No. 5, pp. 444-67. Sum, C.-C. and Teo, C.-B. (1999), “Strategic posture of logistics service providers in Singapore”, International Journal of Physical Distribution & Logistics Management, Vol. 29, pp. 588-605. Sum, C.-C., Kow, L.S.-J. and Chen, C.-S. (2004), “A taxonomy of operations strategies of high performing small and medium enterprises in Singapore”, International Journal of Operations & Production Management, Vol. 24 Nos 3/4, pp. 321-45. Sum, C.-C., Teo, C.-B. and Ng, K.-K. (2001), “Strategic logistics management in Singapore”, International Journal of Operations & Production Management, Vol. 21 No. 9, pp. 1239-60. Swamidass, P.M., Baines, T. and Darlow, N. (2001), “The role of manufacturing and marketing managers in strategy development lessons from three companies”, International Journal of Operations & Production Management, Vol. 21 No. 7, pp. 933-48. Tian, Y., Lai, F. and Daniel, F. (2008), “An examination of the nature of trust in logistics outsourcing relationship: empirical evidence from China”, Industrial Management & Data Systems, Vol. 108 No. 3, pp. 346-67. Toyli, J., Hakkinen, L., Ojala, L. and Naula, T. (2008), “Logistics and financial performance”, International Journal of Physical Distribution & Logistics Management, Vol. 38 No. 1, pp. 57-80. Tracey, M., Vonderembse, M.A. and Lim, J.-S. (1999), “Manufacturing technology and strategy formulation: keys to enhancing competitiveness and improving performance”, Journal of Operations Management, Vol. 17 No. 4, pp. 411-28. Troy, L., Hirunyawipada, T. and Paswan, A. (2008), “Cross-functional integration and new product success: an empirical investigation of the findings”, Journal of Marketing, Vol. 72 No. 6, pp. 132-46. Venkatraman, N. and Ramanujam, V. (1986), “Measurement of business performance in strategy research: a comparison of approaches”, Academy of Management Review, Vol. 11 No. 4, pp. 801-14. Wang, Q., Chu, Z., Zhou, Q. and Lai, F. (2008), “A comparative study of third-party logistics in mainland China and Hong Kong”, Transportation Journal, Vol. 47 No. 3, pp. 48-58. Wang, Q., Zantow, K., Lai, F. and Wang, X. (2006), “Strategic postures of third-party logistics providers in mainland China”, International Journal of Physical Distribution & Logistics Management, Vol. 36 No. 10, pp. 793-819. Ward, P.T. and Duray, R. (2000), “Manufacturing strategy in context: environment, competitive strategy and manufacturing strategy”, Journal of Operations Management, Vol. 18 No. 1, pp. 123-38. Ward, P.T., McCreery, J.K. and Anand, G. (2007), “Business strategies and manufacturing decisions: an empirical examination of linkages”, International Journal of Operations & Production Management, Vol. 27 No. 9, pp. 951-73. Ward, P.T., Duray, R., Leong, G.K. and Sum, C.-C. (1995), “Business environment, operations strategy and performance: an empirical study of Singapore manufacturers”, Journal of Operations Management, Vol. 13 No. 2, pp. 99-115. Ward, P.T., McCreery, J.K., Ritzman, L.P. and Sharma, D. (1998), “Competitive priorities in operations management”, Decision Sciences, Vol. 29 No. 4, pp. 1035-46.
Understanding performance drivers 1295
IMDS 110,9
1296
Wiersema, M. and Bowen, H. (2008), “Corporate diversification: the impact of foreign competition, industry globalization, and product diversification”, Strategic Management Journal, Vol. 29 No. 2, pp. 115-32. Williams, F.P., Souza, D.E.D., Rosenfeldt, M.E. and Kassaee, M. (1995), “Manufacturing strategy, business strategy and firm performance in a mature industry”, Journal of Operations Management, Vol. 13 No. 1, pp. 19-33. Wold, H. (1985), Encyclopedia of Statistical Sciences, Wiley, New York, NY. Yeung, J.H.Y., Selen, W., Sum, C.-C. and Huo, B. (2006), “Linking financial performance to strategic orientation and operational priorities: an empirical study of third-party logistics providers”, International Journal of Physical Distribution & Logistics Management, Vol. 36 No. 3, pp. 210-30. Zhao, X., Flynn, B.B. and Roth, A.V. (2006a), “Decision sciences research in China: a critical review and research agenda – foundations and overview”, Decision Sciences, Vol. 37 No. 4, pp. 451-96. Zhao, X., Flynn, B.B. and Roth, A.V. (2007), “Decision sciences research in China: current status, opportunities and propositions for research in logistics, supply chain management and quality management”, Decision Sciences, Vol. 38 No. 1, pp. 39-80. Zhao, X., Yeung, J.H.Y. and Zhou, Q. (2002), “Competitive priorities of enterprises in mainland China”, Total Quality Management, Vol. 13 No. 3, pp. 285-300. Zhao, X., Huo, B., Selen, W. and Yeung, J. (2010), “The impact of relationship commitment and internal integration on external integration”, Journal of Operations Management (in press). Zhao, X., Sum, C.-C., Qi, Y., Zhang, H. and Lee, T.-S. (2006b), “A taxonomy of manufacturing strategies in China”, Journal of Operations Management, Vol. 24 No. 5, pp. 621-36. Corresponding author Baofeng Huo can be contacted at:
[email protected]
To purchase reprints of this article please e-mail:
[email protected] Or visit our web site for further details: www.emeraldinsight.com/reprints