bs_bs_banner
Research Article
Transactions in GIS, 2014, 18(3): 401–420
Understanding User Interaction Patterns within Online Systems for Public-Participation Transportation Planning Martin Swobodzinski* and Piotr Jankowski† *Department of Geography, Portland State University † Department of Geography, San Diego State University
Abstract Many research projects in public-participation geographic information systems focused on the development of software prototypes that were conceptualized to complement traditional forms of public participation. Given the challenges introduced by the heterogeneity of their user base, system design, and decision making process, empirical evaluations of such systems based on actual use have been scarce. This article reports on a rigorous empirical assessment of human-computer interaction of users of a web-based system for participatory transportation planning. We devised three groups of participants with belowaverage, average, and above-average interaction duration through hierarchical cluster analysis. Subsequently, the characteristics of the clusters were subjected to logistic regression analysis to determine the significance and strength of statistical associations between duration of interaction and a host of individual-level variables. Our results indicate a statistically significant reduction of the odds-ratio for participants with above-average duration of interaction in the case of no prior experience with online transportation discussions. No significant associations were found between overall duration of interaction and sociodemographic background, cognitive decision-making style, and travel behavior. We advocate for the development of adaptable participatory systems which accommodate flexibility in terms of both the user interface and pathways of the decision making process.
1 Introduction A sizable number of projects in the context of web-based decision support systems and public-participation geographic information systems (PPGIS) relied on a prototype approach in which a participatory system was designed and implemented on a proof-of-concept basis (Dymond et al. 2004; Choi et al. 2005; Jankowski et al. 2008). Empirical evaluations of such group-based decision support systems, however, have been less frequently undertaken (Rinner 2003; Bhargava et al. 2007) and often focused on the satisfaction of the users with the system (e.g. Jankowski et al. 2006; Rinner 2007), the usability (i.e. efficiency and ease of use) of the system (e.g. Szczur 1994; Haklay and Tobón 2003; Aggett and McColl 2006), and the validation of decision support models that were incorporated into the system (e.g. Srdjevic 2007). Whereas the notion of the public conveys heterogeneous groups of people, exploring this heterogeneity is usually not central to the design and the evaluation of participatory systems Address for correspondence: Martin Swobodzinski Department of Geography, Portland State University, Portland, OR 97201, USA. E-mail:
[email protected] Acknowledgments: This research was supported by the National Science Foundation Information Technology Research Program Grant No. EIA 0325916 which we gratefully acknowledge. We would also like to acknowledge the PGIST research team and especially Tim Nyerges, Matt Wilson, Kevin Ramsey, Robert Aguirre, Michael Lowry, Arika Lingmann-Zielinska, Michael Patrick, Zhong Wang, Jie Wu, and Guirong Zhou for their contributions to the project. Lastly, we thank the editor and the reviewers for their support of and thorough comments on our manuscript. The authors are solely responsible for the content.
© 2014 John Wiley & Sons Ltd
doi: 10.1111/tgis.12099
402
M Swobodzinski and P Jankowski
(Sieber 2006). Considering the potential of PPGIS for the empowerment of its users (Ghose 2001; Kyem 2004; Elwood 2006) and the wide recognition of the importance of individuallevel differences in various research areas,1 it stands to reason that non-adaptable PPGIS enable participation by some while excluding participation by others, in particular in decisionmaking situations where the system’s functionality diverges from the expectations and information needs of the participants. Relying on the satisfaction of the users as a primary means for the evaluation of complex decision support systems is particularly problematic, since it promotes a conflation of the users’ satisfaction with the decision support system and the decision-making process and its outcome(s). In addition, user satisfaction with a decision support system is informed by aspects of usability and usefulness (Davis 1989) and offers limited insight into the contribution of the constituent components comprising the decision support technology to the user experience. One option for disentangling the conflation would be to pair each individual component of a system with a separate questionnaire item asking the user to indicate perceived satisfaction with (or usability and usefulness of) the respective component. For complex systems, however, such an approach is limited due to the potentially large number of components and the response fatigue that a correspondingly large number of questions would afford (Galesic and Bosnjak 2009). In this article, we present an individual-based approach for the empirical evaluation of complex decision support systems based on observed user interaction with a participatory system. More specifically, we analyze the association between the use patterns of participants in a web-based group decision-making process using an Internet platform for transportation improvement programming. After assigning the participants into groups of similar overall duration of interaction, we discuss the composition of these groups and explore the statistical association between group membership and four groups of individual-level variables pertaining to the users: (1) sociodemographics; (2) cognitive style; (3) computer literacy; and (4) travel behavior. The significance and the strength of association between the individual-level variables and the groups of users with similar overall duration of interaction is investigated through logistic regression analysis. Our analysis is motivated by traditions in behavioral geography (Golledge and Stimson 1997; Golledge 2006, 2008) as well as theory in the field of Decision Support Systems (DSS) and Human-Computer Interaction (HCI), foremost the Task-Technology Fit (Goodhue and Thompson 1995; Goodhue 1995; Goodhue et al. 2000; Jarupathirun and Zahedi 2005, 2007; Junglas et al. 2008) and the Technology Acceptance Model (Davis et al. 1989; Davis 1989; Venkatesh and Davis 2000). The Task-Technology Fit is understood as a function of the task requirements, the abilities of the respective user, and the functionality offered by the system with greater performance of the system being attributed to enhanced performance of the individual users of the system (i.e. better fit => better performance). The Technology Acceptance Model stresses the prominent role of the perceived usefulness of a system in informing the user’s actual use of a system (i.e. greater usefulness => greater use). The Technology Acceptance Model, in particular, led us to consider the extent of user interaction (i.e. actual use) as a proxy for the perceived usefulness of the system that we analyzed. In order to allow for the iterative improvement of PPGIS through advancing the understanding of the suitability of participatory technologies for specific tasks and users, we suggest that the evaluation of complex participatory systems should address individual differences. In addition, it is reasonable to expect that matching or tailoring the decision support technology and the structure of the decision-making process to the expectations and information needs of © 2014 John Wiley & Sons Ltd
Transactions in GIS, 2014, 18(3)
Understanding User Interaction Patterns for Transportation Planning
403
each individual user will result in more meaningful public participation, by providing for more sustained participation and broader representation. In the next section, we provide background information on the Internet platform for transportation improvement programming by which the data for our analysis was gathered. In Section 3, we describe the recruitment and data collection procedures and the methods used to derive clusters of users with similar use patterns. In addition, we elaborate on the purpose of employing logistic regression analysis in the presented study. In Section 4, we present the results of our analysis as applied to the data at hand as well as its limitations. Lastly, in Section 5, we provide conclusions and give suggestions for future research.
2 Background 2.1 PGIST and LIT The Participatory Geographic Information Systems for Transportation (PGIST) project was a basic-science research project funded by the Information Technology Research Program at the National Science Foundation. Its goal was the development and evaluation of a website to support public participation in regional transportation improvement programming. The name that was given to the website was Let’s Improve Transportation (LIT). The LIT website allowed selected participants, facilitated by a small team of moderators, to partake in a structured planning process involving a variety of analytical and deliberative decision-making tools during a four-week long period. The participants were asked to imagine that they were members of a large citizen advisory committee in charge of providing policy-makers with their recommendations about the make-up of a transportation ballot measure. More specifically, participants determined which proposed transportation improvement projects (from a set of road and transit projects) should be built and which funding mechanisms (i.e. taxes, tolls, and other usage fees) should be used to pay for the improvements. A total of 246 residents of the Puget Sound region were recruited from King, Pierce, and Snohomish Counties to engage in participatory planning through the LIT website. A subset of 179 individuals were eligible for a small stipend for their participation. The amount of the stipend depended on the extent of the participation of each individual and was determined by the number of completed steps in the LIT process, as well as the completion of various data-collection activities that were part of the research design (e.g. online questionnaires and user interviews). For the article at hand, we analyzed a subset of 47 stipend-eligible participants, who completed all steps of the LIT process. A more detailed description of the recruitment process can be found in Nyerges and Aguirre (2011). The LIT process was structured into five main steps which themselves had one to three sub-steps. Participation took place in an asynchronous way, meaning that the participants accessed the LIT website at their own convenience at different times. Certain steps and components of the website were only available during specific time-windows while others could be accessed throughout the duration of the LIT process (see Table 1). The conceptual framework underlying the LIT website and the structure of the LIT process are presented in Young et al. (2007), Lowry et al. (2008), and Zhong et al. (2008). The LIT website www.letsimprovetransportation.org, including the outcomes of the LIT process, is open for exploration through a public guest account. © 2014 John Wiley & Sons Ltd
Transactions in GIS, 2014, 18(3)
404 Table 1
M Swobodzinski and P Jankowski Overview of the LIT steps with their respective availability dates
Description Step 1: Discuss your concerns 1a Map your daily travel 1b Brainstorm concerns 1c Review summaries Step 2: Assess improvement factors 2a Review factors 2b Weigh factors Step 3: Create transportation packages 3a Discuss projectsa 3b Discuss funding optionsa 3c Create your own package Step 4: Select a package for recommendation 4a Discuss candidate packages 4b Vote on candidate packages Step 5: Prepare group report 5a Review draft report 5b Vote on final report a
Date
10/16–10/18 10/16–10/18 10/19–10/22 10/23–10/25 10/23–10/25 10/26–10/31 10/26–10/31 10/29–10/31 11/01–11/06 11/05–11/06 11/07–11/13 11/11–11/13
Available at any given time
3 Methods 3.1 Activity-Based Preprocessing of User Interaction Using the user interaction data that was collected during the LIT process, we derived both a numeric and a textual representation of the use pattern of the LIT participants. More specifically, based on the user interaction events that were captured on the LIT server whenever a script, function, or object on the LIT server was invoked, we extracted use patterns based on sequences of activities that the users engaged in (e.g. reading project descriptions, replying to posts, and voting on comments) as well as the duration of such activities. To analyze the use patterns, we compared classifications derived from hierarchical cluster analysis, using the numeric measure of the duration of activities, and multiple sequence alignment analysis using the text-based sequence of activities. (The scope of the comparative analysis goes well beyond this article and will be summarized here.) For the hierarchical cluster analysis, the measures of overall activity, that is, the total count of activity initiations (i.e. the number of activities the user engaged in) and the total duration of engaging in activities (i.e. the total time spent by each participant interacting with the LIT website), led to viable cluster solutions. Multiple sequence alignment analysis proved to be unreliable for the clustering of the sequences of use patterns. The clustering results for both the overall activity initiations and activity durations are summarized in Table 2. Given the limited expressiveness of the activity initiation measure and concerns about the reliability of multiple sequence alignment analysis for the data at hand, we proceeded with the clusters of the overall activity duration that were derived through hierarchical cluster analysis. The composition of the clusters is discussed further below. © 2014 John Wiley & Sons Ltd
Transactions in GIS, 2014, 18(3)
Understanding User Interaction Patterns for Transportation Planning
405
Table 2 Hierarchical cluster analysis results for the overall interaction duration of the participants based on varying clustering methods. □ indicates a weak classification (i.e. clusters of unbalanced size, including a number of single-case clusters) and ■ a strong classification (i.e. well-formed clusters of relatively comparable size). ▲ is considered to be in-between weak and strong. A strong classification is desirable for the subsequent statistical analysis of the characteristics of the clusters
Activity granularity Clustering method
Activity initiations
Activity durations
between-groups within-groups nearest neighbor furthest neighbor centroid median Ward’s
■ ■ □ ■ ▲ ■ ■
▲ ▲ ▲ ▲ ▲ ▲ ■
3.2 Individual-Level Variables Forty-seven participants completed the LIT process and comprise the sample of subjects for the analysis in this article. During the registrations process and throughout a number of questionnaires, the users were asked to provide insight regarding various aspects of their life. Apart from personal information (e.g. name, mailing address, and work ZIP code), we also asked participants to provide information regarding their sociodemographic background (e.g. gender, age-range, and highest degree earned) and travel behavior (e.g. commuting time and mode of transportation). An 18–item questionnaire administered during the LIT process allowed us also to determine the information-processing preferences of the participants, based on the Cognitive Style Indicator (CoSI) (Cools and Van den Broeck 2007). The CoSI distinguishes between three types of cognitive information processing styles: knowers (four items), planners (seven items), and creators (seven items). Among others, knowers are attributed with an emphasis on facts, logic and rationality, planners with a focus on structure, conformity, and routines, and creators with traits such as flexibility, impulsiveness, and creativity. Knowers and planners are related in so far as these are both cognitive styles of analytical-minded individuals (Cools and Van den Broeck 2008). The CoSI has been shown to have construct validity that is invariant under diverse employment settings, geographic separations, and cultural differences (Cools et al. 2009, 2011). To operationalize the various nominal variables, based on the distribution of the observed responses across the response levels, we collapsed the response levels where appropriate. For instance, familiarity with computers was captured using a numeric 5-item scale (with 1 being novice and 5 expert). Based on the observed responses, we classified the participants into three groups: intermediate (7 participants), advanced (14 participants), and expert (26 participants). None of the LIT participants reported computer familiarity below 3. Similarly, for other variables with few responses for particular response levels, we collapsed response levels to avoid low-count representations of these responses in our data matrix. Given that the group of finishers comprised 47 individuals, with varying response levels for each variable, the © 2014 John Wiley & Sons Ltd
Transactions in GIS, 2014, 18(3)
406
M Swobodzinski and P Jankowski
collapsing of response levels aimed at mitigating data sparsity by decreasing the granularity of the response levels. For instance, income range was captured in steps of $10,000 up to $200,000 which were combined into three groups: (1) < $40,000; (2) $40,000–60,000; and (3) > $60,000. In addition, the three numerical components of the CoSI were used to fold knowers and planners into an analytic group, creators into a creative group, and individuals with inconclusive category membership into a mixed group. A complete list of the individuallevel variables and their respective response levels are given in Table 3.
3.3 Logistic Regression In order to determine whether the hierarchical cluster analysis groupings of similar overall length of interaction had any association with the individual-level variables that were collected throughout the LIT process, we subjected the cluster membership variable to logistic regression analysis. The goal of the logistic regression analysis was to find predictors of overall interaction duration in the context of complex web-based group decision-making systems. If such associations were established, it would allow for the identifying and description of the clusters through the characteristics of the cluster members. The choice of logistic regression over other methods of analysis (e.g. linear regression) was based on the fact that the individual-level variables we invoked as predictor variables were non-numeric in nature (i.e. nominal and ordinal) which made logistic regression most suitable. We hypothesized that there were significant associations between overall duration of interaction with the LIT website and the individual-level characteristics of the participants. The results of the logistic regression analysis are provided in the next section, following the discussion of the composition of the clusters generated by the hierarchical cluster analysis.
4 Results 4.1 Composition of Use Pattern Clusters The hierarchical cluster analysis algorithm that we used in this article belongs to the family of agglomerative clustering algorithms. Agglomerative clustering algorithms assign each individual observation, or case, to a separate cluster. With each subsequent iteration, the numeric difference between the clusters is calculated and similar clusters are merged. Correspondingly, with 47 observations, the starting number of clusters is 47. The single-case clusters are subsequently aggregated into larger multi-case clusters. The respective icicle plot, as the graphical equivalent of the tabular agglomeration schedule, shows the membership of each case for a range of total cluster counts. It captures the relationship between each case and the cluster that it belongs to during the progression of the cluster algorithm from many single-case clusters (during the first iteration) to a single cluster that entails all cases (as in the last iteration). Generally, for small sample sizes, one would be most interested in small single-digit cluster counts greater than one. To assess the robustness of the clusters across different cluster computation methods, we inspected the icicle plots and dendrograms. The former, as stated before, provides insight into the progression of the aggregation of clusters from many to few clusters and the latter visualizes the relative distances between cases for a particular cluster solution. The variance-based clustering method proposed by Ward (1963) uses the squared deviations of the cases in a cluster from the mean of the cluster to establish the distances between © 2014 John Wiley & Sons Ltd
Transactions in GIS, 2014, 18(3)
© 2014 John Wiley & Sons Ltd
male female ≤45 ≥46 60 k single couple family some college college grad grad school
gender
education
annual household income relationship status
age
variable
response
variable
visits online transportation discussions
visits online discussions contributing to discussions
computer experience
Computer Literacy
Sociodemographics
intermediate advanced expert never/rarely regularly never/rarely sometimes often yes no
response
primary mode of transportation affiliation w/ transp. agency attended public meetings communicated concerns to officials
commute time
variable
Travel Behavior
Table 3 Overview on the individual-level variables under analysis and their respective response levels
0−30 min 30−60 min >60 min car other yes no yes no yes no
response
CoSI
variable
analytic creative mixed
response
Cognitive Style
Understanding User Interaction Patterns for Transportation Planning 407
Transactions in GIS, 2014, 18(3)
408
M Swobodzinski and P Jankowski
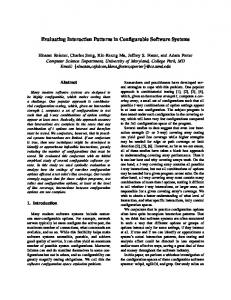
the cases. Two clusters are combined so that the increase in the error sum of squares (i.e. the total of the sums of squared deviations of the cases from the cluster mean calculated over all clusters) is minimal (Burns and Burns 2008; Norusis 2011). The icicle plot resulting from the application of Ward’s method to our dataset is shown in Figure 1. The dendrogram of rescaled distances, on the other hand, visualizes the calculated distances (i.e. dissimilarity) between individual cases. Rather than the absolute numeric distances, it employs normalized distances ranging from 0 (i.e. small dissimilarity) to 25 (i.e. high dissimilarity). The dendrograms of the seven clustering methods that we applied to the overall duration of the user interaction of the LIT participants are shown in Figure 2. Neglecting the differences in rescaled (i.e. standardized) distances between the cases in the various dendrograms, the overall cluster patterns generally reproduce irrespective of the clustering method. Most prominent is the separation of the 47 cases into two clusters separated by a large distance, as reflected by the u-shaped bifurcation whose horizontal elements stretch across most of the distance range. The smaller of the two, in the following referred to as cluster IV, is comprised of the users 44, 42, 46, and 47. The larger cluster partitions into several smaller clusters, as described next. For the remainder of the article, we will focus on the results from Ward’s method for two reasons. First, Ward’s method has been shown to be an efficient and robust clustering method that provides reliable results (Milligan 1981; Ferreira and Hitchcock 2009). Second, the clusters are similar across the clustering methods which indicates that the results from Ward’s method are representative of the data. Taking note of the cases in the 4-cluster solution captured in the icicle plot for Ward’s method (Figure 1), we find three sub-partitions of the larger of the two clusters. Reading the dendrogram for Ward’s method from top to bottom (Figure 3), the first sub-partition, hereafter cluster I, contains 21 cases2 and extends from user 25 to user 45. The second subpartition, cluster II, encompasses the 15 cases3 from user 7 to user 9. Lastly, the third subpartition, cluster III, is comprised of the seven cases4 between user 38 and user 27. There is no visible demarcation between the first and the second sub-partition in the dendrogram since the rescaled distance between them is smaller than 1. Such small distance cannot be resolved graphically given the integer division of distances along the x-axis in the plotted dendrogram. The descriptive statistics, including the range, mean, and standard deviation of the overall duration of interaction for each cluster are provided in Table 4. Based on the mean of overall duration for each cluster, we find that the participants grouped in cluster IV, the smallest cluster of the quartet with four cases, spent an average of 631.47 minutes interacting with LIT. The minimum for cluster IV was 523.63 minutes which is more than twice as long as the maximum of the seven-participant group in cluster III, the cluster with the subsequently longest average interaction duration. The largest cluster, constituted by cluster I with 21 participants, exhibited an average interaction duration of 102.25 minutes. The shortest average duration of 37.17 minutes was found with the second-to-largest cluster, cluster II (15 participants). The duration values in cluster II ranged from 6.15 to 52.37 minutes with a standard deviation of 14.06 minutes. Overall, for all of the 47 participants as a single group, the mean duration of interaction with the LIT website was 140.25 minutes.
4.2 Logistic Regression Coefficients and Significance Cluster I was chosen as the reference category since the mean duration of interaction of its members was closest to the mean of all 47 participants. Furthermore, cluster I comprised the © 2014 John Wiley & Sons Ltd
Transactions in GIS, 2014, 18(3)
Figure 1 Icicle plot for the hierarchical cluster analysis of the measure of overall user interaction using Ward’s method. Unique user identifiers are printed along the x-axis and numbers of clusters along the y-axis
Understanding User Interaction Patterns for Transportation Planning
© 2014 John Wiley & Sons Ltd
409
Transactions in GIS, 2014, 18(3)
410
M Swobodzinski and P Jankowski
Figure 2 Dendrograms for the measures of the duration of overall activity. The x-axis shows the normalized distance between clusters (ranging from 0 to 25) and the y-axis carries the identifier for each case. The employed difference measure is squared Euclidean distance © 2014 John Wiley & Sons Ltd
Transactions in GIS, 2014, 18(3)
Understanding User Interaction Patterns for Transportation Planning
Figure 2
411
Continued
© 2014 John Wiley & Sons Ltd
Transactions in GIS, 2014, 18(3)
412
M Swobodzinski and P Jankowski
Figure 3 Dendrogram of the hierarchical cluster analysis of the measure of overall user interaction using Ward’s method. The x-axis displays the normalized distance between clusters and the y-axis unique identifiers (in the form of ‘Userxx’) for each case © 2014 John Wiley & Sons Ltd
Transactions in GIS, 2014, 18(3)
Understanding User Interaction Patterns for Transportation Planning
413
Table 4 Descriptive statistics for the four-cluster Ward solution. The results are listed by cluster ID. The underlying values are duration of interaction measured in minutes
cluster
n
I 21 II 15 III 7 IV 4 all 47 participants:
minimum
maximum
mean
median
st.dev.
76.70 6.15 157.38 523.63
131.53 52.37 256.03 678.62
102.25 37.17 194.38 631.47 140.25
100.02 39.73 183.68 661.82 96.33
17.47 14.06 41.04 72.42 162.19
largest number of cases which reinforced its selection as the reference category. To give greater expressive power to our logistic regression models, we aggregated the individuals in cluster III and IV into a single cluster (n = 11) rather than maintaining two separate clusters. The aggregation of the two clusters was prompted by the occurrence of exceptions during initial runs of the calculation of the regression coefficients. The exceptions were due to low frequency counts in the cells of the cross-tabulation matrix of the outcome and predictor variable response levels due to the small size of the two clusters (i.e. n = 7 and n = 4). We computed 15 logistic regression models, one for each combination of the cluster membership variable, as the dependent variable, and one of the individual-level variables from Table 3, as the predictor variable. As reported in Table 5, the model with the dichotomous yes/no predictor variable, resulting from the participants’ answers to the question of whether he or she had visited online transportation discussions prior to the LIT process, resulted in a significant model fit estimate (p-value of 0.048; not reported in Table 5). For the same model, we found a significant logistic regression coefficient of −1.386 (see column B) for the ‘no’ response (i.e. the individual had not participated in online transportation discussions) with a p-value of 0.013. Having not participated in online transportation discussions prior to the LIT process was associated with an odds ratio of 0.25 for being in cluster III or IV (i.e. the above average clusters) versus the reference category (i.e. the cluster with average interaction duration). Translated into percentages (using the formula percentodds = (Exp(B) − 1) * 100), not having engaged in online transportation discussions prior to participating in the LIT process led to a 75% decrease in the odds ratio of being in cluster III or IV, compared with the reference category. In conclusion, lacking prior experience with online transportation discussions made it four times less likely for such participants to have spent above average time with the LIT website. In another model, the intercept (i.e. all predictor variable coefficients set to zero) for the income variable was significant with a p-value of 0.05. However, the model fit was non-significant. The model fit for the relationship status came close to the 5% threshold with a p-value of 0.083. Its model coefficients, however, were non-significant. No other model resulted in a significant overall model fit as well as a significant regression coefficient.
4.3 Discussion 4.3.1 The use pattern clusters Considering that the LIT process took place over a period of four weeks, it stands to reason that cluster II, with a minimum of interaction of 6.15 minutes, constituted a small minority of © 2014 John Wiley & Sons Ltd
Transactions in GIS, 2014, 18(3)
© 2014 John Wiley & Sons Ltd
a
3
2
The reference category is: 1
No history of participating in online transportation discussions History of participating in online transportation discussions No history of participating in online transportation discussions History of participating in online transportation discussions
Cluster Membershipa
.559 .586
.336
.730
−.511 −1.386
.382
Std. Error
−.288
B
.330
6.150
.489
.568
Wald
1
1
1
1
df
.566
.013
.484
.451
Sig.
1.400
.250
.600
.750
Exp(B)
.444
.084
.143
.355
Lower Bound
4.411
.748
2.511
1.585
Upper Bound
95% Confidence Interval for Exp (B)
Table 5 Logistic regression coefficients (under column B) and significance levels for the association between activity duration and prior experience with online transportation discussion forums. The reference category is cluster 1 (I), that is, the cluster of participants with average interaction duration. The model coefficients are derived relative to the reference category. Cluster 2 (II) is comprised of individuals with less than average and cluster 3 (III + IV) of individuals with above average interaction. The intercept was not included in the model
414 M Swobodzinski and P Jankowski
Transactions in GIS, 2014, 18(3)
Understanding User Interaction Patterns for Transportation Planning
415
individuals who did not spent any extended time interacting with the LIT website. This finding is confounded by the mean of 37.17 and the median of 39.73 for this group (indicating a negative skew). In fact, three individuals in that cluster interacted with the LIT process well below the mean of this cluster, with interaction durations of 6.15, 16.43, and 16.78 minutes. Presumably, these three individuals were interested in the LIT process for reasons other than meaningful participation in transportation improvement planning. (Awarding a stipend for the completion of certain steps in the LIT process might explain this behavior.) Taking into consideration the number of activities (e.g. questionnaires and deliberation) in the LIT process, cluster II was characterized by an overall short duration of interaction. On the other hand, the large difference in the mean duration of interaction between cluster IV and the remaining clusters provided a quantifier for the large (rescaled) separation of the clusters that was apparent in the respective dendrogram (Figure 3). The four participants in cluster IV, with a mean duration of interaction of more than 10.5 hours, represented the other end of the spectrum of participation as far as the time commitment to the LIT process was concerned. Hence, cluster IV can be interpreted as the cluster with exceptionally long duration of interaction when considering the voluntary nature of the LIT process. Correspondingly, the remaining two clusters can be labeled based on the interaction that was observed of the participants within each cluster. Apart from being the largest cluster, the mean and mode of cluster I were closest to the respective values of all of the 47 participants. (As discussed before, this cluster was selected as the baseline or reference category for the logistic regression analysis.) Lastly, the duration of interaction in cluster III fell between the extremes of low and high interaction, but went well beyond the average duration observed in cluster I. Hence, clusters II, I, III, and IV represent an ordinal progression of interaction duration from low, over average and above-average, to high. Further investigation would be required to identify the factors that motivated the participants to engage in or refrain from a thorough interaction with the LIT process. Such investigation, however, is beyond the scope of this article.
4.3.2 Logistic regression results Since all but one of the single-predictor logistic regression models bore non-significant regression coefficients, we conclude that for the 47 participants who completed the LIT process, the overall duration of interaction was generally not informed by the individual-level characteristics of the participants that were analyzed. In the case of prior experience with online transportation discussions, which presumably reflects select participants’ pervasive interest in transportation, we found a statistically significant association with overall duration of interaction. We suggest two possible explanations for such results. First, we theorize that the structure of the LIT process, and the group decision-making process that it embedded, led to a normalization of user interaction as far as overall duration of interaction is concerned. The results that we observed are supported by the framing of the LIT process as an activity in deliberative democracy – a conceptualization that was adopted by the researchers in the PGIST project. As a result, components that were theorized to support deliberative interactions among the participants were emphasized in the system design of LIT. Foremost, online discussion forums were seen as a means of fostering meaningful and substantive interaction. It is questionable, however, if these discussion forum mechanisms furthered the engagement of all of the participants or catered to a self-selected minority of committed participants with prior, possibly extensive experience with online discussion forums and transportation issues. © 2014 John Wiley & Sons Ltd
Transactions in GIS, 2014, 18(3)
416
M Swobodzinski and P Jankowski
Secondly, overall interaction duration might be too general a signal to uncover associations between individual-level variables and overall duration of interaction. More specifically, significant associations might emerge when the dependent variable were derived from more granular observations of user interaction. For instance, based on work on electronic discussion groups (e.g. Beaudoin 2002; Preece et al. 2004; Schlosser 2005; Dennen 2008), a dichotomous variable could be derived that classifies the participants based on their engagement with the LIT discussion forum as either passive consumers (or lurkers) and active contributors (or posters). In such scenario, one might expect variations in the association between discussion consumption/contributions and a variable such as cognitive style based on the thematic context of the discussion. One might imagine an information-rich discussion about aspects of a particular transportation project that might exert a strong pull on knowers. On the other hand, a conceptual discussion on the merits of online transportation planning might resonate with creators rather than planners and knowers. A multitude of combinations are thinkable that lend themselves to a hypothesis-driven analysis of dependent variables that were derived from the observed user interaction patterns using alternative (i.e. non-cluster based) procedures. With the analysis presented in this article, they share a concern for the robust evaluation of user interaction in the context of complex participatory systems that extends beyond the limits of approaches relying on the stated satisfaction of the users.
4.4 Limitations The dataset at hand did not allow us to investigate multi-predictor models due to unexpected singularities in the Hessian matrix, that is, the matrix of second derivatives used for the calculation of the maximum likelihood estimates in the logistic regression model. These singularities arose from data sparsity with portions of the data not having adequate data coverage to provide reliable multi-predictor models. As a consequence, we opted for single-predictor models and collapsed the response levels of both the dependent and predictor variables. A larger dataset would have mitigated these limitations. In the context of public participation in planning, minimizing participation attrition is closely tied to the question of what contains meaningful participation and how it can be sustained over time. The latter question holds strong merit for future research and needs to be addressed on various levels. Despite the collapsing of response levels in the predictor variables, the distribution of individuals in the three activity duration clusters led to singularities in the logistic regression model for computer literacy. These were prompted by the circumstance that no individuals with intermediate computer skills were part of the group with above average interaction duration (i.e. cluster III). Consequently, we aggregated the observations with intermediate and advanced computer literacy into one response level and repeated the logistic regression analysis. In both models (with and without singularities), the resulting regression coefficients and model fits were non-significant. As far as the completeness of the dataset is concerned, eight participants did not disclose information pertaining to their income. Five of these cases were classified in cluster III and IV. This resulted in a decrease of the valid cases in the aggregate “above average” cluster from 11 to six, which reduced the statistical expressiveness of the logistic regression model with income as the predictor variable. In addition, the primary mode of transportation was inferred from responses in regard to the mode of transportation for the daily commute of the participants. Since four individuals (three from cluster I and one from cluster III) indicated that they did not commute, we only had mode-of-transportation data for 43 cases. Similarly, one individual in cluster III did not report his or her age. © 2014 John Wiley & Sons Ltd
Transactions in GIS, 2014, 18(3)
Understanding User Interaction Patterns for Transportation Planning
417
Finally, the cognitive style indicator was not readily usable based on the three scores of the participants along the knower, planner, and creator dimension. A single individual (from cluster II) answered all CoSI questionnaire items with the same score and was therefore excluded from the regression analysis of cluster membership and cognitive style. Furthermore, a majority of the participants loaded strongly into two of the three dimensions (rather than a single one) which necessitated the introduction of a mixed category and the classification of cognitive styles based on the following approach: if both the knower and planner scores of a particular participant were higher than the creative score, the participant was classified as analytic; if the creator score was higher than the two analytic scores, the participant was considered creative. All other cases were labeled as mixed.
5 Conclusions and Future Work In this article we explored the statistical association between groups of individuals with similar use patterns with the LIT website, an Internet platform for participatory transportation improvement planning. Using groupings of participants with similar duration of interaction generated through hierarchical cluster analysis, we observed four separate clusters that were further aggregated to reflect groups of participants with below average, average, and above average interaction duration. Given its documented reliability, we opted to use Ward’s clustering method for the subsequent analysis of the significance and strength of the statistical association between cluster membership and a host of individual-level variables related to: (1) sociodemographics; (2) cognitive style; (3) computer literacy; and (4) travel behavior. The statistical association between the cluster membership and the individual-level variables was explored through logistic regression analysis. A significant association was found between prior experience with online discussion forums and above average duration of interaction with the LIT website. The extent of the engagement of the 47 participants under analysis could not be predicted by sociodemographic, travel behavior, or cognitive style. The findings presented in this article are two-fold. First, we observed individual differences in terms of overall duration of interaction that allowed us to separate participants into three groups with pronounced differences in interaction duration. As might be expected for the realm of public-participation in planning, the extent of participation varied widely among participants. Second, duration-based groupings of overall interaction with the LIT website could only be explained through a single individual-level variable, that is, the existence of prior experience with online discussions. Given the small size of our dataset, we were not able to investigate more granular, component-based groupings of individual use patterns. However, our findings inform research directions regarding the exploration of approaches to the analysis of use patterns other than the stated satisfaction of the users with the system. In regard to the design of the LIT website, we conclude that neither the layout nor the availability of decision-making tools in the LIT website overrode individual differences in the usage of the tools. Having said that, the role of individual predispositions (e.g. motivation, beliefs, and values) and the vested interest of the participants in the decision-making context (as one possible catalyst for meaningful and sustained participation) adds to the complexity of investigating the task-technology fit at the user, task, and technology nexus and warrants further research into the association between one-size-fits-most user interfaces, interaction duration, and sustained participation. Having said that, we suggest that user interfaces, as part © 2014 John Wiley & Sons Ltd
Transactions in GIS, 2014, 18(3)
418
M Swobodzinski and P Jankowski
of the design of complex decision-support systems, provide a frame of reference for the thinking of the users and their interactions with each other. In turn, system design choices have direct ramifications for user interaction which can be inhibited or enhanced through such choices. As showcased by the prominent role of discussion forums in the LIT process, a small number of participants invested time and effort into this deliberation-oriented form of interaction whereas others refrained from contributing. Given the existence of differences in individual expectations and needs regarding decision support technologies, we advocate, as has been put forward by others (Geertman 2002; Haklay and Tobón 2003; Aggett and McColl 2006), adaptable participatory systems and flexible participatory processes. In this context, future research efforts should employ a multitude of perspectives, methods, and indicators that aim at differentiating between aspects of usability, usefulness, utilization, performance, and success of decision-support systems and the decision-making process that they support. We posit that insights that originate from diverse points of view will lead to a better understanding of the complexity regarding the fit between the decision-making task and the employed technology. In turn, the advancement of such fit will increase the participation of each individual or, at least, provide for each participant to maximize their participation according to individual preferences, abilities, and experiences. We expect this to counteract participation attrition, foster meaningful, sustained participation, and empower participants in technology-mediated planning activities. Having said that, identifying provisions for sustained and meaningful participation will not depend solely on the analysis of user interaction as presented in this article, but will need to be investigated using a holistic approach that incorporates indicators of individual attitudes and interests. Taking one step in this direction, we are in the process of contextualizing the analysis of individual choice making in the LIT process within the specific context of public-participation transportation improvement programming. More specifically, our focus is on the exploration of the concrete, thematic choice making of each participant in the LIT process. In the words of Golledge and Stimson (1997), we emphasize the stated over the revealed preferences of the LIT participants in regard to individual selections of transportation projects that were captured as part of the LIT process. This will lend another perspective from which to assess the success of the LIT website, in particular, and participatory decision-making in transportation planning, in general.
Notes 1 For instance, spatial cognition (Davis 1993; Freundschuh and Egenhofer 1997; Montello et al. 1999; Ishikawa and Montello 2006) and geovisualization (Gahegan 1999; MacEachren and Brewer 2004; MacEachren 2005; MacEachren and Cai 2006; Andrienko et al. 2007; Fabrikant et al. 2008). 2 Full list of users: 25, 41, 19, 32, 21, 34, 43, 18, 37, 20, 26, 23, 8, 14, 16, 28, 33, 24, 39, 29, and 45 3 Users 7, 2, 1, 22, 3, 11, 4, 6, 15, 5, 17, 10, 12, 13, and 9. 4 Users 38, 30, 36, 31, 40, and 27.
References Aggett G and McColl C 2006 Evaluating decision support systems for PPGIS applications. Cartography and Geographic Information Science 33: 77–92 Andrienko G, Andrienko N, Jankowski P, Keim D, Kraak M-J, MacEachren A, and Wrobel S 2007 Geovisual analytics for spatial decision support: Setting the research agenda. International Journal of Geographical Information Science 21: 839–57 © 2014 John Wiley & Sons Ltd
Transactions in GIS, 2014, 18(3)
Understanding User Interaction Patterns for Transportation Planning
419
Beaudoin M F 2002 Learning or lurking? Tracking the invisible online student. The Internet and Higher Education 5: 147–55 Bhargava H K, Power D J, and Sun D 2007 Progress in web-based decision support technologies. Decision Support Systems 43: 1083–95 Burns R B and Burns R A 2008 Business Research Methods and Statistics using SPSS. Thousand Oaks, CA, Sage Publications Choi J-Y, Engel B A, Theller L, and Harbor J 2005 Utilizing web-based GIS and SDSS for hydrological land use change impact assessment. Transactions of the American Society of Agricultural Engineers 48: 815–22 Cools E and Van den Broeck H 2007 Development and validation of the cognitive style indicator. Journal of Psychology 14: 359–87 Cools E and Van den Broeck H 2008 Cognitive styles and managerial behaviour: A qualitative study. Education and Training 50: 103–14 Cools E, Van den Broeck H, and Bouckenooghe D 2009 Cognitive styles and person-environment fit: Investigating the consequences of cognitive (mis)fit. European Journal of Work and Organizational Psychology 18: 167–98 Cools E, De Pauw A-S, and Vanderheyden K 2011 Cognitive styles in an international perspective: Crossvalidation of the cognitive style indicator. Psychological Reports 109: 59–72 Davis B G 1993 Tools for Teaching. San Francisco, CA, Jossey-Bass Publishers Davis F D 1989 Perceived usefulness, perceived ease of use, and user acceptance of information technology. MIS Quarterly 13(3): 319–40 Davis F D, Bagozzi R P, and Warshaw P R 1989 User acceptance of computer technology: A comparison of two theoretical models. Management Science 35(8): 982–1003 Dennen V P 2008 Pedagogical lurking: Student engagement in non-posting discussion behavior. Computers in Human Behavior 24: 1624–33 Dymond R L, Regmi B, Lohani V K, and Dietz R 2004 Interdisciplinary web-enabled spatial decision support system for watershed management. Journal of Water Resources Planning and Management 130: 290–300 Elwood S 2006 Critical issues in participatory GIS: Deconstructions, reconstructions, and new research directions. Transactions in GIS 10: 693–718 Fabrikant S I, Rebich-Hespanha S, Andrienko N, Andrienko G, and Montello D R 2008 Novel method to measure inference affordance in static small-multiple map displays representing dynamic processes. Cartographic Journal 45: 201–15 Ferreira L and Hitchcock D B 2009 A comparison of hierarchical methods for clustering functional data. Communications in Statistics: Simulation and Computation 38: 1925–49 Freundschuh S and Egenhofer M 1997 Human conceptions of spaces: Implications for GIS. Transactions in GIS 2: 361–75 Gahegan M 1999 Four barriers to the development of effective exploratory visualisation tools for the geosciences. International Journal of Geographical Information Science 13: 289–309 Galesic M and Bosnjak M 2009 Effects of questionnaire length on participation and indicators of response quality in a web survey. Public Opinion Quarterly 73: 349–60 Geertman S 2002 Participatory planning and GIS: A PSS to bridge the gap. Environment and Planning B 29: 21–35 Ghose R 2001 Use of information technology for community empowerment: Transforming geographic information systems into community information systems. Transactions in GIS 5: 141–63 Golledge R G 2006 Philosophical bases of behavioral research in geography. In Aitken S C and Valentine G (eds) Approaches to Human Geography. London, SAGE: 75–85 Golledge R G 2008 Behavioral geography and the theoretical/quantitative revolution. Geographical Analysis 40(3): 239–57 Golledge R G and Stimson R J 1997 Spatial Behavior: A Geographic Perspective. New York, Guilford Press Goodhue D L, Klein B D, and March S T 2000 User evaluations of IS as surrogates for objective performance. Information and Management 38(2): 87–101 Goodhue D L 1995 Understanding user evaluations of information systems. Management Science 41(12): 1827–44 Goodhue D L and Thompson R L 1995 Task-technology fit and individual performance. MIS Quarterly 19(2): 213–36 Haklay M and Tobón C 2003 Usability evaluation and PPGIS: Towards a user-centred design approach. International Journal of Geographical Information Science 17: 577–92 Ishikawa T and Montello D R 2006 Spatial knowledge acquisition from direct experience in the environment: Individual differences in the development of metric knowledge and the integration of separately learned places. Cognitive Psychology 52: 93–129
© 2014 John Wiley & Sons Ltd
Transactions in GIS, 2014, 18(3)
420
M Swobodzinski and P Jankowski
Jankowski P, Ligmann-Zielinska A, and Swobodzinski M 2008 Choice modeler: A web-based spatial multiple criteria evaluation tool. Tranactions in GIS 12(4): 541–561 Jankowski P, Nyerges T, Robischon S, Ramsey K, and Tuthill D 2006 Design considerations and evaluation of a collaborative, spatiotemporal decision support system. Transactions in GIS 10: 335–54 Jarupathirun S and Zahedi F 2005 GIS as spatial support systems. In Pick J B (ed) Geographic Information Systems in Business. Hershey, PA, Idea Group Publishing: 151–74 Jarupathirun S and Zahedi F 2007 Exploring the influence of perceptual factors in the success of web-based spatial DSS. Decision Support Systems 43: 933–51 Junglas I, Abraham C, and Watson R T 2008 Task-technology fit for mobile locatable information systems. Decision Support Systems 45: 1046–57 Kyem P A K 2004 Of intractable conflicts and participatory GIS applications: The search for consensus amidst competing claims and institutional demands. Annals of the Association of American Geographers 94: 37–57 Lowry M B, Nyerges T L, and Rutherford G S 2008 Internet portal for participation of large groups in transportation programming decisions. Transportation Research Record 2077: 156–65 MacEachren A M 2005 Moving geovisualization toward support for group work. In Dykes J, MacEachren A M, and Kraak M-J (eds) Exploring Geovisualization. Kidlington, Oxford, UK, Elsevier Ltd.: 445–61 MacEachren A M and Brewer I 2004 Developing a conceptual framework for visually-enabled geocollaboration. International Journal of Geographical Information Science 18(1): 1–34 MacEachren A M and Cai G 2006 Supporting group work in crisis management: Visually mediated human-GIShuman dialogue. Environment and Planning B 33: 435–56 Milligan G W 1981 A review of Monte Carlo tests of cluster analysis. Multivariate Behavioral Research 16: 379–407 Montello D R, Lovelace K L, Golledge R G, and Self C M 1999 Sex-related differences and similarities in geographic and environmental spatial abilities. Annals of the Association of American Geographers 89: 515–34 Norusis M 2011 IBM SPSS Statistics: 19, Statistical Procedures Companion. Boston, MA, Addison Wesley Nyerges T and Aguirre R W 2011 Public participation in analytic-deliberative decision making: Evaluating a large-group online field experiment. Annals of the Association of American Geographers 101: 561–86 Preece J, Nonnecke B, and Andrews D 2004 The top five reasons for lurking: Improving community experiences for everyone. Computers in Human Behavior 2: 201–23 Rinner C 2003 Web-based spatial decision support: Status and research directions. Journal of Geographic Information and Decision Analysis 7(1): 14–31 Rinner C 2007 A geographic visualization approach to multi-criteria evaluation of urban quality of life. International Journal of Geographical Information Science 21: 907–19 Schlosser A E 2005 Posting versus lurking: Communicating in a multiple audience context. Journal of Consumer Research 32: 260–65 Sieber R 2006 Public Participation Geographic Information Systems: A literature review and framework. Annals of the Association of American Geographers 96: 491–507 Srdjevic B 2007 Linking analytic hierarchy process and social choice methods to support group decision-making in water management. Decision Support Systems 42(4): 2261–73 Szczur M 1994 Usability testing on a budget: A NASA usability test case study. Behaviour and Information Technology 13(1–2): 106–18 Venkatesh V and Davis F D 2000 A theoretical extension of the Technology Acceptance Model: Four longitudinal field studies. Management Science 46(2): 186–204 Ward J 1963 Hierarchical grouping to optimize an objective function. Journal of the American Statistical Association 58: 236–44 Young R, Zhong T, Lowry M, Rutherford G S, and Nyerges T 2007 An analytical-deliberative online framework for transportation programming. International Journal of Technology, Knowledge, and Society 3: 89–98 Zhong T, Young R K, Lowry M, and Rutherford G S 2008 A model for public involvement in transportation improvement programming using participatory geographic information systems. Computers, Environment and Urban Systems 32: 123–33
© 2014 John Wiley & Sons Ltd
Transactions in GIS, 2014, 18(3)