2006 The Regents of The University of California. Created by SEPUP, Lawrence Hall of Science, Berkeley, California. Adap
It’s Catching!
G
30 MO
I DEL
N
D
ifferent diseases are caused by different factors, such as germs, heredity, or even the environment. Some diseases caused by germs are infectious (in-FEK-shuss), which means that they can be passed from one person to another. Many infectious diseases, such as chickenpox, are more common among children. How quickly can an infectious disease spread among a group of people? What can be done to stop more people from getting sick?
CHALLENGE How does an infectious disease spread in a community?
MATERIALS For each group of four students 1
dropper bottle of Disease Indicator
For each pair of students 1
large plastic cup containing “saliva”
For each student 1
SEPUP tray
1
dropper
1
Student Sheet 30.1, “Tracking the Disease”
For the Extension additional copies of Student Sheet 30.1
C-4
© 2006 The Regents of The University of California. Created by SEPUP, Lawrence Hall of Science, Berkeley, California. Adapted with permission. All rights reserved.
It’s Catching! • Activity 30
PROCEDURE Part One: Planning Your Day 1. In Table 1, “My Movements” (on Student Sheet 30.1, “Tracking the Disease”), fill in the Place column by listing the one place or event that you plan to go to each day.
REMINDER Good laboratory procedure means no accidental contamination! Be sure to follow the directions and be careful with your dropper. 2. Use your dropper to put 10 drops of “saliva” from the large plastic cup into large Cup A of your SEPUP tray. 3. Use your dropper to fill Cup B 3⁄4–full of “saliva” from the large plastic cup. 4. After you and your partner have completed Steps 2 and 3, return the large plastic cup to your teacher.
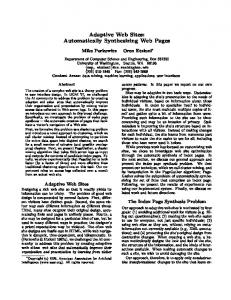
Part Two: Meeting Other People Your teacher will guide you through Steps 5–8. 5. On Day 1, go to the place you chose and recorded in Table 1 on Student Sheet 30.1. Then: a. Read the card to determine the number of people with whom you should exchange “saliva.” (If no one else is at this place, you do not need to do anything.) b. Exchange “saliva” with people at this place by using your dropper to transfer 10 drops of solution from your Cup B into Cup B of the other student’s tray while the other student transfers 10 drops of solution from his or her Cup B into Cup B of your tray. Cup B should now contain about the same amount of solution with which you started. Exchange 10 drops with another person Move 1/2 of the solution to Cup C
c. Use your dropper to remove half of the solution from your Cup B and place it into Cup C of your own SEPUP tray.
➢ © 2006 The Regents of The University of California. Created by SEPUP, Lawrence Hall of Science, Berkeley, California. Adapted with permission. All rights reserved.
C-5
Activity 30 • It’s Catching!
6. On Day 2, go to the place you chose in Table 1. Repeat Steps 5a and 5b, but this time, transfer solutions in Cup C. 7. Use your dropper to remove half of the solution from your Cup C and place it into Cup D of your own SEPUP tray. 8. On Day 3, go to the place you chose in Table 1. Repeat Steps 5a and 5b, but this time, transfer solutions in Cup D.
Part Three: Getting Tested 9. Did you catch the disease? Find out by testing Day 3 (Cup D) by adding 2 drops of Disease Indicator. If you have been infected with the disease, the solution will change color. If the solution does not change color, congratulations—you have escaped catching the disease this time! Record your results in Table 1 on Student Sheet 30.1. 10. If you were infected with the disease, when did you get it? Find out by testing your initial “saliva” (Cup A), Day 1 (Cup B), and Day 2 (Cup C). Record your results in Table 1 on Student Sheet 30.1. 11. Use the class data to complete Table 2, “Class Results,” on Student Sheet 30.1. 12. Use the data in Table 2 to create a line graph of the number of infected people over time. Be sure to include the initial data (Day 0), to label your axes, and to title your graph.
EXTENSION As a class, repeat the activity. Be sure to choose different places to visit or events to attend. Did the disease spread within your community in the same way? What similarities or differences do you observe? What role do the initially infected people play in affecting the spread of disease?
C-6
© 2006 The Regents of The University of California. Created by SEPUP, Lawrence Hall of Science, Berkeley, California. Adapted with permission. All rights reserved.
It’s Catching! • Activity 30
ANALYSIS 1. Use your graph of the class results to answer the following questions: a. What happened to the number of people infected with the disease over time? b. How does this compare to your initial prediction? Explain. 2. Think about how the infectious disease was spread from person to person in your community. If you were trying to avoid catching the disease, what could you do? Use evidence from this activity to support your answer. 3. a. Imagine that you are the director of the health department in the town where this disease is spreading. It is your job to help prevent people from getting sick. Explain what you would recommend to try to prevent more people from getting infected. b. What are the trade-offs of your recommendations? 4. What are the strengths and weaknesses of this model for the spread of infectious diseases? 5. Could you use this activity to model how diseases that are not infectious are spread? Explain.
© 2006 The Regents of The University of California. Created by SEPUP, Lawrence Hall of Science, Berkeley, California. Adapted with permission. All rights reserved.
C-7


![[PDF] Download C++ Primer (5th Edition) Pages Full - Google Sites](https://m.moam.info/img/260x300/pdf-download-c-primer-5th-edition-pages-full-googl_6477fd01097c4796708c4fc4.jpg)


![[PDF] Download Problem Solving with C++ Pages Full - Google Sites](https://m.moam.info/img/260x300/pdf-download-problem-solving-with-c-pages-full-goo_64789899097c4744708d0214.jpg)

![[PDF] Download C++ Primer (5th Edition) Pages Full - Google Sites](https://m.moam.info/img/260x300/pdf-download-c-primer-5th-edition-pages-full-googl_6477df8d097c474d228c8638.jpg)

![[PDF] Download Functional Programming in C# Pages ... - Google Sites](https://m.moam.info/img/260x300/pdf-download-functional-programming-in-c-pages-goo_64785c44097c474c228d0cd6.jpg)
