DOI 10.2298/CSIS110106043C
Usage of Technology Enhanced Learning Tools and Organizational Change Perception 1
2
1
Mladen Čudanov , Gheorghe Savoiu , and Ondrej Jaško
1 University of Belgrade, Faculty of Organizational Sciences, Jove Ilića 154, 11000 Belgrade, Serbia {mladenc, jasko} @fon.rs 2 University of Pitesti, Faculty of Economics Sciences, Str. Targu din Vale nr. 1, 110040 Pitesti, Arges, Romania
[email protected]
Abstract. This paper presents an analysis of organizational changes perceived by the employees in the organizations where Technology Enhanced Learning was facilitated by tools such as wiki, (we)blog, Internet forum and social network, practice often considered as Elearning 2.0. Our research focuses on the technologically advanced organizations, leaders in the ICT and IS adoption. We specifically observe the perception of influence on the organizational structure, organizational culture and the knowledge management processes in the organization. Our findings are that the TEL tools are perceived to have a noteworthy impact on the organizational change in the three mentioned areas, and that the perception of change significantly differs depending on whether the employees are regular or are not regular users for organizational structure and knowledge management processes. Keywords: Organizational change, TEL, E-learning 2.0, Web 2.0, wiki, blog, Internet forum, social network, organizational structure, organizational culture, knowledge management.
1.
Introduction
Contemporary organizations are influenced by an exponentially growing volume of technological changes. Outstanding among those technological changes is the change in information and communication technologies (ICT), sometimes suitably called a revolution. In an overall scope of ICT applied in the organizations we can find the technologies that support learning processes, which is logical, since knowledge is based on information. The technological support to any learning activity is in its widest terms dubbed Technology Enhanced Learning (hereinafter: TEL). The research in this field covers mostly technological and academic application aspects, but the literature analyzing the impact on the organizations is scarce. The concept of TEL is specific in its wider scope, limited to neither academic nor other educational applications. Therefore the term has been chosen instead of E-
Mladen Čudanov, Gheorghe Savoiu, and Ondrej Jaško
learning 2.0 although, from the technological aspect, E-learning 2.0 is more appropriate due to social network usage and Web 2.0 technologies. In this paper we will analyze the impact that technologies commonly used for TEL have on organizational structure, culture and knowledge management processes, describing TEL in business environment. In a host of other technologies, TEL is facilitated today by Wikis, forums, blogs [1], social networks and other interactive technologies that allow the teacher, the learner and the administration functions [2], but is not limited to the mentioned technologies used as example in the case of this research. Different aspects of organization have been connected to technology since the beginnings of the scientific approach to management, to mention e.g., Frederick Winslow Taylor, but the groundbreaking work was that of Joan Woodward [3], in which relations were established between the success of the organization and the conformity of the organizational structure, on one side, and technology, on the other. Some criticism also emerged as Aston group estimated that the impact of technology on the organization is more limited than it was stated in Woodward's earlier research [4]. The research that followed only reconfirmed the links of organizational structures with technology, and introduced new factors, in addition to purely technologic artifacts, namely, the recurrent social practices in technology implementation and the community of users [5]. The contemporary research finds the influence of organizational structures and technology to be complementary [6] and reconfirms the existence of the relationship between technology and the governing structure [7,8]. In accordance with the previous analysis, we found theoretical background to study the impact that specific technologies and tools, common in TEL, have on organizations. Therefore, the following hypotheses are proposed: H1: The perception of TEL tools usage impact on the organizational structure significantly differs between the employee groups pursuing regular and non-regular TEL usage H2: The perception of TEL tools usage impact on the organizational culture is significantly different between employee groups with regular and nonregular TEL usage H3: The perception of TEL tools usage impact on knowledge management practices in organization is significantly different between employee groups with regular and non-regular TEL usage
2.
Methods
In order to empirically check whether there is any perceived influence that the implementation of TEL tools has on organizational changes, we have conducted a survey among the employees in knowledge based industries
286
ComSIS Vol. 9, No. 1, January 2012
Usage of Technology Enhanced Learning Tools and Organizational Change Perception
(e.g. software engineering, business analysis, consulting, high education, design) that are supposed to use the TEL tools widely. Since the term TEL is not well known to the population, tools like wiki, forums, blog and social networking were explicitly presented to respondents as Web 2.0 concepts that can be used as TEL tools. The organizations to serve as samples were carefully chosen in order to represent the population of technology advanced organizations. Overall, we have gathered 55 responses online and 45 responses in paper as a response to more than 250 invitations. There were 6 questionnaires with missing values. This survey was part of a larger research effort that also included a dissemination of Web 2.0 and TEL tools and loyalty shifts from the company as an entity to industry as a group of connected individuals somewhat resembling a medieval guild (without restrictions), which in turn might be the topic of future papers. The survey consisted of a descriptive part, where respondents stated their industry, working experience, company size, average number of forum, wiki, blog and social networks used for the sake of job tasks and open comments. A large number of interviewed personnel in our sample was working in software engineering/development (26), education (15), marketing related professions (14) or high education (12). The total working experience ranged between six months and 30 years, the mean being 6.18 years and the standard deviation amounting to 4.70. The respondents evaluated their perception of influence on the structure, the culture and the knowledge management practices on a scale from 1-10, where 1 was described as an extremely low and 10 as an extremely high influence. Important terms were described for the convenience of respondents, and definitions were proposed on questionnaire in order to ensure the understanding among parties. The organizational structure was defined as a formal system of hierarchy, coordination, communication and control in the company. The organizational culture was defined as a system of beliefs, values, customs, behaviours and traditions shared by employees that defines the ways in which they interact with each other and with other stakeholders. The knowledge management was defined as a range of strategies and practices used in an organization to identify, create, represent, distribute, and enable the adoption of knowledge. Finally, a definition need to be provided for both the regular and a nonregular implementation of TEL tools mentioned in the introduction and in the hypotheses. Since literature does not provide an explicit range of chosen sets of tools, we have suggested a border in the light of the frequency analysis described in the results section and the common sense at 5 uses of TEL tools per week. That point was chosen as a border in the light of the analysis of six user groups and on the assumption that a significant usage should in average considered to be at least once per day, i.e. at least five times per week. Also, it is in accordance with our sample median of 6, and therefore such division gives us roughly the same group size, needed for a further statistical analysis. The original survey with explanations in electronic form is available at http://www.surveymonkey.com/s/JBC969J. First, the chosen variables were
ComSIS Vol. 9, No. 1, January 2012
287
Mladen Čudanov, Gheorghe Savoiu, and Ondrej Jaško
analyzed using the descriptive statistics, and the frequency analysis. The gathered data did not yield any conclusive directions towards the model as in the case of using a linear or other regressions with several experimented models, and the results suggest that the included factors do a good job in explaining part of the dependent variable variance, but that more factors should be incorporated in the model. This will be one of the main guidelines in our future research. To further examine our hypothesis a t-test has been used to determine a statistically significant difference since this is the method recommended in the cases when samples are relatively small [9] as stated by Krishnawamy et al, p352.
3.
Results
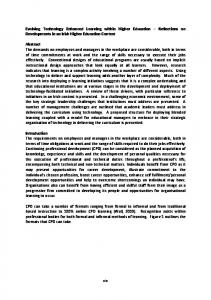
Regarding the use of the selected TEL tools, the respondents offered 94 valid responses, the resultant mean of which was 22.77 and the median was 6 uses per week, with the standard deviation of 36.27. The descriptive statistics is presented in Table 1, and bar chart of average uses per week on the x-axis with the percentage of users on the y-axis is presented in the following figure. Table 1. How often do respondents use Web 2.0 features weekly N
Minimum Maximum
94
.00
150.00
Mean
Std. Deviation
22.7713 36.26935
Fig. 1. Bar chart for the frequency of use per week by the percentage of users
When we analyze influence on the structure, the culture and the knowledge management in the organization, results differ. On a 1 to 10 scale, where 1 means the least influence, and 10 means the most influence, the average for the entire sample was 3.87, with a standard deviation of 2.42. This is quite a low value, and can be explained as the perception of the interviewed employees in technologically advanced industries that mentioned concepts
288
ComSIS Vol. 9, No. 1, January 2012
Usage of Technology Enhanced Learning Tools and Organizational Change Perception
have a below-moderate influence upon the organizational structure. Electronic ties of all sorts, including collaborative networks are found to be loosening the constraints of the organizational structure [10]. The influence of computer networks on the organizational structure is already elaborated, and it is concluded that computer networks (including collaborative networks) enable the emergence of new organizational forms [11]. The perceptions of the employees about the influence of the mentioned concepts on culture are higher; the respondents offered an average grade of 4.67, with a standard deviation of 2.56. This could be interpreted as the perception that the mentioned Web 2.0 concepts have a moderate influence on the organizational culture. Major influence, as was expected, was perceived to be that on the knowledge management, where the average grade is 5.52, with a standard deviation of 2.75. The processed data are presented in Table 2. Table 2. Perception of partial influences descriptive statistics
Valid
100
99
Perceived influence on knowledge management 100
Missing
Perceived influence on structure N
Perceived influence on culture
0
1
0
Mean
3.87
4.67
5.52
Median
3.00
4.00
5.50
Std. Deviation
2.423
2.556
2.747
If we want to differentiate the results on the use of the mentioned TEL tools in detail, we can select six logically grouped clusters that are similar in size, and given in the following table with selected comments specific to the respective groups. If we analyze the perception of the influence on those groups, we will find that there is some correlation between the usage and the perception of influence on structure, culture and knowledge management. The overall perception of influence on structure also grows as usage grows, with the exception of the sixth group. The culture shows mixed results, while the influence of knowledge management suggests a strong growing trend, with the exception of the third group. The disruption of steady growth that is especially evident in the case of the perceived influence upon the culture could have a twofold explanation. It might indicate that employees perceive changes in the organizational culture differently from the changes the structure and knowledge in the context of an increased Web 2.0 usage, or it might be the consequence of other, non-measured features in this specific sample. In order to recheck the actual reason a new study can be conducted, focused on organizational culture, and possibly on a larger sample. The overall results presented in the "Perceived total influence" column of table 4 are the sum of the perceived influences for the culture, the structure and knowledge management (in each of the six groups). Such transformation of several Likert-based scales by the summation displays an acceptable internal
ComSIS Vol. 9, No. 1, January 2012
289
Mladen Čudanov, Gheorghe Savoiu, and Ondrej Jaško
consistency according to George and Mallery [12] with Cronbach's Alpha value of .785. The goal was to present one aggregate measurement indicating the overall changes in organization. The results are presented in the table 4. Table 3. Qualitative description of user groups Weekly use (user groups)
Group
Example comments on usage
(0-2] (1)
Nonusers
(2-4] (2)
Occasional users
(4-10] (3)
Moderate users
(10-16] (4)
Regular users
(16-60] (5)
Frequent users
(60- ) (6)
Intense users
"I prefer other sources" "I use only basic corporate intranet" "I use it when I have a problem" " I consult other people about their experience in working with some equipment and I use the information I get in sales" "More often when I have a problem" "At least once a day" "Every time I have a problem, and for contacts" "I have to search for a solution on corporate blogs because of the lack of knowledge among colleagues in my organization" "A few times a day for information purposes" "…we have in-house wiki knowledge base, when I have problem, I visit forums..." "I follow many blogs, I don't visit them only when I have a problem" "I use the wiki, forums and social networks to look for some answers, and to keep informed about business, etc." "More than 15 times a day I look f wiki, forums, keep informed about business over social networks"
Table 4. Analysis of perceived influence in six groups of users Weekly No. of usage (user surveyed groups) users (0-2] (1) (2-4] (2) (4-10] (3) (10-16] (4) (16-60] (5) (60- ) (6)
16 21 16 14 14 13
Perceived influence on structure
Perceived influence on culture
3.19 3.33 3.88 4.50 4.93 4.54
3.56 5.30 3.31 4.86 6.07 4.92
Perceived influence on knowledge management 4.19 5.57 4.69 6.14 6.43 7.00
Perceived total influence 10.94 14.20 11.88 15.50 17.43 16.46
A further analysis is aimed to be conducted on two groups, since the presented six groups are not a sufficient sample for significant statistical results to be obtained. In the light of the previous analysis, the dividing point
290
ComSIS Vol. 9, No. 1, January 2012
Usage of Technology Enhanced Learning Tools and Organizational Change Perception
was chosen to be at 5 uses of TEL tools per week. The first group covers the respondents who use the TEL tools less than five times per week (the group with a lower usage frequency), while the second covers the employees that use those concepts five or more times per week (the group with a higher usage frequency). The conclusions are similar to those of the previous analysis. The first group has lower mean levels as to the influence on the structure, the culture and the knowledge management. The difference between the mean values for the perceived influence in all three groups can be observed in the following two tables.
Group 2 (five or more uses per week)
Group1 (less than five uses per week)
Table 5. Mean and median analysis on segment with lower usage of TEL tools
39
Perceived influence on knowledge management 40
0
1
0
0
Mean
3.20
4.36
4.88
2.01
Median
3.00
4.00
5.00
2.50
Std. Deviation
2.09
2.66
2.89
1.18
Valid
54
54
54
54
Missing
0
0
0
0
Mean
4.56
4.87
6.13
38.15
Median
4.00
4.50
7.00
17.50
Std. Deviation
2.55
2.53
2.59
41.73
Valid N
N
Missing
Perceived influence on structure 40
Perceived influence on culture
Frequency of weekly usage 40
Table 5 gives us an insight into the perception that employees who use TEL tools less than five times per day have about the influence of those tools on the organizational structure, culture and knowledge management. We can see that the mean of the perceived influence on the structure is rather low, 3.20 out of 10. The perception of influence on culture the employees report is somewhat increased, and in case of the wikis, blogs, forums and social networks the mean of the influence amounts to 4.36 out of 10. Knowledge management is perceived as most connected, and the mean of the influence in this group is 4.88. The median values follow a similar trend, and the standard deviation is rather low. The employees in this group use the mentioned tools 2.01 times per week on average, and the standard deviation of that usage is again relatively low for this group. If we compare these results with the group 2 we can see that there is almost a linear increase in the perceived influence on all three variables, and still the order of the perceived influence is the same, however, this time the values are 4.56 out of 10 for the structure, 4.87 out of 10 for the culture, and 6.13 for the knowledge management. The average frequency of usage is much higher, it amounts to 38.15 times per week, while the standard deviation is relatively higher in
ComSIS Vol. 9, No. 1, January 2012
291
Mladen Čudanov, Gheorghe Savoiu, and Ondrej Jaško
comparison with the first group. In the light of these findings we have performed a t-test to see if differences between those two groups, the one with the average usage frequency of the TEL tools like wikis, blogs, forums and social networks below five times per week, and the other, with more than five uses per week show any statistical significance. The following table presents the results for the structure, the culture and the knowledge management practices, respectively. Table 6. T-test for perceived influence on organizational structure, culture and knowledge management
Perceived influence on structure Perceived influence on culture Perceived influence on knowledge management
Std. Error Difference
Mean Difference
Sig. (2tailed)
t
df
t-test for Equality of Means
Sig.
F
T-test for perceived influence on structure, culture and knowledge management with 5 as the cutting point
Levene's Test for Equality of Variances
95% Confidence Interval of the Difference Lower
Upper
3.178 .078 2.744 92
.007
1.356 .494 .375
2.337
.583
.447 .942
91
.349
.511
1.590
.971
.327 2.211 92
.029
1.255 .567 .128
.543 -.567
2.381
Table 7. T-test for perceived influence on culture with 10 as the cutting point
Perceived influence on culture
292
.038 .847 2.154 91
.034
Std. Error Difference
Mean Difference
Sig. (2tailed)
df
t-test for Equality of Means
t
Sig.
F
T-test for perceived influence on culture with 10 as the cutting point
Levene's Test for Equality of Variances
95% Confidence Interval of the Difference Lower Upper
1.139 .529 .089
2.189
ComSIS Vol. 9, No. 1, January 2012
Usage of Technology Enhanced Learning Tools and Organizational Change Perception
In the table 7 results are presented for the culture, separately analyzed with the cutting point of ten uses per week, in order to propose explanations for non-significant differences presented in the previous table. Descriptive statistics show that group with ten or more uses per week (41 respondent) have mean of variable perceived influence on culture of 5.29 and standard deviation of 2.571, while the group with less than ten TEL tools uses per week (52 respondents) has mean 4.15 and standard deviation of 2.5 for the same variable.
4.
Discussion
The results presented in the above tables describe the employees’ perceptions but we also presume that the described results are rather accurate in the description of the real influence, on the ground of the assumption that the employee perception is often the best way to measure the less tangible organizational phenomena. In performing their daily tasks the employees get a direct insight into the organization, with estimations that are often correct. Even if not so, the employee perception can materialize as "selffulfilling" prophecy as explained by Merton [13] and if some trend is perceived as not to have any influence on their organization, it most probably is so. Also, Wanous et al. [14] maintain that a cynical and negative perception of organizational change by employees contributes to its failure, so if employees think that those tools are insignificant and have no influence, it will probably prove to be so in the organizational changes in reality. This paper is however concerned with three hypotheses presented in first part of the paper, connected to the results given in Table 5 as descriptive guidelines, and also to the results in Table 6 for the statistical significance of the mean difference for groups with a lower and a higher usage of the TEL tools. As described in the methods section, the t-test was used for statistical analysis. The results are relevant in verifying Hypothesis 1 (related to the structure) and Hypothesis 3 (the knowledge management), but do not support Hypothesis 2. This is all on the basis of our definition of the regular and the non-regular usages. A further discussion on results is presented in the joint description of the results, the theoretical review of the organizational impact in general and then in the review of the three parts together.
4.1.
Description of results
If we interpret Levene's test for equality of variances, we can confirm the assumption that two groups in Table 6 have equal variances in all three cases and therefore follow and present the related results. The T statistics in the case of the perceived influence on the structure has the value of 2.744, with 92 degrees of freedom and two tailed significance of 0.007. Therefore we can conclude (p