Use of an objective indicator species selection method shows decline in bird populations in Danish habitats Anne Eskildsen, Jørn Dyhrberg Larsen & Henning Heldbjerg (Med et dansk resumé: Anvendelse af en objektiv metode til udvælgelse af indikatorarter viser tilbagegange i fuglebestande i danske naturtyper)
Abstract This study addresses the development of a new set of indicators of bird populations using Relative Habitat Use (RHU), an objective method for indicator species selection. RHU facilitates the calculation of indicators for all nine basic habitat types included in the Danish Common Bird Census as well as three combined habitat types. RHU-based indicators avoid the potential bias from existing indicator selection methods using subjective selection criteria and are therefore considered as more reliable indicators of ecosystem status. Calculation of a multi-species indicator for each habitat facilitated the classification of an overall temporal trend for each habitat between 1976 and 2010. A comparison of population trends for species with strong habitat associations (‘high use species’) and more general habitat distributions (‘intermediate use species’) was performed to determine if these two different groups showed different trends. High-use indicators showed significant declines in bird populations in five out of nine habitats (coniferous, arable, lake, heath and dunes/shore), indicating an ongoing decline in the quality of these habitats. The intermediate use indicator was found to be heavily affected by a proximity effect between habitats and did not prove to be a reliable indicator of ecosystem status. The high use indicators for urban, farmland, freshwater and forest habitats covered 75% of all species included in the Common Birds Census, and with only a minimal species overlap. We conclude that the high use indicator is a useful tool for habitat monitoring and we suggest this set of indicators is used for monitoring the terrestrial and limnic environment in Denmark and abroad.
Dansk Orn. Foren. Tidsskr. 107 (2013): 191-207
192 Bird populations in Danish habitats
Introduction Following the failed attempt to halt the loss of biodiversity across Europe by 2010, the European Community has now committed itself to new goals aiming to “halt biodiversity loss and degradation of ecosystem services and restoring them in so far as feasible by 2020” (EC 2010). Reliable indicators of biodiversity are therefore much needed in order to evaluate the progress towards achieving these goals. Birds may be used as indicators of ecosystem status on a general scale as well as in specific habitat types as there is often a close correlation between bird diversity and overall biodiversity (Kati et al. 2004, Sauberer et al. 2004, Gregory & van Strien 2010). However, solid links between the two have not been documented everywhere (Lund & Rahbek 2002, Kati et al. 2004, Pearman & Weber 2007) and care should be taken before drawing direct conclusions on overall biodiversity solely from bird studies. The common bird indicator presented here is one of a range of indicators used in conjunction to monitor the overall Danish biodiversity by the Nature Agency under the Danish Ministry of Environment. Currently, species inclusion in the common bird indicators for forest and farmland habitat is based on lists compiled by experts (EBCC 2012). The development of new, objective species selection criteria which may avoid potential bias due to subjectivity and varying habitat preferences for any particular species across the European region is ongoing (Gregory & van Strien 2010, Larsen et al. 2011). The aim of this study is to evaluate trends in Danish bird population indicators after improvement by a new method using an objective species selection criterion, which we have previously described (Lar sen et al. 2011). The original common bird indicators used in Denmark consider only forest and farmland habitats; however, our new indicator species selection method facilitates the calculation of indicators for all nine basic habitat types included in the Danish Common Bird Census programme. Additionally, to aid management purposes, we have included three combined habitats, namely forest (coniferous and deciduous forest), farmland (arable land and meadows) and freshwater (bogs, marshes and lakes). Specialist species with strong affiliations for certain habitat types are often susceptible to habitat change and disturbance and are therefore vulnerable to the effects of e.g. habitat degradation and reduction, land-use alteration and climate change (Jiguet et al. 2007). On the other hand, opportunistic generalist species may sometimes benefit from such disturbances due to their ability to take advantage
of new niches, which have arisen suddenly (Clavel et al. 2010). In this study we wish to investigate whether population trends for species with strong habitat associations, i.e. presumed specialists, differ from species with more general habitat distributions, and how these two different groups perform as indicators of ecosystem status. To this end we operate with two mutually exclusive indicator types for each habitat: A ‘high use’ indicator comprised of species with strong affiliation for that habitat type, and an ‘intermediate use’ indicator comprised of species with a looser affiliation for that habitat.
Materials and methods Data The Danish bird population indicators presented in this study are based on data collected between 1976 and 2010 by the Danish Common Bird Census (CBC), using the point count method (Heldbjerg 2005). In the Danish CBC, all birds seen or heard are recorded independently of their behavior, and indices and trends are computed for the 102 most common breeding bird species. Mallard Anas platyrhynchos and Pheasant Phasianus colchicus were omitted from this analysis because the Danish population is heavily influenced by rearing (Noer et al. 2009). The habitat around each census point is ascribed in quarters to one of nine habitat categories: coniferous forest, deciduous forest, arable land, bog/marsh, heath, dunes/shore, urban, lake and meadow, i.e. the habitat classification at each point can consist of one to four different habitat categories (Tab. 1).
Indicator species Species for each habitat indicator were selected from the species which are monitored in the CBC (Heldbjerg & Lerche-Jørgensen 2012), and were selected objectively according to their Relative Habitat Use (RHU, mean 1986-2009). The species selection method is described in detail in Larsen et al. (2011). The RHU is the abundance of a species in a particular habitat relative to the mean abundance of the same species in all other habitats. For each year and habitat the number of individuals of each species at all census points with the habitat in question was extracted. The number of individuals observed at a specific point was then weighted with the proportion of the given habitat at the point, e.g. if four Great Tits Parus major, two Blackbirds Turdus merula
Bird populations in Danish habitats 193 Tab. 1. The distribution of census points on habitats in the Danish Common Bird Census. Percentages are annual mean values for the period 1986-2010. Fordelingen af optællingspunkter på habitater, der indgår i det danske punkttællingsprogram. Procenter er årlige gennemsnit for perioden 1986-2010. Habitat
Definition
%
FOREST Skov Coniferous Nåleskov Deciduous Løvskov
37.5 Forest, plantation and clearings in forest of mainly spruce, fir, pine, larch, cedar, cypress and thuja Skove, plantager og lysninger i skov hovedsageligt bestående af fyr, gran, lærk, ceder, cypres og thuja
14.1
Forest and clearings in forest of mainly poplar, birch, hornbeam, hazel, beech, oak, elm, rowan, cherry, maple, horse chestnut, lime and ash Skove og lysninger i skov hovedsageligt bestående af poppel, birk, avnbøg, hassel, bøg, eg, elm, røn, kirsebær, løn, hestekastanje, lind og ask
23.5
FARMLAND Landbrugsland
38.8
Arable Agerland
Fields, fallow land, hedgerows, farms, orchards, marl pits, golf courses Marker, brakmarker, hegn, gårde, frugtplantager, mergelgrave, golfbaner
27.8
Meadow
Meadow, salt marsh, pasture, dry grassland and other grass-dominated areas with or without scattered trees and/or shrubs. Eng, strandeng, vedvarende græsningsarealer, overdrev og andre græs dominerede arealer med eller uden spredt bevoksning af træer og buske
11.1
Eng FRESHWATER Vådområder Bog/marsh
10.5 Bogs, fens, reed beds, ponds < 1 ha, areas with moist, often water-covered floor with herbs and/or trees such as willow, alder and birch Moser, højmoser, kær, rørskov, søer < 1 ha, tidvist vanddækkede områder med urtevækst og/eller træer som pil, el og birk
7.2
Any open, permanent freshwater surface of more than 1 ha Alle åbne, permanente ferskvandsområder med en overflade på mere end 1 ha
3.2
Towns, gardens, summerhouse areas, villages, ports, industrial zones, parks, ramparts, cemeteries and railroad areas Byer, haver, sommerhusområder, landsbyer, havne, industriområder, parker, volde, kirkegårde og jernbaneområder
9.8
Heath Hede
Heaths primarily dominated by heather and with a dry floor Heder primært domineret af lyng og med tør bund
1.4
Dunes/shore Klit/strand
Dunes, inland dunes, beaches, inshore areas and tidal areas Klitter, indlandsklitter, strande, kyst og vadeflader
2.0
Mose/kær Lake Sø OTHER HABITATS Andre habitater Urban By
and one Wren Troglodytes troglodytes were observed at a point with the habitat distribution ¾ deciduous forest and ¼ urban the number of individuals in each habitat would be for deciduous forest: Great Tit 3, Blackbird 1.5, Wren 0.75 and for urban: Great Tit 1, Blackbird 0.5, Wren 0.25. The sum of the weighted number of individuals of each species in a particular habitat could then be used to calculate a RHU value from the following equation:
ni
Relative Habitat Use =
/ Pi
( N – ni )
/( P – p ) i
where ni is the number of individuals in the ith habitat, pi is the total number of i-habitat points, adjusted according to proportional habitat share at each point, N is the total number of individuals and P is the total number of points.
194 Bird populations in Danish habitats
For species with an RHU greater than two in a particular habitat (‘high use’ species), the mean abundance of the species in that habitat is at least twice the mean abundance in all other habitats. Species with RHU values ranging between one and two in a particular habitat (‘intermediate use’ species) have a less strong affiliation with the habitat, while species with RHU values below 1 in a particular habitat (‘lowuse’ species) tend to avoid that habitat. RHU values were calculated for each species in each of the nine basic habitats and in the three combined habitat categories.
Indicator calculation and trend analysis For each species, a population index was calculated for each year within the period 1976-2010, using the ‘Time Effects’ model in the software TRends and Indices for Monitoring data (TRIM) (Pannekoek & van Strien 2001). Because species have been added to the CBC during the course of the project, year 2000 (since when no new species have been added to the dataset, see Appendix 1) was chosen as the base year (index 100) to avoid bias in the multi-species indices. Subsequently, individual species indices were combined into a single indicator value for each habitat each year. These multi-species indicators were calculated as the geometric mean of the individual species indices for each year (Buckland et al. 2005, Gregory et al. 2005). Two indicators were produced for each habitat: one for high use species with an RHU > 2 and one for intermediate use species with an RHU between 1 and 2. Low-use species with an RHU < 1 were omitted from the analyses. RHU-based habitat indicators may be calculated using data from all census points (i.e. habitat specificity is achieved by selection of species), or using only data from points where the habitat is present (i.e. habitat specificity is achieved by selection of species and census points). The most precise indicators are achieved by only using data from habitat specific points, weighted as described above (Lar sen et al. 2011); however, to be able to use the full dataset including the period 1976-1985 where the habitat classification method was different, we used data from all points in this study. To validate this approach we calculated ‘high use’ indicator trends for the period 1986-2009 with and without habitat specific point selection and compared the results. The software package TrendSpotter (Soldaat et al. 2007) was used to estimate a smoothed trend line and confidence intervals for each indicator. Furthermore, TrendSpotter was used to classify an over-
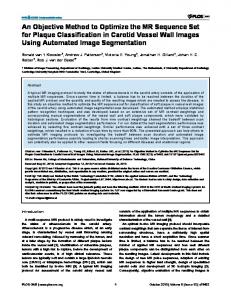
Fig. 1. Classification of population trends based on 95% confidence intervals of the average Yearly Change Rates (YCR) following Soldaat et al. (2007). Dots represent YCR values, horizontal lines their 95% confidence limits (figure after Laursen et al. 2010). Den anvendte klassifikation af de beregnede ændringer i fuglebestandene efter Soldaat et al. (2007). Prikkerne repræsenterer de gennemsnitlige årlige ændringsrater, og de vandrette linjer angiver deres 95 % konfidensintervaller. Kategorierne er: kraftig frem- eller tilbagegang, moderat frem- eller tilbagegang, stabil, ukendt/fluktuerende (figur efter Laursen et al. 2010).
all trend for each indicator. These so-called ‘flexible trends’ are particularly suitable for time series data with different periods of increasing, stable or declining trends and are presented as a Total Change Rate (TCR), i.e. the relative change in smoothed population number between e.g. 1976 and 2010, an average Yearly Change Rate (YCR) for the same period, and a trend classification. These classifications are placed in categories, e.g. ‘substantial decline’, and are therefore put in quotes when given within the text. Trends are classified as ‘substantial’ if the average yearly change with 95% certainty is larger than 5% (i.e. YCR < 0.95 or > 1.05). YCR values that with 95% certainty are different from 1, but do not fulfil the requirements for ‘substantial’ are classified as ‘moderate’ (Fig. 1). Therefore, ‘substantial’ and ‘moderate’ population changes indicate statistically significant deviations compared with the starting year, while ‘stable’ or ‘poorly known/fluctuating’ trends indicate no significant population change compared with the starting year (Soldaat et al. 2007, Gregory & van Strien 2010). Following Soldaat et al. (2007) trends were calculated for the full period (1976-2010) as well as for shorter periods with the end year 2010.
Bird populations in Danish habitats 195 Tab. 2. Indicator trends for high use (Relative Habitat Use; RHU > 2) and intermediate use (1 < RHU < 2) indicators for the three combined habitat categories (forest, farmland and freshwater) and for the nine basic habitats. Trends are categorized as either increasing or declining (substantial or moderate) or stable by the software TrendSpotter (Soldaat et al. 2007). Total Change Rate is the percent change in the index value of the modeled curve from 1976 to 2010. Increases or declines that are categorized as ‘moderate’ are statistically significant (p < 0.05). Udviklingstendenser for ’high use’ (RHU > 2) og ’intermediate use’ (1 < RHU < 2) indikatorerne for de tre kombinerede habitatkategorier (skov, landbrugsland og vådområder) og de ni enkelthabitater. Tendenser er klassificeret som enten fremgang (increase), tilbagegang (decline) eller stabil (stable) af softwareprogrammet TrendSpotter (Soldaat et al. 2007). Den samlede bestandsændring er den procentuelle ændring i indeksværdien for den modellerede kurve fra 1976 til 2010. Tendenser, der er klassificeret som ’moderate’, er statistisk signifikante (p < 0,05). Indicator
No. species
Trend
Indikator
Antal arter
Udviklingstendens
Forest Skov high use
Total Change No. species Rate (%) sign. increasing Samlet Antal arter bestandsmed ændring (%) signifikant fremgang
No. species sign. declining Antal arter med signifikant tilbagegang
No. species non sign. trends Antal arter uden signifikant tendens
29
Stable
-2.2
9
11
9
13
Moderate decline
-21.9
6
6
1
high use
15
Moderate decline
-29.0
1
9
5
intermediate use
16
Stable
1.6
9
6
1
high use
21
Moderate increase
12.7
9
5
7
intermediate use
17
Moderate decline
-21.8
6
9
2
high use
18
Moderate decline
-45.4
3
11
4
intermediate use
29
Stable
-0.8
13
13
3
intermediate use Coniferous Nåleskov
Deciduous Løvskov
Farmland Landbrugsland
Arable Agerland high use
7
Moderate decline
-53.9
0
5
2
30
Moderate decline
-12.2
14
13
3
high use
25
Stable
-10.5
6
13
6
intermediate use
30
Moderate decline
-25.0
10
15
5
high use
21
Stable
intermediate use
22
Moderate decline
high use
18
Stable
intermediate use
21
Moderate decline
high use
22
Moderate decline
intermediate use
25
Moderate increase
high use
12
Stable
intermediate use
16
Moderate decline
high use
14
Moderate decline
intermediate use
15
Moderate decline
high use
25
intermediate use
15
intermediate use Meadow Eng
Freshwater Vådområder 2.1
6
9
6
-36.2
5
15
2
-9.0
4
9
5
-17.3
6
12
3
-26.0
6
10
6
17.8
8
11
6
0.6
5
4
3
-9.0
6
7
3
-49.5
0
12
2
-18.5
4
9
2
Moderate decline
-19.0
8
11
6
Moderate decline
-36.3
3
7
5
Bog/marsh Mose/kær
Lake Sø
Urban By
Heath Hede
Dunes/shore Klit/strand
196 Bird populations in Danish habitats
Results Relative Habitat Use (RHU) represents a new objective method for indicator species selection. RHU values and the ‘high use’ and ‘intermediate use’ habitat indicator species sets resulting from the RHU calculation are listed in Appendix 1. The high use indicators for Urban, Farmland, Freshwater and Forest covered 75% of all species included in the Common Birds Census, and with only a minimal species overlap (Marsh Harrier Circus aeruginosus and Marsh Warbler Acrocephalus palustris in Freshwater and Farmland, and Long-tailed Tit Aegithalus caudatus in Forest and Freshwater). The CBC species, which did not contribute to the indicators by this method were mainly habitat generalists (15 species) or species with a high use in dunes/shore habitat, especially marine species (10 species). The intermediate use indicators were found to be heavily affected by proximity effects between habitats (see discussion of ‘proximity effect’ below). The results of this study confirmed the decline in Danish bird populations, with all nine habitat types showing significant overall declines for either high use species, intermediate use species, or both. Tab. 2 shows Total Change Rates and trend classifications for indicators in the three combined habitat types and each of the nine basic habitat types based on the smoothed trend lines for 1976-2010. Figs. 2-5 show the smoothed trends for high use and intermediate use indicators in the three combined habitat types and each of the nine basic habitats arranged according to their general habitat type (Fig. 2 Forest, Fig. 3 Farmland, Fig. 4 Freshwater and Fig. 5 ‘Other’ habitats). In the nine basic habitat types, a ‘moderate decline’ since 1976 was found for five high use indicators (Coniferous, Arable, Lake, Heath and Dunes/ shore) and seven intermediate use indicators (Deciduous, Arable, Meadow, Bog/marsh, Urban, Heath and Dunes/shore). ‘Moderate increase’ was found for one high use indicator (Deciduous) and one intermediate use indicator (Lake). Stable trends were found for three high use indicators (Meadow, Bog/ marsh and Urban) and for one intermediate use indicator (Coniferous). In the three combined habitats ‘moderate decline’ was found for one high use indicator (Farmland) and two intermediate use indicators (Forest and Freshwater), while ‘stable’ was found for two high use indicators (Forest and Freshwater) and one intermediate use indicator (Farmland). Tab. 3 shows the trends for each indicator using different starting years but always with the end year 2010. It is clear from this table that although the
high use Deciduous indicator shows a moderate increase for the period 1976-2010, the current trend is negative (‘moderate decline’) if any year within the period 1986-2004 is taken as the starting year (cf. Fig. 2). Also for the Meadow, Bog/marsh and Urban high use indicators the current trend is negative if compared with starting years within the periods 1980-1998, 1978-1998 and 1982-2003, respectively. By contrast, the current trend of the Dunes/shore high use indicator is positive (‘moderate increase’) if compared with the period 1983-1985. Tab. 4 indicates a high degree of consistency between the trends calculated using habitat specific point selection and using all census points for the same time period (1986-2009). Furthermore, it appears that none of the indicators show an increase for this period.
Discussion In Denmark, continued alteration and reduction of natural habitats has been reflected by declines in bird populations (Heldbjerg & Lerche-Jørgensen 2012) as well as other taxonomic groups (Meltofte 2010, Ejrnæs et al. 2011). Results of our study confirmed this trend with all nine habitat types showing declining trends for either the high use indicator, the intermediate use indicator, or both. Working with multi-species indicators makes it possible to show major changes in habitat quality for management purposes rather than just population trends in particular species. Still, when using multi-species indicators to draw conclusions about overall trends in habitats, one should be careful to examine the individual impact of each species on the final indicator by also considering each species’ population trend and habitat affiliations. In Larsen et al. (2011) data for indicator trend calculation were only drawn from points where the relevant habitat was represented (habitat specific indicators). Habitat specific indicators have the advantage that they are more directly related to the quality of habitats and are less affected by the quantity of the habitat in question, but this may be at the cost of accuracy as sample sizes are significantly reduced. For the present analysis we wished to utilize the full potential of the CBC dataset and therefore decided to use data points from all habitats and years. However, this method holds a potential risk of bias because trends in specific habitats can be ‘drowned’ by trends in other habitats where the species also occurs. The problem may be of special concern for small or poorly covered habitats, e.g. heath
Bird populations in Danish habitats 197 Fig. 2. Smoothed indicator trends (solid lines) for Forest (combined) and for the two underlying habitats (Coniferous and Deciduous) calculated from geometric mean multi-species indices from each year (dots) using TrendSpotter software (Soldaat et al. 2007). Dashed lines show 95% confidence interval for the model. Red symbols are used for high use species and blue symbols are used for intermediate use species. The base year (index 100) is set to 2000. Note that the y-axis is on log scale. Den modellerede udvikling i indikatorerne for Skov (kombineret) og for de to enkelthabitater Nåleskov og Løvskov, beregnet vha. TrendSpotter software (Soldaat et al. 2007). Stiplede linjer angiver 95 % konfidensgrænser for de modellerede værdier. Indeks for hvert år (prikker) er beregnet som geometriske gennemsnit af bestandsindeks for de arter, der indgår i den pågældende indikator (se Appendix 1). Rød farve er brugt til at angive ’high use’ og blå farve til at angive ’intermediate use’ arter. Basisåret (indeks 100) er sat til år 2000 for at undgå fejlkilder pga. arter, der er føjet til punkttællingsprogrammet i løbet af perioden. Bemærk at y-aksen er logaritmisk.
and dunes/shore, which suffer from small sample sizes and are therefore affected more strongly by the trends in more predominant habitat types such as arable or deciduous. In order to verify that the resulting indicators were still valid for the assessment of habitat specific trends we compared ‘high use’ indicator trends calculated with or without habitat specific point selection for the period 1986-2009 (Tab. 4). The comparison showed that for 11 out of 12 habitats, trend classifications were the same for the two indicator
types. In Deciduous, trend classifications were different but the Total Change Rates were very similar. Overall, the performed comparison demonstrates that the trends which emerge with or without habitat specific point selection in the present case are highly similar. This suggests that habitat specific point selection is not imperative when indicators are based on ‘high use’ species, allowing an increase of sample size and – in the case of the Danish CBC – giving the added advantage of an extra 10 years of data (1976-86). Due to the heterogeneity of the Danish landscape, census points used in the analysis may often consist of several different habitat types. This means that at any given point, species from several different habitat types are registered, e.g. meadow birds, forest birds and birds of arable land. Furthermore, birds may sometimes be found in habitat types with which they are not associated, e.g. seabirds seen in shore habitats, aquatic birds seen in meadows etc. This ‘proximity effect’ is especially an issue for species linked to habitats, which often constitute smaller patches abutting more predominant habitat types, e.g. heath, bog/marsh, lake and dunes/ shore. The occurrence of such a proximity effect in our indicators suggests the possibility that the trend found for one habitat may sometimes be either softened or exacerbated by trends in other habitats. In the following, the composition of each indicator will be discussed in detail, including the impact of individual species on the overall trend of each indicator. Habitat classification of sampling points in the Danish CBC is performed by the individual observer
A B A B A B
A B A B A B
A B A B A B
A B A B A B
Forest Skov Coniferous Nåleskov Deciduous Løvskov
Farmland Landbrugsland Arable Agerland Meadow Eng
Freshwater Vådområder Bog/Marsh Mose/Kær Lake Sø
Urban By Heath Hede Dunes/Shore Klit/Strand
1976
0 -1 -1 -1 -1 -1
0 -1 0 -1 -1 1
-1 0 -1 -1 0 -1
0 -1 -1 0 1 -1
1977
0 -1 -1 -1 -1 -1
0 -1 0 -1 -1 1
-1 0 -1 -1 0 -1
0 -1 -1 0 1 -1
1978
0 -1 -1 -1 -1 -1
0 -1 -1 -1 -1 1
-1 0 -1 -1 0 -1
0 -1 -1 0 1 -1
1979
0 -1 -1 -1 0 -1
0 -1 -1 -1 -1 1
-1 0 -1 -1 0 -1
0 -1 -1 0 0 -1
1980
0 -1 -1 -1 0 -1
0 -1 -1 -1 -1 1
-1 0 -1 -1 -1 -1
-1 0 -1 0 0 -1
1981
0 -1 -1 -1 0 -1
0 -1 -1 -1 -1 1
-1 0 -1 0 -1 0
-1 0 -1 0 0 -1
1982
-1 0 -1 -1 0 -1
0 -1 -1 -1 -1 1
-1 0 -1 0 -1 0
-1 0 -1 0 0 -1
1983
-1 0 -1 -1 1 -1
0 -1 -1 -1 0 0
-1 0 -1 0 -1 0
-1 0 -1 0 0 -1
1984 -1 0 -1 -1 1 -1
0 -1 -1 -1 0 0
-1 -1 -1 0 -1 0
-1 0 -1 0 0 -1
1985 -1 0 -1 -1 1 0
0 -1 -1 -1 0 0
-1 -1 -1 0 -1 0
-1 1 -1 0 0 -1
1986 -1 0 -1 -1 0 0
0 -1 -1 -1 0 0
-1 -1 -1 0 -1 0
-1 1 -1 0 -1 -1
1987 -1 -1 -1 -1 0 0
0 -1 -1 -1 0 -1
-1 -1 -1 0 -1 0
-1 1 -1 0 -1 -1
1988 -1 -1 -1 -1 0 -1
0 -1 -1 -1 0 -1
-1 -1 -1 0 -1 -1
-1 1 -1 0 -1 -1
1989 -1 -1 -1 -1 -1 -1
0 -1 -1 -1 0 -1
-1 -1 -1 -1 -1 -1
-1 0 -1 0 -1 -1
1990 -1 -1 -1 -1 -1 -1
0 -1 -1 -1 -1 -1
-1 -1 -1 -1 -1 -1
-1 0 -1 0 -1 -1
1991 -1 -1 -1 -1 0 -1
-1 -1 -1 -1 -1 -1
-1 -1 -1 -1 -1 -1
-1 0 -1 0 -1 -1
1992 -1 -1 -1 -1 0 -1
-1 -1 -1 -1 -1 -1
-1 -1 -1 -1 -1 -1
-1 0 -1 0 -1 -1
1993 -1 -1 -1 -1 0 -1
-1 -1 -1 -1 -1 -1
-1 -1 -1 -1 -1 -1
-1 0 -1 0 -1 -1
1994 -1 -1 -1 -1 0 -1
-1 -1 -1 -1 -1 -1
-1 -1 -1 -1 -1 -1
-1 -1 -1 0 -1 -1
1995 -1 -1 -1 -1 0 -1
-1 -1 -1 -1 -1 -1
-1 -1 -1 -1 -1 -1
-1 -1 -1 0 -1 -1
1996 -1 -1 -1 -1 0 -1
-1 -1 -1 -1 -1 -1
-1 -1 -1 -1 -1 -1
-1 -1 -1 0 -1 -1
1997 -1 -1 -1 -1 0 -1
0 -1 -1 -1 -1 -1
-1 -1 -1 -1 -1 -1
-1 -1 -1 0 -1 -1
1998 -1 -1 -1 -1 0 -1
0 -1 -1 -1 -1 0
-1 -1 -1 -1 -1 -1
-1 -1 -1 0 -1 -1
1999 -1 -1 -1 -1 0 -1
0 -1 0 -1 -1 0
-1 -1 -1 -1 0 -1
-1 -1 -1 0 -1 -1
2000 -1 -1 -1 -1 0 -1
0 -1 0 -1 -1 0
-1 -1 -1 -1 0 -1
-1 -1 -1 0 -1 -1
2001 -1 -1 -1 -1 0 -1
0 -1 0 -1 0 0
-1 -1 -1 -1 0 -1
-1 -1 -1 0 -1 -1
2002 -1 -1 -1 -1 0 -1
0 -1 0 -1 0 0
-1 -1 0 -1 0 -1
-1 0 -1 0 -1 -1
2003 -1 -1 -1 -1 0 -1
0 -1 0 -1 0 0
-1 -1 0 0 0 -1
-1 0 -1 0 -1 -1
2004 0 -1 0 -1 0 -1
0 -1 0 -1 0 0
0 -1 0 0 0 0
-1 0 -1 0 -1 -1
2005 0 -1 0 -1 0 0
0 -1 0 -1 0 0
0 -1 0 0 0 0
-1 0 -1 0 0 -1
2006 0 -1 0 -1 0 0
0 -1 0 -1 0 0
0 -1 0 0 0 0
-1 0 -1 0 0 -1
2007 0 0 0 -1 0 0
0 -1 0 -1 0 0
0 -1 0 0 0 0
0 0 -1 0 0 -1
2008 0 0 0 -1 0 0
0 -1 0 0 0 0
0 -1 0 0 0 0
0 0 -1 0 0 0
0 0 0 -1 0 0
0 -1 0 0 0 0
0 -1 0 0 0 0
0 0 -1 0 0 0
2009
Tab. 3. Trends for ‘high use’ indicators (A) and ‘intermediate use’ indicators (B) during any given time period with the end year 2010. Trends are indicated by figures and colors: 0 = ‘stable’ or ‘uncertain’, 1 = ‘moderate increase’ (blue) and -1 = ‘moderate decline’ (red). Udviklingstendenser for ’high use’ (A) og ’intermediate use’ indikatorerne (B) for alle perioder med slutåret 2010. Tendenser er anført som kategorier: 0 = ’stabil’ eller ’usikker’, 1 = ’moderat fremgang’ (blå) og -1 = ’moderat tilbagegang’ (rød). Fx viser ’high use’ indikatoren for løvskov en moderat fremgang for perioderne 1976-2010, 1977-2010 og 1978-2010, men en moderat tilbagegang, hvis basisåret for sammenligning med 2010 vælges inden for perioden 1986-2004.
198 Bird populations in Danish habitats
Bird populations in Danish habitats 199 Tab. 4. Comparison of indicator trends calculated using habitat-specific point selection and no point selection, respectively, for the period 1986-2009. Sammenligning af udviklingstendenser for perioden 1986-2009, beregnet henholdsvis med og uden habitatspecifik punktudvælgelse. Sammenligningen viser, at tendenserne beregnet ved de to metoder er meget ens. Habitat specific point selection Habitatspecifik punkt-udvælgelse Indicator Indikator
No point selection Ingen punkt-udvælgelse
Total change rate (%) Samlet bestandsændring (%)
Trend Udviklingstendens
Total change rate (%) Samlet bestandsændring (%)
Trend Udviklingstendens
Forest Skov
-14.5
Moderate decline
-16.7
Moderate decline
Coniferous Nåleskov
-42.6
Moderate decline
-32.1
Moderate decline
Deciduous Løvskov
-4.8
Stable
-6.8
Moderate decline
Farmland Landbrugsland
-29.9
Moderate decline
-19.4
Moderate decline
Arable Agerland
-20.9
Moderate decline
-23.2
Moderate decline
Meadow Eng
-12.0
Moderate decline
-14.8
Moderate decline
Stable
-5.8
Stable
Moderate decline
-15.9
Moderate decline
Freshwater Vådområder Bog/marsh Mose/kær Lake Sø
2.5 -14.5
Stable
-2.6
Stable
Urban By
-12.5
5.5
Moderate decline
-8.2
Moderate decline
Heath Hede Dunes/shore Klit/strand
-75.8 -0.4
Moderate decline Stable
-41.3 9.4
Moderate decline Stable
when a point count route is established. The observer is also responsible for updating point habitat information (Heldbjerg 2005). This poses two potential risks of bias: (1) The classification is done by the observer and is thereby subjective, and (2) the habitat classification is not updated when landscape changes occur. This may affect the calculation of Relative Habitat Use values and thus the allocation of species to indicators, but it is not possible at present to determine to what extent these factors affect the results of this study. Ideally all habitat classification would be centrally managed using GIS which could at the same time address the issue of updating habitat codes. For simplicity, participants in the point count census are not asked to record information about bird behaviour. Therefore, while our analysis provides new information about individual species’ use of certain habitats, it does not tell us what they are using them for. Consequently, identifying specific causes for increasing or declining trends of individual species, e.g. changes in foraging or breeding conditions, is beyond the scope of this study.
Forest Forest covers 13-14% of the total land area in Denmark. Of the total forest area deciduous forest and coniferous forest covers roughly the same propor-
tion. Seventy-five percent of the forest area is covered with even aged trees, mainly in plantations, which has a negative effect on the biodiversity in the forest (Nord-Larsen et al. 2012). The combined Forest indicator consists of species associated with deciduous and coniferous forest habitats. Results showed an overall ‘stable’ trend for the high use indicator for the period 1976-2010, due to opposing trends in Deciduous and Coniferous. However, a declining trend occurred in all forest habitats after the 1980s (Fig. 2, Tab. 3). The intermediate use indicator showed a ‘moderate decline’ between 1976-2010 due to a ‘moderate decline’ in Deciduous (Tab. 2), but trends were shifting during the period (Fig. 2, Tab. 3). Noticeably, most species, which had a high Relative Habitat Use in deciduous forest, had an intermediate Relative Habitat Use in coniferous forest, and vice versa, indicating that only few data points are placed in pure deciduous or coniferous habitats (proximity effect) and that few of our forest species are so specialized that they do not occur in both coniferous and deciduous forest. Coniferous: Nine out of 15 coniferous high use species showed declining trends (Tab. 2). The steepest declines were seen for Goshawk Accipiter gentilis, Green Woodpecker Picus viridis, Willow Warbler Phylloscopus trochilus, Crested Tit Lophophanes cristatus, and Common Crossbill Loxia curvirostra, pulling the overall trend in a negative direction over the
200 Bird populations in Danish habitats
Fig. 3. Smoothed indicator trends for Farmland (combined) and for the two underlying habitats (Arable land and Meadow). Red symbols are used for high use and blue symbols for intermediate use species. See Fig. 2 for further explanation. Den modellerede udvikling i indikatorerne for Landbrugsland (kombineret) og for de to enkelthabitater (Agerland og Eng). Rød farve angiver ’high use’ og blå farve ’intermediate use’ arter. Se Fig. 2 for yderligere forklaring.
Fig. 4. Smoothed indicator trends for Freshwater (combined) and for the two underlying habitats (Bog/marsh and Lake). Red symbols are used for high use and blue symbols for intermediate use species. See Fig. 2 for further explanation. Den modellerede udvikling i indikatorerne for Vådområder (kombineret) og for de to enkelthabitater (Mose/kær og Sø). Rød farve angiver ’high use’ og blå farve ’intermediate use’ arter. Se Fig. 2 for yderligere forklaring.
Bird populations in Danish habitats 201
Fig. 5. Smoothed indicator trends for the three habitats Urban, Heath and Dunes/shore. Red symbols are used for high use and blue symbols for intermediate use species. See Fig. 2 for further explanation. Den modellerede udvikling i indikatorerne for de tre habitater By, Hede og Klit/strand. Rød farve angiver ’high use’ og blå farve ’intermediate use’ arter. Se Fig. 2 for yderligere forklaring.
whole period (Fig. 2, Tabs. 2 and 3). Only Chaffinch Fringilla coelebs showed an increasing trend. In the intermediate use indicator for Coniferous, the number of species showing increasing and declining trends was more similar, resulting in a ‘stable’ trend (Fig. 2, Tab. 2). Coniferous forest is not a native Danish habitat type, and current management practices in coniferous plantations include intensive management and short turnover rates, creating unstable habitats of poor ecological value (Levin & Normander 2008, Nord-Larsen et al. 2009). Due to the national strategy for natural forests, replanting is now done with an increasing proportion of deciduous species as well as including more native species, which are more storm tolerant and better adapted to the Danish climate (Skov- og Naturstyrelsen 1994, Nord-Larsen et al. 2009, Orbicon & Epinion 2012). This has resulted in a declining area of coniferous forest in favour of deciduous species (Danmarks Statistik 2001). In addition, storm felling events like those in 1981, 1999 and 2005, which were followed by reforesting, could also be possible explanations for shifts in ecosystem structure. Because the indicators in Tab. 2 are based on data from all habitat points, the quantity of the coniferous habitat may also influence the resulting trends. However, Total Change Rate was more negative if only points within coniferous forest were considered (Tab. 4), indicating that a decline in quality of the coniferous habitat has probably been the main factor. This may be reflected in our study by the strong decline among coniferous specialists, many of which rely heavily on old-growth coniferous plantations with a high production of seeds and many nesting holes. In the coming decades, the replacement of coniferous plantations with deciduous forest is expected to continue and may cause a further decline for species, which are heavily reliant on coniferous habitats. Deciduous habitats showed different trends for the two indicator types, with a ‘moderate increase’ for the high use indicator and a ‘moderate decline’ for the intermediate use indicator (Tab. 2). This was however due to opposing trends in the beginning of the period, and after the mid-1980s the trends have been rather similar (Fig. 2, Tab. 3). Deciduous forests have been affected by management intensification, i.e. increased draining, removal of old trees and deadwood and replanting of clearings, resulting in high rates of biodiversity loss (Stoltze & Pihl 1998, Ejrnæs 2009). This development may explain the declining trend seen for the highuse indicator after 1990. Increasing species in the high use indica-
202 Bird populations in Danish habitats
tor included Stock Dove Columba oenas, Chiffchaff Phylloscopus collybita, Nuthatch Sitta europaea and Hawfinch Coccothraustes coccothraustes, while declining species were mainly trans-Saharan migrants such as Garden Warbler Sylvia borin, Wood Warbler Phylloscopus sibilatrix and Pied Flycatcher Ficedula hypoleuca. A strategy formulated by The Ministry of Environment in 1992 aiming to boost biodiversity by increasing the area of untouched and extensively managed forest to 40 000 ha, and by increasing the area of forest with biodiversity as its primary management purpose to 10% and the total forested area to 20-25% within the span of one tree generation (80-100 years) (Skov- og Naturstyrelsen 1994, 2002) is expected to have a beneficial effect on biodiversity and population trends for deciduous specialists in the future.
Farmland The combined Farmland indicator consists of arable habitat and meadows (including salt marshes). The combined indicator showed a ‘moderate decline’ for high use species (Tab. 2, Fig. 3), and a ‘stable’ trend for intermediate use species. The less negative trend seen for the intermediate use indicator in Farmland compared with Arable and Meadow was due to differences in species selection (Appendix 1). Arable: In arable habitats, five out of seven high use species showed declining trends between 1976 and 2010, resulting in an overall decline of 53.9% for the indicator (Fig. 3, Tab. 2). Declining species included Grey Partridge Perdix perdix, Lapwing Vanellus vanellus, Skylark Alauda arvensis and Barn Swallow Hirundo rustica, which are all characterized by a high preference for arable habitats. The intermediate use indicator showed an overall decline of 12.2% (Fig. 3, Tab. 2). The strongest declines were seen for Black-headed Gull Chroicocephalus ridibundus, Sand Martin Riparia riparia, Whinchat Saxicola rubetra, Wheatear Oenanthe oenanthe and Icterine Warbler Hippolais icterina, while the strongest increases were seen for Marsh Harrier, Pied Wagtail Motacilla alba, Raven Corvus corax and Goldfinch Carduelis carduelis. The negative population trends of species with both strong and intermediate affiliations for arable habitats provide evidence of ecological degradation of arable habitats. The strong agricultural intensification, which has taken place since the middle of the 20th century has reduced habitat suitability and the availability of food, leading to measurable deleterious effects on bird life (Donald et al. 2001,
Fox 2004, Fox & Heldbjerg 2008). This includes increased field sizes and mechanization, decreased variation in crop types, increased pesticide use and a decreased number of small biotopes. In the 1980s there was a shift from growing spring sown crops to autumn sown crops, mainly wheat and rape. A large part of the arable area (70% in 2010) is now covered by winter crops (Danmarks Statistik 2010), which has increased springtime vegetation height and thereby impaired breeding conditions for e.g. Lapwing and Skylark (Shrubb et al. 1991, Wilson et al. 1997). Furthermore, the European Commission’s decision to cancel the set-aside requirement resulted in a drop from 205000 ha of set-aside land in 2001 to only 6000 ha in 2009 (Danmarks Statistik 2003, 2009). Overall, our results suggest that the degradation of arable habitats contributes to population declines among arable specialists in particular. Meadow: The meadow indicator includes pastures, salt marshes and meadows and thus covers a diverse range of mainly grass-dominated habitats. Meadow habitats have undergone great changes over the past century, and the area is still declining from covering more than 12% of the Danish landscape in the mid-1970s to covering roughly 9% in 2005 (Levin & Normander 2008). This reduction has primarily been due to draining and conversion of meadow habitats into arable land. Furthermore, a decline in grazing practice among farmers combined with increased eutrophication has reduced the quality of meadow habitats (Meltofte 2010, Ejrnæs et al. 2011). In addition, the vast majority of areas categorized as meadow are grasslands that are allowed to be fertilized, and only around 0.5% of the Danish land area is natural meadow of value for biodiversity associated with this habitat (Ejrnæs et al. 2011). The high use indicator for Meadow showed an overall stable trend (Tab. 2), although with a significant decline since the late 1980s (Fig. 3, Tabs. 3 and 4). Among high use species, 13 out of 25 showed declines, including highly specialized meadow species such as Snipe Gallinago gallinago, Curlew Numenius arquata and Meadow Pipit Anthus pratensis as well as species which are also frequent in coastal habitats (dunes/shore), e.g. Redshank Tringa totanus and Yellow Wagtail Motacilla flava. The trend for intermediate use meadow species showed a ‘moderate decline’ of 25% between 1976 and 2010 (Fig. 3, Tab. 2), but the indicator value is doubtful as the intermediate use indicator includes high use species from all other habitat types.
Bird populations in Danish habitats 203
Freshwater The combined Freshwater indicator consists of bog, marsh and lake habitats. With a ‘stable’ trend of 2.1% Total Change Rate for the high use indicator and a ‘moderate decline’ of 36.2% for the intermediate use indicator trends for the Freshwater indicator were similar to those for Bog/Marsh but deviated from trends found for Lake (Tab. 2, Fig. 4). The number of declining species in the high use indicator was slightly higher than the number of species that increased. The ‘stable’ trend seen for this indicator may to a large extent be attributed to the very substantial increase of Great Cormorant Phalacrocorax carbo. Freshwater indicator species also generally had high Relative Habitat Use values in meadow and/or dunes/shore habitats. Since 1987 the Danish government has implemented a number of action plans for the aquatic environment, aiming to reduce agricultural impacts on the aquatic environment by reducing discharges of nitrogen compounds and phosphates (Regeringen 2004). By 2004 the discharge of both N and P had been halved (Børgesen et al. 2009), however, discharges are still considered too high to support a healthy aquatic environment (Bøgestrand 2003, Søndergaard et al. 2006). Recent studies show increased water quality in many streams, whereas most lakes only show minor improvements due to large internal loads of P (Søndergaard et al. 2006). Bog/marsh: In bog/marsh habitats, a majority of the 18 high use species showed declines, including many bog/marsh specialists such as Moorhen Gallinula chloropus, Thrush Nightingale Luscinia lus-
cinia, Grasshopper Warbler Locustella naevia, Reed Warbler Acrocephalus scirpaceus and Reed Bunting Emberiza schoeniclus (see Appendix 1). Although the overall trend for the period 1976-2010 was classified as ‘stable’, the trend up to 2010 was ‘moderate decline’ if any year within the period 1978-1998 was chosen as the base year for comparison (Tab. 3, Fig. 4). Major increases were seen for Red-necked Grebe Podiceps grisegena, Greylag Goose Anser anser and Marsh Harrier (Fig. 4, Tab. 2). Noticeably, declining species were associated with lakeshore habitat (e.g. Moorhen, Snipe and Grasshopper Warbler). A majority of the indicator species, mainly non-passerines, showed higher Relative Habitat Use values for lake than for bog/marsh. Twelve out of 21 intermediate use species showed declines, resulting in an overall ‘moderate decline’ for this indicator (Tab. 2). The species composition suggested a strong proximity effect, with the indicator representing high use species from each of the eight other basic habitat types, suggesting that the trend of this indicator may be confounded by trends in other habitats. However, the smoothed trend closely mimics that of the high use indicator (Fig. 4). Lake: Throughout the 20th century, numerous Danish lakes, streams and marshes have been drained, and the emission of nutrients from agriculture and urban wastewater has severely disturbed the ecological balance of many remaining lakes (Bøgestrand 2003, Søndergaard et al. 2006, Meltofte 2010). The degradation of freshwater habitats was reflected by a ‘moderate decline’ for the high use
204 Bird populations in Danish habitats
Lake indicator (Fig. 4, Tab. 2), albeit with some stabilization after 1985 (Tabs. 3 and 4). Declines were especially found for species associated with the water surface itself, e.g. Great Crested Grebe Podiceps cristatus, Shelduck Tadorna tadorna and Pochard Aythya ferina, but also a number of species associated with lakeshore habitat, e.g. Snipe and Sand Martin, declined. Increases were found for e.g. Red-necked Grebe, Great Cormorant and Greylag Goose. The intermediate use indicator showed a ‘moderate increase’ and consisted almost entirely of species more strongly associated with lakeshore habitats than with the water surface itself (e.g. Cuckoo Cuculus canorus, Meadow Pipit and Marsh Warbler (Fig. 4, Tab. 2).
Other habitats Urban areas are here defined as all settlements, including cities, villages and summerhouse areas. In the middle of the 20th century urban areas covered 8.1% of the Danish land area and increased to 9.7% at the beginning of the new century (Levin & Normander 2008). Birds in urban habitat showed a ‘stable’ trend for high use species and a ‘moderate decline’ for intermediate use species between 1976 and 2010, but the high use indicator also showed that a significant decline occurred since the early 1990s (Fig. 5, Tabs. 3 and 4). The strongest declines were seen for Black Redstart Phoenicurus ochruros and Lesser Whitethroat Sylvia curruca, while the strongest increases were seen for Greenfinch Chloris chloris and Tree Sparrow Passer montanus. Heath: A remarkable 12 out of 14 high use heath species showed declines, resulting in an overall ‘moderate decline’ of 49.5% for the indicator over the period 1976-2010 (Fig. 5, Tab. 2). The strongest declines were seen for Snipe, Whinchat, Wheatear, Willow Warbler and Red-backed Shrike Lanius collurio, but a majority of these species showed stronger preferences for meadow or dune/shore habitats, questioning the value of the Heath indicator. In the intermediate use indicator nine out of 15 species showed declines, resulting in an overall ‘moderate decline’ of 18.5% for this indicator (Fig. 5, Tab. 2). Strong declines were seen for Goshawk, Redshank, Green Woodpecker, Lesser Whitethroat and Yellowhammer Emberiza citrinella, while increases were seen for Grey Heron Ardea cinerea, Buzzard Buteo buteo, Herring Gull Larus argentatus and crow sp. Corvus corone/cornix. Among the species making up this indicator, only Buzzard (increasing) and Yellowhammer (decreasing) had higher Relative
Habitat Use rates in heath than in any other habitat. Heath is a habitat type, which has undergone great changes during the past century. In the late 19th century heath comprised roughly 12% of the total Danish landscape, but dropped drastically through the 20th century and settled at a stable level of 3% in the 1970s (Levin & Normander 2008). The historical reduction of heath habitat was primarily due to the conversion of heathland into forest or agriculture that began in the 1800s since when the heath’s importance for grazing has dropped. Today, remaining heath habitats are small in area and subject to overgrowing and eutrophication, resulting in habitats of poor ecological value and a loss of biodiversity (Meltofte 2010, Ejrnæs et al. 2011). This development is in accordance with our results, with a ‘moderate decline’ found for both indicators. However, it should be noted that the habitat in general no longer is attractive for the original heathland species (several of which are now extinct or too rare to be included in the CBC) and that forest species now are among the main species in the indicators. Also considering the scarcity of this habitat (cf. Tab. 1) the validity of the Heath indicator may therefore be doubtful. It is however worth noting that the decline is exacerbated if only census points with heath habitat are included in the analysis (Tab. 4). Dunes/shore: The high use indicator for dune and shore habitats showed an overall ‘moderate decline’ (Tab. 2, Fig. 5), although the indicator was characterized by a more stable trend after 1990 (Tab. 3). Noticeably, most increases were seen for species, which are associated with the aquatic environment, e.g. Red-necked Grebe, Great Cormorant, Herring Gull and Great Black-backed Gull Larus marinus, while species associated with dune and shore habitats showed declines, e.g. Sand Martin, Wheatear and Red-backed Shrike. However, it is noticeable that many of the most declining species are also trans-Saharan migrants. The observed declines seen among shore-associated species may be attributed to overgrowing and the establishment of plantations, forests and summerhouse areas, which has taken place along the Danish coasts during the past century and which has resulted in a halving of the area of dune habitats from 0.4% in 1970 to 0.2% in 2000 (Levin & Normander 2008). However, due to the heterogeneity and scarcity of this habitat type, the validity of the Dunes/shore indicator is questionable.
Bird populations in Danish habitats 205
Pressure on Danish biodiversity is already high due to current habitat management practices. Although the Danish landscapes are mosaic in structure, individual habitat patches are becoming increasingly homogenous leaving little opportunity for species to adapt to the changing environment or to move to more suitable conditions. Climate change will inevitably change the composition of the Danish bird fauna, but it is, at least for the moment, not the prime reason for low biodiversity levels in the habitats. Facing climate changes there will be a need to secure suitable habitats within the dispersal range of different species in order to maintain or increase biodiversity (Rahbek 2008).
Conclusion
Other factors influencing population trends It is worth noting that population trends for shortor long-distance migrants should not be solely attributed to habitat changes on the breeding grounds, but also to conditions in wintering areas or along migratory routes. Many terrestrial birds undertake transcontinental migrations, especially between African wintering areas and European nesting grounds, and evidence is mounting that species with contrasting migration strategies show different population trends, trans-Saharan migrants generally faring worse than residents and shortdistance migrants (Sanderson et al. 2006, Heldbjerg & Fox 2008). Recent studies suggest that climate change may now be overtaking habitat conversion as the most important influence on population trends of European birds (Lemoine et al. 2007), causing e.g. ‘mismatch’ between the arrival time of longdistance migrants and peaks of food abundance in their breeding habitats (Both et al. 2010). Furthermore, studies indicate that birds, especially largebodied K-selected species, may have difficulties dispersing quickly enough in response to climate change (Devictor et al. 2008, Schippers et al. 2011).
This study addresses the development of a new set of indicators for the status of Danish habitats using Relative Habitat Use, an objective method for indicator species selection. Results showed declines in bird populations in all nine habitat types included in the Danish CBC, indicating an ongoing and general decline in the quality of habitats. An especially alarming decline was found for arable specialists. The validity of indicators for less common habitats, i.e. Heath, Dunes/shore and Lake, was found to be questionable due to small sample sizes and large influences from species more strongly associated with other habitat types. In unison, the high use indicators for Urban, Farmland, Freshwater and Forest covered 75% of all species included in the Common Birds Census and with only a minimal species overlap. We conclude that the high use indicator is a useful tool for ecosystem monitoring and suggest the use of this set of indicators in order to obtain comprehensive monitoring of the terrestrial and limnic environment in Denmark and abroad. The intermediate use indicators included many habitat generalists and species occurring more frequently in other habitats and did not prove to be reliable indicators of ecosystem status. This highlights the high use species as a focus for further indicator work. However, intermediate use indicators may prove useful if only habitat-specific census points are considered. With significant declines found within the bird fauna of each of the nine habitat types, our results serve to underline the fact that serious measures must be taken if the loss of biodiversity in Denmark is to be halted. Although we are cautious to extrapolate our results onto the general state of biodiversity in Danish ecosystems, we hope that our results may
206 Bird populations in Danish habitats
find practical use in natural resource management as well as being used in the development of aggregate indicators for other elements of biodiversity in the future.
Acknowledgements We wish to thank the many volunteer observers participating in the Danish CBC and Ejnar Dahl Jensen for programming assistance. For comments on the methodology and manuscript we would like to thank Bo Svenning Petersen, two anonymous reviewers and our colleagues at the Science and Conservation Department, DOF-BirdLife Denmark. The project was initially funded by the Danish Nature Agency (Project no. C08046).
Resumé Denne undersøgelse beskriver anvendelsen af et nyt sæt indikatorer for fuglebestande baseret på beregning af Relativ Habitat Udnyttelse (RHU), som er en objektiv metode til udvælgelse af indikatorarter. Anvendelse af RHU muliggør udvælgelse af indikatorarter for alle ni naturtyper, som optræder i det danske punkttællingsprogram (nåleskov, løvskov, agerland, mose, hede, klit/strand, by, sø og eng), samt tre kombinerede naturtyper, skov (nåleskov+løvskov), landbrugsland (agerland+eng) og vådområder (sø+mose). Metoden undgår samtidig de potentielle fejlkilder, som præger de eksisterende indikatorudvælgelsesmetoder, der anvender subjektive udvælgelseskriterier. RHU-baserede indikatorer vurderes derfor at være mere pålidelige indikatorer for fuglebestandenes status. Ved således at sammenfatte bestandsudviklingen for flere fuglearter til en flerarts-indikator for hver naturtype var det muligt at klassificere en samlet tendens for hver naturtype i perioden mellem 1976 og 2010. Desuden blev en sammenligning af bestandsudviklingen for arter med stærke habitattilknytninger (’high use’ arter) og mere generelle habitattilknytninger (’intermediate use’ arter) udført for at afgøre, om disse to forskellige grupper udviser forskellige udviklingstendenser. Vores ’high use’ indikator viste en løbende reduktion i bestandsstørrelserne blandt danske fuglearter i fem ud af ni naturtyper (nåleskov, agerland, sø, hede og klit/strand) siden 1976. Den største tilbagegang sås for agerland. For de fire øvrige naturtyper (løvskov, mose, eng og by) fandt vi klare tilbagegange siden omkring 1990. Dette sandsynliggør, at der er sket en nedgang i kvaliteten af samtlige naturtyper, der dækkes af punkttællingerne. ’High use’ indikatorerne for by og de tre kombinerede naturtyper landbrugsland, vådområder og skov viste sig at dække 75 % af alle arter inkluderet i punkttællingsprogrammet, med kun et minimalt sammenfald af arter. ’Intermediate use’ indikatorerne viste sig derimod at være mere upålidelige indikatorer for naturtypers tilstand, idet de oftest var domineret af arter med stærkere tilknytning til andre naturtyper. Vi konkluderer derfor, at ’high use’ indikatorerne er et nyttigt værktøj til overvågning af fuglebestande i de forskellige naturtyper, og vi anbefaler brugen af denne indikatormetode med henblik på iværksættelsen af en omfattende overvågning af det terrestriske og limniske miljø i Danmark.
References Both, C., C.A.M. van Turnhout, R.G. Bijlsma, H. Siepel, A. van Strien & R.P.B. Foppen 2010: Avian population consequences of climate change are most severe for long-distance migrants in seasonal habitats. – P. Roy. Soc. B-Biol. Sci. 277: 1259-1266. Buckland, S.T., A.E. Magurran, R.E. Green & R.M. Fewster 2005: Monitoring change in biodiversity through composite indices. – Philos. T. R. Soc. B. 360: 243-254. Bøgestrand, J. 2003: Vandløb 2002. NOVA 2003. – Faglig rapport fra DMU no. 470. Børgesen, C., J. Waagepetersen, T. Iversen, R. Grant, B. Jacobsen & S. Elmholt 2009: Midtvejsevaluering af vandmiljøplan III. Hoved- og baggrundsnotater. – Institut for Jordbrugsproduktion og Miljø, Det Jordbrugsvidenskabelige Fakultet. Clavel, J., R. Julliard & V. Devictor 2010: Worldwide decline of specialist species: toward a global functional homogenization? – Front. Ecol. Environ. 9: 222-228. Danmarks Statistik 2001: Vækst i det træbevoksede areal. – Nyt fra Danmarks Statistik. Danmarks Statistik 2003: Lidt færre vintergrønne marker. – Nyt fra Danmarks Statistik, Report no. 352. Danmarks Statistik 2009: Næsten ingen braklægning. – Nyt fra Danmarks Statistik, Report no. 366. Danmarks Statistik 2010: Mindre areal med vinterafgrøder. – Nyt fra Danmarks Statistik, Report no. 582. Devictor, V., R. Julliard, D. Couvet & F. Jiguet 2008: Birds are tracking climate warming, but not fast enough. – P. Roy. Soc. B-Biol. Sci. 275: 2743-2748. Donald, P.F., R.E. Green & M.F. Heath 2001: Agricultural intensification and the collapse of Europe’s farmland bird populations. – P. Roy. Soc. B-Biol. Sci. 268: 25-29. EBCC 2012: Trends of common birds in Europe, 2012 update. http://ebcc.info/index.php?ID=485 EC 2010: Biodiversity: Post-2010; EU and global vision and targets and international ABS regime – Council conclusions. http://register.consilium.europa.eu/pdf/en/10/ st07/st07536.en10.pdf Ejrnæs, R. 2009: Notat til By og Landskabsstyrelsen med udkast til kapitel 1 til 4. Landerapporten til CBD-sekretariatet om tilstand, udvikling og trusler for Danmarks biodiversitet: Overview of Biodiversity Status, Trends and Threats in Denmark. – Danmarks Miljøundersøgelser, Aarhus Universitet. Ejrnæs, R., P. Wiberg-Larsen, T.E. Holm, A. Josefson, B. Strandberg, B. Nygaard et al. 2011: Danmarks biodiversitet 2010 – status, udvikling og trusler. – Faglig rapport fra DMU no. 815. Fox, T.A.D. 2004: Has Danish agriculture maintained farmland bird populations? – J. Appl. Ecol. 41: 427-439. Fox, T.A.D. & H. Heldbjerg 2008: Which regional features of Danish agriculture favour the corn bunting in the contemporary farming landscape? – Agr. Ecosyst. Environ. 126: 261-269. Gregory, R.D. & A. van Strien 2010: Wild bird indicators: using composite population trends of birds as measures of environmental health. – Ornithol. Sci. 9: 3-22. Gregory, R.D., A. van Strien, P. Vorisek, A.W.G. Meyling, D.G. Noble, R.P.B. Foppen & D.W. Gibbons 2005: Developing indicators for European birds. – Philos. T. R. Soc. B. 360: 269-288.
Bird populations in Danish habitats 207 Heldbjerg, H. 2005: De almindelige fugles bestandsudvikling i Danmark 1975-2004. – Dansk Orn. Foren. Tidsskr. 99: 182-195. Heldbjerg, H. & T.A.D. Fox 2008: Long-term population declines in Danish trans-Saharan migrant birds. – Bird Study 55: 267-279. Heldbjerg, H. & M. Lerche-Jørgensen 2012: Overvågning af de almindelige fuglearter i Danmark 1975-2011. – Årsrapport for Punkttællingsprojektet no. 10, DOF – BirdLife Denmark. Jiguet, F., A.S. Gadot, R. Julliard, S.E. Newson & D. Couvet 2007: Climate envelope, life history traits and the resilience of birds facing global change. – Glob. Change Biol. 13: 16721684. Kati, V., P. Devillers, M. Dufrene, A. Legakis, D. Vokou & P. Lebrun 2004: Testing the value of six taxonomic groups as biodiversity indicators at a local scale. – Conserv. Biol. 18: 667-675. Larsen, J.L., H. Heldbjerg & A. Eskildsen 2011: Improving national habitat specific biodiversity indicators using relative habitat use for common birds. – Ecol. Indic. 11: 1459-1466. Laursen, K., J. Blew, K. Eskildsen, K. Günther, B. Hälterlein, R. Kleefstra et al. 2010. Migratory Waterbirds in the Wadden Sea 1987-2008. – Wadden Sea Ecosystem no. 30. Common Wadden Sea Secretariat, Joint Monitoring Group of Migratory Birds in the Wadden Sea, Wilhelmshaven, Germany. Lemoine, N., H.-G. Bauer, M. Peintinger & K. Böhning-Gaese 2007: Effects of climate and land-use change on species abundance in a Central European bird community. – Conserv. Biol. 21: 495-503. Levin, G. & B. Normander 2008: Arealanvendelse i Danmark siden slutningen af 1800-tallet. – Faglig rapport fra DMU no. 682. Lund, M.P. & C. Rahbek 2002: Cross-taxon congruence in complementarity and conservation of temperate biodiversity. – Anim. Conserv. 5: 163-171. Meltofte, H. (red.) 2010: Danmarks natur 2010 – om tabet af biologisk mangfoldighed. – Det Grønne Kontaktudvalg. Noer, H., T. Asferg, T. Clausen, C. Olesen, T. Bregnballe, K. Laursen et al. 2009: Vildtbestande og jagttider i Danmark: Det biologiske grundlag for jagttidsrevisionen 2010. – Faglig rapport fra DMU no. 742. Nord-Larsen, T., V. Johannsen, L. Vesterdal, B. Jørgensen & A. Bastrup-Birk 2009: Skove og plantager 2008. – Skov & Landskab, Hørsholm. Nord-Larsen, T., V. Johannsen, L. Vesterdal, T. Riis-Nielsen & B. Jørgensen 2012: Skove og plantager 2012. – Skov & Landskab, Frederiksberg. Orbicon & Epinion 2012: Evaluering af stormfaldsordningen. Rapport til Naturstyrelsen. https://www.stormraadet.dk/ Stormfald/~/media/Storm/Rapporter/Evaluering%20 af%20Stormfaldsordningen.pdf Pannekoek, J. & A. van Strien 2001: TRIM 3 manual (TRends & Indices for Monitoring data). – Statistics Netherlands. http://www.ebcc.info/trim.html
Pearman, P.B. & D. Weber 2007: Common species determine richness patterns in biodiversity indicator taxa. – Biol. Conserv. 138: 109-119. Rahbek, C. 2008: Fastholdelse eller fornyelse af artssammensætningen i Danmark. Pp. 103-115 i M. Dam, J. Geldmann, A. Gideon, K.S. Hammer, A. Kelager, E. Müller et al. (eds): Wilhjelm+6. Naturen og dens forvaltning i lyset af klimaforandringerne. – Danmarks Naturfredningsforenings studenterkomiteer på Københavns Universitet og Roskilde Universitetscenter. Regeringen 2004: Vandmiljøplan III. – Miljøministeriet og Ministeriet for Fødevarer, Landbrug og Fiskeri. Sanderson, F.J., P.F. Donald, D.J. Pain, I.J. Burfield & F.P.J. van Bommel 2006: Long-term population declines in AfroPalearctic migrant birds. – Biol. Conserv. 131: 93-105. Sauberer, N., K.P. Zulka, M. Abensperg-Traun, H.M. Berg, G. Bieringer, N. Milasowszky et al. 2004: Surrogate taxa for biodiversity in agricultural landscapes of eastern Austria. – Biol. Conserv. 117: 181-190. Schippers, P., J. Verboom, C.C. Vos & R. Jochem 2011: Metapopulation shift and survival of woodland birds under climate change: will species be able to track? – Ecography 34: 909-919. Shrubb, M., P.C. Lack & J.J.D. Greenwood 1991: The numbers and distribution of Lapwings V. vanellus nesting in England and Wales in 1987. – Bird Study 38: 20-37. Skov- og Naturstyrelsen 1994: Strategi for de danske naturskove og andre bevaringsværdige skovtyper. – Miljøministeriet, Skov- og Naturstyrelsen. Skov- og Naturstyrelsen 2002: Danmarks nationale skovprogram. – Skov- og Naturstyrelsen, Miljøministeriet. Soldaat, L., H. Visser, M. van Roomen & A. van Strien 2007: Smoothing and trend detection in waterbird monitoring data using structural time-series analysis and the Kalman filter. – J. Orn. 148, Suppl. 2: 351-357. Stoltze, M. & S. Pihl 1998: Rødliste 1997 over planter og dyr i Danmark. – Miljø- og Energiministeriet/Danmarks Miljøundersøgelser og Skov- og Naturstyrelsen. Søndergaard, M., J. Skriver & P. Henriksen 2006: Vandmiljø – biologisk tilstand. – Forlaget Hovedland. Wilson, J.D., J. Evans, S.J. Browne & J.R. King 1997: Territory Distribution and Breeding Success of Skylarks Alauda arvensis on Organic and Intensive Farmland in Southern England. – J. App. Ecol. 34: 1462-1478.
Appendix 1: http://www.dof.dk/doft/2013/2.appendix1 Anne Eskildsen, Institut for Bioscience, Aarhus Universitet, Grenåvej 14, DK-8410 Rønde, Denmark Jørn Dyhrberg Larsen & Henning Heldbjerg, Dansk Ornitologisk Forening/BirdLife Denmark, Vesterbrogade 138-140, DK-1620 Copenhagen V, Denmark E-mail address:
[email protected]