APPLIED AND ENVIRONMENTAL MICROBIOLOGY, July 2008, p. 4553–4559 0099-2240/08/$08.00⫹0 doi:10.1128/AEM.02936-07 Copyright © 2008, American Society for Microbiology. All Rights Reserved.
Vol. 74, No. 14
Use of Attenuated Total Reflectance Fourier Transform Infrared Spectroscopy To Identify Microbial Metabolic Products on Carbonate Mineral Surfaces䌤† Heather A. Bullen,1 Stuart A. Oehrle,1 Ariel F. Bennett,2 Nicholas M. Taylor,2 and Hazel A. Barton2* Departments of Chemistry1 and Biological Sciences,2 Northern Kentucky University, Highland Heights, Kentucky 41099 Received 30 December 2007/Accepted 13 May 2008
This paper demonstrates the use of attenuated total reflectance Fourier transform infrared (ATR-FTIR) spectroscopy to detect microbial metabolic products on carbonate mineral surfaces. By creating an ATR-FTIR spectral database for specific organic acids using ATR-FTIR spectroscopy we were able to distinguish metabolic acids on calcite surfaces following Escherichia coli growth. The production of these acids by E. coli was verified using high-performance liquid chromatography with refractive index detection. The development of this technique has allowed us to identify microbial metabolic products on carbonate surfaces in nutrientlimited cave environments. treme starvation, allowing us to identify the ecological mechanisms that drive high species diversity in cave environments (7). Past work suggests that soil-derived humic and fulvic acids can percolate significant distances (⬎300 m) into the subsurface and provide a source of nutrients and energy (10, 11). It is our hypothesis that these aromatic and polyaromatic soil-derived compounds contribute to the overall energy budget of these systems. Metabolic breakdown of such reduced compounds by heterotrophic microbial species can lead to the release of partially oxidized, secondary metabolic products (7), such as formic and acetic acids (17, 46–48). Such organic acids may then permit the growth of additional microbial species, which can use them as a source of carbon and energy (46–48, 51). The production of these organic acids may therefore promote resource sharing and allow the establishment of morecomplex microbial communities, similar to those we have identified in extremely starved cave environments (⬍0.5 mg/liter total organic carbon) (10, 11). If these organic acids are available for microbial growth, then it should be possible to detect the presence of these compounds within the environment. To measure the presence of metabolic acids on rock surfaces, we aimed to determine whether spectroscopic techniques such as ATR-FTIR spectroscopy could detect organic acids on mineral surfaces. While ATR-FTIR spectroscopy would not make it possible to infer the carbon and energy sources for individual species, the presence of organic acids may explain the presence of certain members of the community, such as acetate-utilizing species (44), or the mineral changes observed following microbial growth (6, 35). ATR-FTIR spectroscopy has been previously applied to evaluate carboxylic acid complexation on mineral surfaces; however, these studies were conducted in situ in the gas phase (2, 15, 52) or in aqueous solutions to assess surface coordination of adsorbates (18, 19, 21, 23, 32). To our knowledge, no one has determined if a profile of adsorbed organic acids can generate unique signatures on a surface that are stable over time and that could be used as a reference to monitor microbial metabolic activity. As our studies are carried out within cave environments, we determined whether the ATR-FTIR
Molecular phylogenetic analysis using the 16S rRNA gene sequence has revolutionized microbiology, allowing investigators to create comparative and evolutionary phylogenies for microbial species (49, 50). Phylogenetic placement also allows metabolic inference for the activity of previously uncultivated species within the environment, dramatically changing our understanding of microbial ecology and the role of microbial species within the biosphere (3, 36, 41). While metabolic inference is a valuable tool for estimating metabolic activity, specific metabolic responses to environmental conditions are harder to estimate, even for closely related species (1, 24). To overcome such limitations, investigators can employ a number of different techniques to relate identified microbial phylotypes to environmental metabolic activities, including the use of isotopic probing and quantitative mRNA and metagenomic analyses (43). Such techniques are technically challenging and often difficult in the context of low-biomass environments (12). In this paper we evaluated the utility of attenuated total reflectance Fourier transform infrared (ATR-FTIR) spectroscopy to examine microbial metabolic products on carbonate rock surfaces in low-biomass environments. ATR-FTIR spectroscopy is a powerful technique to characterize solid/gas and solid/solution interfaces and has been applied to monitor adsorption of chemical reactions at surfaces in situ (14, 16, 22, 25, 33, 53). Our results demonstrate that ATR-FTIR spectroscopy may represent a technique that will enable investigators to correlate inferred metabolic activity, based on molecular phylogenetics, with geochemical measurement (10). We have been studying microbial adaptation to starvation within cave environments (7–10). This research has been geared toward understanding what carbon and energy sources drive microbial community subsistence and growth during ex* Corresponding author. Mailing address: Department of Biological Sciences, Northern Kentucky University, SC 204D Nunn Drive, Highland Heights, KY 41099. Phone: (859) 572-5303. Fax: (859) 572-5639. E-mail:
[email protected]. † Supplemental material for this article may be found at http://aem .asm.org/. 䌤 Published ahead of print on 23 May 2008. 4553
4554
BULLEN ET AL.
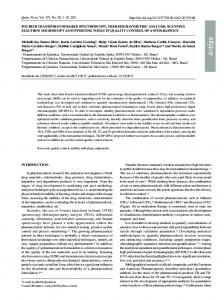
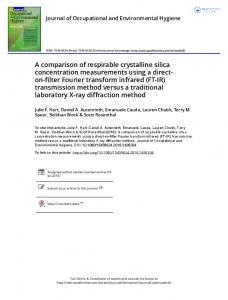
spectroscopy profile of eight common microbial metabolic products (acetic, butyric, citric, formic, glyoxylic, propionic, pyruvic, and succinic acids) could be detected on calcium carbonate, the primary mineral comprising the limestone in which most caves are formed (37). In our preliminary studies we used pure calcite (⬎99% CaCO3) crystals. All chemicals, including the calcite crystals, were obtained from Sigma-Aldrich (Atlanta, GA) unless otherwise indicated. Either the organic acids were diluted to 1 M and dropped onto the crystal, in the case of highly reactive acids (as determined by rapid CO2 liberation) such as acetic acid (pH 2.38) [2CH3COOH ⫹ CaCO3 3 (CH3COO)2Ca ⫹ CO2 ⫹ H2O], or the crystal was soaked in the acid overnight at room temperature, as in the case of succinic acid (pH 4.92). ATR-FTIR spectroscopy measurements were made with a Nicolet Nexus 670 FTIR spectrometer (Waltham, MA) equipped with a DTGS detector and a MIRacle ATR accessory (Pike Technologies, Madison, WI) with a 45° Si/ZnSe crystal. Data collections and spectral calculations were performed using OMNIC software. Spectra were taken at 64 scans and with a resolution of 4 cm⫺1. Pure calcite crystals were used because of the ability to form a tight interaction with the ATR crystal and the simplicity of the chemical reaction, compared with the complex chemistry of a cave rock (limestone) reaction. The results (Fig. 1 and 2) demonstrate a recognizable signature for each organic acid. Infrared (IR) adsorption bands of reacted calcite correlate with IR spectra of calcium salts for the respective organic acids (i.e., calcium acetate, etc.) and are consistent with literature values (2, 5, 15, 18, 19, 21, 23, 32, 39, 40, 42, 45, 52). For example, in the case of acetic acid adsorption (Fig. 1C), the spectral features are consistent with the presence of acetate (CH3COO⫺) on the surface. The COO⫺ asymmetric (1,550 cm⫺1) and COO⫺ symmetric (1,412 cm⫺1) stretches indicate a Ca-acetate complex (15, 19, 39, 52). Similarly, in Fig. 1B the CAO carbonyl stretch (1,708 cm⫺1) along with other bands (COO⫺ asymmetric stretch, 1,627 cm⫺1; COO⫺ symmetric stretch, 1,405 cm⫺1; CH3 bend, 1,350 cm⫺1) correlates with pyruvate salts and pyruvate adsorbed on TiO2 (19, 40). Sensitivity was evaluated by correlating IR band intensity ratios for acids (acetic acid, 1,020 cm⫺1; pyruvic acid, 1,708 cm⫺1) to the calcite peak (1,795 cm⫺1) as a function of acid concentration (1.0 ⫻ 10⫺6 M to 1.0 M). The organic acids demonstrate a Langmuir adsorption isotherm on calcite, consistent with adsorption of other organics onto metal oxide surfaces (4, 28), with a detection limit of 1.0 ⫻ 10⫺4 M (see Fig. S1 in the supplemental material). It should be noted that direct quantification is difficult with IR spectroscopy as the surface coverage by molecules may vary across the crystal surface. It is likely that organic acids produced by microbial activity within the soil will react with the calcium carbonate (limestone) of the epikarst horizon, defined as the interface zone between soil and rock in karst landscapes, preventing percolation deep into the subsurface. Nonetheless, to rule out the possibility that any acids detected in this study were percolating through this zone, we set up a 15-mm-diameter, 200-mm-long column packed with calcium carbonate powder. A 25-ml aliquot of 0.1 M acetic acid (pH 2.88) was passed through this column. The aliquots collected showed undetectable amounts of acetic acid, analyzed using gas chromatography-mass spectrometry with ion trap detection (Varian Inc., Palo Alto, CA).
APPL. ENVIRON. MICROBIOL.
FIG. 1. Normalized ATR-FTIR spectra of (A) calcite, (B) calcite reacted with 1 M pyruvic acid, and (C) calcite reacted with 1 M acetic acid. The influence of acid adsorption coverage on IR spectra is shown in panel B. Variations in acid coverage on the calcite crystal can lead to IR sampling of both the calcite substrate and the deposited salt under low surface coverage (i) or only the calcium salt under high surface coverage (ii). The asterisk indicates poor subtraction of gas phase CO2 adsorption on the surface.
Indeed, the ability of calcium carbonate to react with these acids was shown by mixing 20 mg of CaCO3 with 1 ml 0.1 M acetic acid on an orbital shaker for 1 h. Following mixing, acetic acid could be detected only in trace amounts (⬃1 ⫻
VOL. 74, 2008
METABOLIC DETECTION ON MINERAL SURFACES USING ATR-FTIR
4555
FIG. 2. Normalized ATR-FTIR spectra of acids reacted with calcite: (A) formic acid, (B) succinic acid, (C) butyric acid, (D) citric acid, (E) propionic acid, and (F) glyoxylic acid. The asterisk indicates poor subtraction of gas phase CO2 adsorption on the surface.
10⫺5 M) in the remaining solution. We are therefore confident that reactive acids detected within the cave environment, often separated from the surface by tens or hundreds of meters of carbonate rock, are not percolating in from soil detritus. The ATR-FTIR spectroscopy analysis of pure organic acids reacting with a calcite crystal demonstrated that this technique could detect and differentiate metabolic acids on these sur-
faces; however, this did not imply that such acids could be detected at the concentrations produced during microbial metabolism. To determine if organic acids produced at metabolic levels can be detected by ATR-FTIR spectroscopy, we placed calcite crystals in cultures of actively growing Escherichia coli K-12 cells. In this experiment, three small (⬃4-mm) sterile calcite crystals were placed into 3 ml of lactose broth (15 g/liter
4556
BULLEN ET AL.
APPL. ENVIRON. MICROBIOL.
FIG. 3. HPLC-RI chromatograms of metabolic products produced by E. coli during growth in lactose broth under anaerobic conditions. Samples were removed from the same sample following incubation at 12, 24, and 48 h and subjected to chromatography as described in the text. The peaks correspond to lactose (1), pyruvic acid (2), glyoxylic acid (3), succinic acid (4), lactic acid (5), formic acid (6), and acetic acid (7), methanol (9), and ethanol (10). The unidentified eighth peak was also present in the uninoculated media. The methanol peak (9) represents the void volume from the needle wash in the HPLC autosampler.
with methyl red as a pH indicator) and inoculated with 0.1 ml of an overnight culture of E. coli. These cultures were incubated at 20°C under three different growth conditions: with shaking (aerobic), without shaking (microaerobic), and without shaking in a Bactron I anaerobic/environmental chamber (Sheldon Manufacturing, Inc., Cornelius, OR) containing 5% CO2, 5% H2, and the balance N2 (anaerobic). Samples of broth (0.1 ml) and a calcite crystal were aseptically removed at 0, 12, 24, and 48 h. The organic acids produced during E. coli growth were measured in the growth medium at each time point using high-performance liquid chromatography (HPLC) with refractive index (RI) detection (HPLC-RI) on a Waters Alliance 2695 system with a 2414 RI detector (Waters Corporation, Milford, MA). The method employed was similar to that developed for fermentation broths (54) using an ion exclusion column (IC-Pak; 7.8 by 300 mm; 50 A; 7 m; Waters Corporation) at a flow rate of 0.6 ml/min and a mobile phase of 5 mM sulfuric acid. The chromatograms for each incubation revealed the production of numerous organic acids, such as formic and pyruvic acids, which correlated well with growth conditions, overflow metabolism, and the availability of oxygen to act as a terminal electron acceptor (Fig. 3; see Fig. S2 in the supplemental material) (47, 48). As the calcite crystals would act as a buffer in the media during growth, controls were also prepared without calcite. We then monitored the effect of calcite on the production of organic acids using HPLC-RI. These data (not shown) did suggest that there was a subtle change in the production of individual acids in the presence of the calcite crystal, but we did not see a drastic change in the profile of organic acids produced by E. coli in the presence of this mineral (data not shown). The calcite crystals removed from each E. coli culture condition were dried under ambient conditions and examined by ATRFTIR spectroscopy as described above. The results (Fig. 4; see Fig. S3 in the supplemental material) demonstrated that it was
possible to detect organic acids produced at the levels of microbial metabolic activity on calcite surfaces using ATR-FTIR spectra. For example, ATR-FTIR spectroscopy of the anaerobic crystal (Fig. 4) indicates the presence of pyruvate, demonstrated by the unique CAO carbonyl stretch (1,710 cm⫺1) along with other bands associated with the Ca-pyruvate complex (19, 40). In addition, distinct band signatures associated with acetate adsorption, at 2,918 cm⫺1 and 2,847 cm⫺1 (CH3 asymmetric stretch/symmetric stretch vibrations) (34), along with bands at 1,050 cm⫺1 and 1,021 cm⫺1, point to the presence of acetate (Fig. 4A) (2, 15, 32, 39). Interestingly, it was possible to detect the presence of pyruvic acid in the spectra for the sample grown under anaerobic conditions (Fig. 4), even after the majority of pyruvic acid had been reassimilated from the medium (Fig. 3) (51). This demonstrates that this metabolic product remains on the surface of the rock as calcium pyruvate, presumably as a result of changing solubility or a structural change that limits transporter uptake. As a result a residual amount of organic material remained detectable on the calcite surface long after the soluble acid had been removed from the media (51). Over longer periods of incubation, the accumulation of E. coli cells growing on the surface of the rock began to obscure the ability to obtain a clear ATR-FTIR signature for many of the acids analyzed; adsorption bands associated with bacterial functional groups (i.e., phosphates and carbohydrates in the region of 950 to 1,150 cm⫺1) become more evident during the incubation (Fig. 4) (26, 27, 38). The ATR-FTIR spectroscopy results as a function of incubation time were correlated with an increase in the number of bacterial cells (measured by 4⬘,6-diamidino-2-phenylindole [DAPI] staining and direct counts) covering the surface of each crystal from 2.15 ⫻ 105 to 3.80 ⫻ 105 cells cm⫺2 at 12 and 24 h, respectively, under anaerobic conditions (Fig. 4A and B). The number of cells covering the surface of the crystal did not significantly increase at 48 h (3.82 ⫻ 105 cells cm⫺2), but the substantial extracellular matrix that covered the crystal may be
VOL. 74, 2008
METABOLIC DETECTION ON MINERAL SURFACES USING ATR-FTIR
4557
FIG. 5. Normalized ATR-FTIR spectrum of a calcite crystal (A) placed within Lake Louise, Lechuguilla Cave, for 4 months and a polished limestone slide (B; host rock), placed within the Deep Secrets (LC27Z) Lake for 13 years. , bands associated with acetate; 〫, bands associated with pyruvate.
FIG. 4. Normalized ATR-FTIR spectra of calcite crystals exposed to E. coli growth in lactose broth under anaerobic conditions. Calcite crystals were removed at different incubation times: (A) 12 h, (B) 24 h, and (C) 48 h. , bands associated with acetate; 〫, bands associated with pyruvate. The asterisk indicates poor subtraction of gas phase CO2 adsorption on the surface.
responsible for obscuring the ATR-FTIR signal (Fig. 4C). Similar results were seen on the crystals grown under the other environmental conditions (data not shown). Nonetheless, such high levels of biomass are not normally associated with surfaces under nutrient-limited conditions, suggesting that such
accumulation may be less of an issue for environmental measurements (8, 11, 12). The preliminary work testing ATR-FTIR spectroscopy as an analytical tool for metabolic products under these conditions was carried out on pure calcite (⬎99% CaCO3) crystals using relatively high concentrations of organic acid; however, these results did not demonstrate that such a technique would work under the complex geochemical conditions and low metabolic activity normally associated with cave samples (8, 11, 37). We therefore tested the ability of this technique to analyze microbial metabolic activity on calcite crystals and a limestone slide that were placed in a low-nutrient cave environment. The calcite crystals were placed in two lakes within Lechuguilla Cave: (i) Deep Secrets Lake (LC27Z) at 297.5 m below ground and (ii) Lake Louise at 300.0 m below ground. The calcite crystals were placed just below the surfaces of these lakes and incubated in situ for 4 months. Following recovery, the crystals were examined by ATR-FTIR spectroscopy, as described above. The resultant IR spectroscopy profile clearly demonstrated peaks corresponding to the presence of both acetic and pyruvic acids on the surfaces of the crystals (Fig. 5A). Likewise,
4558
BULLEN ET AL.
a portion of a limestone slide made from polished host rock placed in Deep Secrets Lake in January 1994 was recovered and subjected to ATR-FTIR analysis. Again, the IR profile demonstrated the accumulation of acetic and pyruvic acids (Fig. 5B) on this more chemically complex geologic sample. Our results (Fig. 5) demonstrate that the accumulation of both acetic and pyruvic acids in situ could be detected on mineral surfaces using ATR-FTIR spectroscopy. The presence of acetic acid supports previous observations (10) and our hypothesis on the role of reduced compounds entering the cave system; bacterial species may remove excess reducing equivalents through the production of organic acids (51). These acids in turn degrade the rock surface on which microbial species grow, leading to many of the structural changes on surfaces seen in these subterranean environments (6, 35). The presence of pyruvic acid is more difficult to explain, as bacteria generally excrete this acid only under conditions of overflow metabolism (47, 48). While the low levels of total organic carbon (⬍0.05 mg/liter) normally seen in this environment would hardly be considered excess energy, it is likely that the microorganisms living in this static subterranean environment have very slow metabolic processes (31). As we have demonstrated that pyruvic acid may remain on surfaces, even in the presence of a microbial species capable of assimilating this compound, it is possible that we are observing a result of transient environmental change within the system. Alternatively, given the large variety of species in cave environments and their likely complex metabolic interactions (10, 20, 29, 30, 35), the detection of pyruvic acid opens up a new line of investigation into microbial metabolic interactions in such systems. In addition, by placing calcite crystals over specific time periods in these lakes and correlating bacterial molecular phylogenetic profiles with the appearance of such acids using ATR-FTIR spectroscopy, it may be possible to correlate the major metabolic players and rates of metabolic activity in these extremely nutrient-limited environments. Given the low biomass and amount of measurable metabolic activity in geomicrobial systems, ATR-FTIR spectroscopy represents a new technique to analyze bacterial interactions on exposed mineral surfaces. While the high reactivity of calcite with many acids can be viewed as a model for monitoring subtle microbial activity on a mineral surface, the ability of organic acids to adsorb to other surfaces may allow ATR-FTIR spectroscopy to detect geochemical activity on less-reactive minerals, such as those composing granite or quartzite. Given the increasing interest in examining the relationship between microbes and mineral surfaces, ATR-FTIR spectroscopy may prove to be a valuable technique for remote sensing of microbial metabolic products and nonvolatile organic acids (13). We thank Bradley Lubbers for excellent technical assistance and Eric Weaver, Janeen Sharpshear, Vivian Loftin, Max Wisshak, and the other cavers involved in sample collection. We also thank the staff in the Cave Resources Office at Carlsbad Cavern National Park, Larry Mallory for generously providing samples of limestone slides, and three anonymous reviewers, whose input contributed to the quality of this paper. This work was supported in part by the Kentucky EPSCoR Research Startup and Enhancement Programs (NSF no. 0447479), the Kentucky Space Grant Consortium, the Merck Institute for Science Education, and the Center for Integrative Natural Science and Mathematics at
APPL. ENVIRON. MICROBIOL. NKU. Infrastructure support was provided, in part, by the National Institutes of Health KY INBRE program (5P20RR016481-05). REFERENCES 1. Achenbach, L. A., and J. D. Coates. 2000. Disparity between bacterial phylogeny and physiology. ASM News 66:714–715. 2. Al-Hosney, H. A., S. Carlos-Cuellar, J. Baltrusaitis, and V. H. Grassian. 2005. Heterogeneous uptake and reactivity of formic acid on calcium carbonate particles: a Knudsen cell reactor, FTIR and SEM study. Phys. Chem. Chem. Phys. 7:3587–3595. 3. Amann, R. I., W. Ludwig, and K.-H. Schleifer. 1995. Phylogenetic identification and in situ detection of individual microbial cells without cultivation. Microbiol. Rev. 59:143–169. 4. Araujo, P. Z., P. J. Morando, and M. A. Blesa. 2005. Interaction of catechol and gallic acid with titanium dioxide in aqueous suspensions. Equilibrium studies. Langmuir 21:3470–3474. 5. Ayora-Canada, J. J., and B. Lendl. 2000. Study of acid-base titration of succinic and malic acid in aqueous solution by two-dimensional FTIR correlation spectroscopy. Vib. Spectrosc. 24:297–306. 6. Barton, H. A. 2006. Introduction to cave microbiology: a review for the non-specialist. J. Cave Karst Stud. 68:43–54. 7. Barton, H. A., and V. Jurado. 2007. What’s up down there? Microbial diversity in caves. Microbe 2:132–138. 8. Barton, H. A., and D. E. Northup. 2007. Geomicrobiology in cave environments: past, current and future prospectives. J. Cave Karst Stud. 69:163–178. 9. Barton, H. A., A. Pemberton, and J. Millette. 2005. Comparative study of oligotrophic bacterial species cultivated from Jack Bradley Cave, Kentucky, p. O62:1–6. Proceedings of the 14th International Congress of Speleology, Athens, Greece, 21–28 August 2005. Union Internationale de Spe´le´ologie, Postojna, Slovenia. 10. Barton, H. A., M. R. Taylor, and N. R. Pace. 2004. Molecular phylogenetic analysis of a bacterial community in an oligotrophic cave environment. Geomicrobiol. J. 21:11–20. 11. Barton, H. A., N. M. Taylor, M. Kreate, A. J. Springer, S. A. Oehrle, and J. L. Bertog. 2007. The impact of host rock geochemistry on bacterial community structure in oligotrophic cave environments. Int. J. Speleol. 36:93–104. 12. Barton, H. A., N. M. Taylor, B. R. Lubbers, and A. C. Pemberton. 2006. DNA extraction from low-biomass carbonate rock: an improved method with reduced contamination and the low-biomass contaminant database. J. Microbiol. Methods 66:21–31. 13. Benner, S. A., K. G. Devine, L. N. Matvevva, and D. H. Powell. 2000. The missing organic molecules on Mars. Proc. Natl. Acad. Sci. USA 97:2425– 2430. 14. Burgi, T., and M. Bieri. 2004. Time-resolved in situ ATR spectroscopy of 2-propanol oxidation over Pd/Al2O3: evidence for 2-propoxide intermediate. J. Phys. Chem. B 108:13364–13369. 15. Carlos-Cuellar, S., P. Li, A. P. Christensen, B. J. Krueger, B. J. Burrichter, and V. H. Grassian. 2003. Heterogeneous uptake kinetics of volatile organic compounds on oxide surfaces using a Knudsen cell reactor: adsoprtion of acetic acid, formladehyde and methanol of Fe2O3, Al2O3 and SiO2. J. Phys. Chem. A 107:4250–4261. 16. Chittur, K. K. 1998. FTIR/ATR for protein adsorption to biomaterial surfaces. Biomaterials 19:357–369. 17. Clark, D. P. 1989. The fermentation pathways of Escherichia coli. FEMS Microbiol. Rev. 5:223–234. 18. Ekstrom, G. N., and J. A. McQuillan. 1999. In situ infrared spectroscopy of glyoxylic acid adsorption and photocatalysis on TiO2 in aqueous solution. J. Phys. Chem. B 103:10562–10565. 19. Ferri, D., T. Burgi, and A. Baiker. 2002. Probing catalytic solid-liquid interfaces by attenuated total reflection infrared spectroscopy: adsorption of carboxylic acids on alumina and titania. Helv. Chim. Acta 85:3639–3656. 20. Gonzalez, J. M., M. C. Portillo, and C. Saiz-Jimenez. 2006. Metabolically active Crenarchaeota in Altamira Cave. Naturwissenschaften 93:42–45. 21. Hidber, P. C., T. J. Graule, and L. J. Gauckler. 1996. Citric-acid and dispersant for aqueous solutions of alumina suspensions. J. Am. Ceram. Soc. 79:1857–1867. 22. Hind, A. R., S. K. Bhargava, and A. McKinnon. 2001. At the solid/liquid interface: FTIR/ATR—the tool of choice. Adv. Colloid Interface Sci. 93:91– 114. 23. Hug, S. J., and D. Bahnemann. 2006. Infrared spectra of oxalate, malonate and succinate adsorbed on the aqueous surface of rutile, anatase and lepidocrocite measured with in situ ATR-FTIR. J. Electron Spectrosc. Rel. Phenom. 150:208–219. 24. Hugenholtz, P., B. M. Goebel, and N. R. Pace. 1998. Impact of cultureindependent studies on the emerging phylogenetic view of bacterial diversity. J. Bacteriol. 180:4765–4774. 25. Jakobsen, R. J., and S. W. Strand. 1993. Biological application of attenuated total reflection (ATR) spectroscopy. Pract. Spectrosc. 15:107–140. 26. Jarute, G., A. Kainz, G. Schroll, J. R. Baena, and B. Lendl. 2004. On-line determination of the intracellular poly(-hydroxybutyric acid) content in transformed Escherichia coli and glucose during PHB production using
VOL. 74, 2008
27.
28.
29.
30.
31. 32.
33. 34.
35.
36. 37. 38.
39.
METABOLIC DETECTION ON MINERAL SURFACES USING ATR-FTIR
stopped-flow attenuated total reflection FT-IR spectroscopy. Anal. Chem. 76:6353–6358. Jiang, W., A. Szena, B. Song, B. B. Ward, T. J. Beveridge, and S. C. B. Myneni. 2004. Elucidation of functional groups on gram-positive and gramnegative bacterial surfaces using infrared spectroscopy. Langmuir 20:11433– 11442. Johnson, S. B., T. H. Yoon, B. D. Kocar, and G. E. Brown. 2004. Adsorption of organic matter at mineral/water interfaces. 2. Outer-sphere adsorption of maleate and implications for dissolution processes. Langmuir 20:4996–5006. Jurado, V., J. M. Gonzalez, L. Laiz, and C. Saiz-Jimenez. 2006. Aurantimonas altamirensis sp. nov., a member of the order Rhizobiales isolated from Altamira Cave. Int. J. Syst. Evol. Microbiol. 56:2583–2585. Jurado, V., I. Groth, J. M. Gonzalez, L. Laiz, and C. Saiz-Jimenez. 2005. Agromyces subbeticus sp. nov., isolated from a cave in southern Spain. Int. J. Syst. Evol. Microbiol. 55:1897–1901. Koch, A. L. 2001. Oligotrophs versus copiotrophs. Bioessays 23:657–661. Kubicki, J. D., L. M. Schroeter, M. J. Itoh, B. N. Nguyen, and S. E. Apitz. 1999. Attenuated total reflectance Fourier-transform infrared spectroscopy of carboxylic acids adsorbed onto mineral surfaces. Geochim. Cosmochim. Acta 63:2709–2725. McQuillan, A. J. 2001. Probing solid-solution interfacial chemistry with ATR-IR spectroscopy of particle films. Adv. Mater. 13:1034–1038. Musumeci, A. W., R. L. Frost, and E. R. Waclawik. 2007. A spectroscopic study of mineral paceite (calcium acetate). Spectrochim. Acta Part A Mol. Spectrosc. 67:649–661. Northup, D. E., S. M. Barnes, L. E. Yu, M. N. Spilde, R. T. Schelble, K. E. Dano, L. J. Crossey, C. A. Connolly, P. J. Boston, D. O. Natvig, and C. N. Dahm. 2003. Diverse microbial communities inhabiting ferromanganese deposits in Lechuguilla and Spider Caves. Environ. Microbiol. 5:1071–1086. Pace, N. R. 1997. A molecular view of microbial diversity and the biosphere. Science 276:734–740. Palmer, A. N. 1991. Origin and morphology of limestone caves. Geol. Soc. Am. Bull. 103:1–21. Pradier, C. M., C. Rubio, C. Poleunis, P. Bertrand, P. Marcus, and C. Compere. 2005. Surface characterization of three marine bacterial strains by Fourier transform IR X-ray photoelectron spectroscopy and time-of-flight secondary-ion mass spectrometry, correlation with adhesion and stainless steel surfaces. J. Phys. Chem. B 109:9540–9549. Quiles, F., and A. Burneau. 1998. Infrared and Raman spectra of alkalineearth and copper(II) acetates in aqueous solutions. Vib. Spectrosc. 16:105– 117.
4559
40. Raczynska, E. D., K. Duczmal, and M. Darowska. 2005. Experimental (FTIR) and theoretical (DFT-IR) studies on keto-enol tautomerism in pyruvic acid. Vib. Spectrosc. 39:37–45. 41. Reysenbach, A.-L., G. S. Wickham, and N. R. Pace. 1994. Phylogenetic analysis of the hyperthermophilic pink filament community in Octopus Spring, Yellowstone National Park. Appl. Environ. Microbiol. 60:2113–2119. 42. Riva, A., and M. Bisognani. 1972. Infrared spectrophotometric determination of small amounts of lactic and pyruvic acids. Anal. Chem. 44:2101. 43. Schmidt, T. M. 2006. The maturing of microbial ecology. Int. Microbiol. 9:217–223. 44. Schwarz, J. I., T. Lueders, W. Eckert, and R. Conrad. 2007. Identification of acetate-utilizing bacteria and archaea in methanogenic profundal sediments of Lake Kinneret (Israel) by stable isotope probing of rRNA. Environ. Microbiol. 9:223–237. 45. Sedlarik, V., N. Saha, I. Kuritka, I. Emri, and P. Saha. 2006. Modification of poly(vinyl alcohol) with lactose and calcium lactate: potential filler from dairy industry. Plast. Rubb. Composit. 35:355–359. 46. Unden, G., and J. Bongaerts. 1997. Alternative respiratory pathways of Escherichia coli: energetics and transcriptional regulation in response to electron acceptors. Biochim. Biophys. Acta 1320:217–234. 47. Vemuri, G. N., E. Altman, D. P. Sangurdekar, A. B. Khodursky, and M. A. Eiteman. 2006. Overflow metabolism in Escherichia coli during steady-state growth: transcriptional regulation and effect of the redox ratio. Appl. Environ. Microbiol. 72:3653–3661. 48. Weber, J., A. Kayser, and U. Rinas. 2005. Metabolic flux analysis of Escherichia coli in glucose-limited continuous culture. II. Dynamic response to famine and feast, activation of the methylglyoxal pathway and oscillatory behaviour. Microbiology 151:707–716. 49. Woese, C. R. 1987. Bacterial evolution. Microbiol. Rev. 51:221–271. 50. Woese, C. R., and G. E. Fox. 1977. Phylogenetic structure of the prokaryotic domain: the primary kingdoms. Proc. Natl. Acad. Sci. USA 74:5088–5090. 51. Wolfe, A. J. 2005. The acetate switch. Microbiol. Mol. Biol. Rev. 69:12–50. 52. Xu, C., and B. E. Koel. 1995. Adsorption and reaction of CH3COOH and CD3COOD and the MGO(100) surface: a Fourier transform infrared and temperature programmed desorption study. J. Chem. Phys. 102:8158–8166. 53. Yoon, T. H., S. B. Johnson, and G. E. Brown, Jr. 2004. Adsorption of Suwannee river fulvic acid on aluminum oxyhydroxide surfaces: an in situ ATR-FTIR study. Langmuir 20:5655–5658. 54. Young, J., P. J. Lee, and A. Di Gioia. 2006. Fast HPLC analysis for fermentation ethanol processes. Waters Corporation, Milford, MA.