Journal of Applied Phycology 16: 49–59, 2004. © 2004 Kluwer Academic Publishers. Printed in the Netherlands.
49
Use of low-budget monitoring of macroalgae to implement the European Water Framework Directive Panayotis Panayotidis1,∗ , Barbara Montesanto2 & Sotiris Orfanidis3 1 Hellenic 2 Athens
Center of Marine Research, 19013 Anavissos, Attica Greece University, Department of Biology, Section of Ecology & Systematics 15784 Panepistimiopolis, Athens,
Greece 3 National
Agricultural Research Foundation (NAGREF), Fisheries Research Institute, 64007 Nea Peramos, Kavala, Greece (∗ Author for correspondence; e-mail
[email protected]) Received 13 January 2003; revised and accepted 11 November 2003
Key words: Water Framework Directive, macroalgae, coastal waters, ecological status, monitoring, biotic index, N-E. Mediterranean Abstract Benthic macroalgal communities constitute one of the ecological quality elements needed to implement the Water Framework Directive (2000/60/EC), the legislation targetted at sustainable management of the European aquatic environment. As the Directive foresees the establishment of Ecological Status Class boundaries and Reference Conditions in coastal waters, a study was conducted on the Attica coast of Greece to identify the best method to use macroalgal community data for evaluating ecological quality and at the same time keep the program within a low budget. Six seasonal quantitative and qualitative samples were taken from the upper infralittoral macroalgal communities on the Attica coast of Greece on six occasions between summer 1998 and spring 2002; these sites, which reflect a gradient of anthropogenic perturbation, were used on each occasion. A list of 60 macroalgal taxa was prepared, the cover value of each taxon was measured and the structure of the vegetation was described. The use of four different indices (Shannon-Weaver index, Pielou evenness, Multi-Dimensional Scaling plot of BrayCurtis similarity, Ecological Evaluation index-EEI) were compared. The multidimensional scaling of Bray-Curtis similarity and the EEI were better at indicating the perturbation pattern of the study area. However, only the EEI succeeded in distinguishing four quality classes (‘low’ to ‘high’). By using EEI, a spatial scale- weighted evaluation of ecological quality was also performed. Abbreviations: EC, European Council; EEC, Economic European Community; EEI, ecological evaluation index; EQR, ecological quality ratio; ES, ecological status; ESC, ecological status class; ESG, ecological state group; MDS, multidimensional scaling; QE, quality element; RC, reference conditions; WFD, Water Framework Directive
Introduction The ecological quality status of a water body, which is an overall expression of the structure and function of its biological community, should take into account natural physiographic, geographical and climatic factors, together with physical and chemical conditions, including these resulting from human activities (EEC,
1994). The management of coastal ecosystems requires evaluation of the ecological quality and investigation at the biological community level seems to be appropriate for describing long-term trends in anthropogenic stress (Crowe et al., 2000). In the case of benthic communities, a large number of concepts and numerical techniques (indicator taxa, diversity and biotic indices, multivariate tools) have been developed
50 for the proper interpretation of data (Clarke, 1993; Dauer, 1993; Elliott, 1996). The European Union has adopted the concept of ecological quality in the Water Framework Directive (2000/60/EC) by using biological communities as Quality Elements (QE) to evaluate the Ecological Status (ES). The innovative approach of the WFD includes the establishment of Reference Conditions (RC) and Ecological Status Class (ESC) boundaries by using indicative parameters or metrics (preferably in numbers) of different QE, e.g. macroalgae (EC, 2000). The ESC is used to describe the degree of human impact on the biological communities in a water body. Five classes of quality (high, good, moderate, low, bad) are foreseen in the WFD, the high class reflecting the RC. There is therefore a need for monitoring data and predictive modeling. The definitions of RC and ESC boundaries were discussed by two specific groups of experts working for the WFD implementation guidelines (documents REFCOND 2003, for inland surface waters and COAST 2002, for coastal and transitional waters. Information on WFD guidance is available at the Internet site http://forum.europa.eu.int/Public/irc/env/wfd/library ?l= /framework_directive/ guidance documents&vm= detailed&sb=Title). The principals and methods of REFCOND and COAST were taken into account in the present study. Macroalgae are mentioned in the WFD as one of the QE for the evaluation of the ES of coastal and transitional waters, the other QE for coastal waters being marine angiosperms, benthic invertebrate fauna and phytoplankton. In the upper infralittoral zone of undisturbed Mediterranean locations, macroalgae form well-stratified communities with a clearly defined canopy stratum, dominated by large brown algae, such as Cystoseira spp. (Boudouresque, 1969; Giaccone & Bruni, 1972–1973; Ballesteros, 1990; Montesanto & Panayotidis, 2000). The upper infralittoral zone (down to 1.0 m depth) is one of the habitat types described in the ‘Habitat’ Directive 92/43/EEC (NATURA-2000 code 1170). Because the upper infralittoral vegetation could be considered as a well-defined system, easily accessible and able to express the anthropogenic stress, it could be suitable for the first evaluation of the ES as well as for the future long term monitoring which is foreseen in the WFD. The upper infralittoral zone of Attica coast (metropolitan area of Athens) has been under the stress of urban pollution for many decades (Friligos, 1985). For
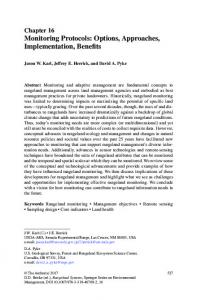
Figure 1. The study area.
this reason, the macroalgal communities of this area are relatively well known from earlier studies dealing with the impact of pollution (Diapoulis & Haritonidis, 1987; Panayotidis & Chryssovergis, 1998). During the last decade of the 20th century, following introduction of the wastewater treatment plan for Athens, a spectacular decrease of eutrophication phenomena was observed (Siokou-Frangou, 2002). Thus, this coastal front, which is the marine space of the ‘Athens 2004’ Olympic Games, seems to be a good place for applied ecological research. This study aimed to show how data on the benthic macroalgal community can be used for the purposes of the WFD. Several metrics based on the composition and abundance of the hard bottom macroalgae in the upper infralittoral zone are proposed as tools for the rapid classification of a water body type. Obviously, the result of this rapid assessment is not the final ES evaluation, because this latter is the resultant of biological and physical-chemical quality. However, for practical reasons, in the following paragraphs the term ESC will be used for the proposed classification.
51 Methods Study area Six sampling locations (sites) were studied at the upper infralittoral zone on the marine front of the metropolitan area of Athens (coast of Attica in Saronikos and S. Evoikos Gulfs: Figure 1). The sites can be considered as examples of the water body type ‘rocky’, ‘deep’ and ‘moderately exposed’, according to the typology proposed for the Mediterranean eco-region by a group of experts working for the WFD implementation guidelines (COAST, 2002). Sites 1 to 4 are located in the Saronikos Gulf. They were placed on two axes of gradual attenuation of the human impact caused by the central outfall of urban wastes, considered as the main source of nuisance in the area (Simboura et al., 1995). Sites 1 and 2 were on an axis starting from the outfall towards the western part of the gulf, while sites 3 and 4 were on an axis starting from the outfall towards the outer part of the gulf. The choice of the sampling sites aimed to reflect the ecological status of the different parts of the Saronikos Gulf (Inner, Western and Outer Gulf), as they are described in earlier papers based on hydrological data (Coahman et al., 1976). Sites 5 and 6 are located in the south part of S. Evoikos Gulf and are included in the NATURA-2000 network, with codes GR 3000004 and GR 3000003, respectively. Site 4 is also situated close to the NATURA-2000 site GR 3000005, the terrestrial part of which is a Natural Park and the famous archaeological site of Cape Sounion. The sampling sites 4, 5 and 6 present minor anthropogenic disturbance and therefore they are suitable for RC description. In the following paragraphs the abbreviations S1–S6 will be used for the sampling sites. The coastal front of the metropolitan area of Athens and especially the space between S3 and S4 is hosting the infrastructures for the nautical sports of the ‘Athens 2004’ Olympic Games. Sampling Six samplings were carried out between summer 1998 and spring 2002 (August 1998, March 1999, June 1999, June 2001, September 2001 and March 2002) in order to monitor the macroalgal community characteristics. The sampling was destructive (1 random sample from a permanent site-square 5 × 5 m per sampling period) on a quadrate 20 cm × 20 cm, which is considered to be the minimal sampling area in the
case of the Mediterranean infralittoral communities (Dhont & Coppejans, 1977; Boudouresque & Belsher, 1979). Several underwater photos of the vegetation at each sampling site were used to monitor quantitative changes on a broader scale. The classification and authorities of the identified taxa were based on the current checklists of the Mediterranean seaweeds: Ribera et al. (1992) for the brown algae, Gallardo et al. (1993) for green algae, Gomez Garreta et al. (2001) and Athanasiadis (1987) for red algae. Most were identified to the species level. Blue-green algae were rare in the study area and were considered insignificant for the purposes of this study. The quantitative study was performed according the methodology proposed by Boudouresque (1971) and developed by Verlaque (1987). Each sample was sorted carefully and the surface covered by each species in vertical projection was quantified as % of coverage of the sampling quadrat (1% sampling surface = 4 cm2 ). The total coverage usually exceeded 100% due to the presence of different layers in the vegetation (canopy, bushy layer, crusts and epiphytes). A nominal coverage value (0.1%) was allocated to species showing insignificant abundance. Data analysis The macroalgal community was studied using different metrics: Species number, abundance (% coverage of the substratum), Shannon-Weaver diversity index (H’, log2), Pielou evenness (J’), Bray-Curtis similarity index (Multi-Dimensional Scaling plot of similarity among sampling sites) and the Ecological Evaluation index (EEI), an original biotic index. The calculation of diversity indices was based on coverage measurements, a methodology adapted to the macroalgae by Boudouresque (1971) and Frontier (1983). Multivariate analyses based on mean coverage data after log(x+1) transformation. The similarity of the sites was investigated using cluster analysis (group average) and non-parametric multidimensional scaling (multidimensional scaling) based on the Bray-Curtis similarity index. The ANOSIM test was used in order to verify the statistical significance of the cluster analysis. The species contributing most to the similarity among clusters of sites were investigated using the SIMPER analysis (Carr, 1997). All calculations were performed using the PRIMER v. 5.0 software package. One-way ANOVA tests of log(x+1) transformed data have been carried out using the STATGRAFICS v. 5.5 software package.
52 Table 1. List of species in the study area. The coverage of each species (mean from six samplings) is expressed as% sampling surface. The species are grouped in two Ecological State Groups (ESG) Species Chlorophyceae Acetabularia acetabulum Anadyomene stellata Bryopsis spp. Caulerpa racemosa Cladophora spp. Codium fragile Enteromorpha spp. Flabellia petiolata Halimeda tuna Pseudochlorodesmis furcellata Ulva rigida Valonia utricularis Fucophyceae Colpomenia sinuosa Cystoseira cf. crinita Cystoseira compressa Cystoseira mediterranea Dictyopteris membranacea Dictyota spp. Ectocarpus sp. Halopteris filicina Halopteris scoparia Padina pavonica Petalonia fascia Sargassum vulgare Sphacelaria cirrosa Sphacelaria furcigera Scytosiphon lomentaria Taonia atomaria Rhodophyceae Acanthophora delilei Amphirhoa rigida Antithamnion spp. Calithamnion corumbosum Ceramium ciliatum Ceramium diaphanum Champia parvula Chondria dasyphylla Corallina elongata Corallina granifera Dasya rigidula Dermatolithon spp. Erithrotrichia spp. Fosliella spp. Gelidium spp. Gelidiella ramellosa
ESG
Site 1
Site 2
Site 3
Site 4
Site 5
Site 6
I I II II II II II I I II II II
– – 0.3 – 2.2 1.0 3.3 – – – 9.8 –
– – – – 0.2 0.8 – – – – 45.8 –
– – – 0.2 9.8 – – – 4.2 – 40.2 0.3
0.2 0.3 – 9.3 3.5 – – 1.2 0.7 – 5.8 0.2
0.8 0.8 – – 4.3 – – – 11.3 0.7 – 0.8
0.8 1.0 0.4 – 5.4 – 0.4 1.4 2.4 0.4 – 0.2
II I I I II II II II II I II I II II II I
2.7 59.0 9.5 – 16.5 0.5 – – 12.5 2.7 14.5 22.2 2.7 – – 0.5
4.3 – – – 51.8 18.5 – – 0.2 4.5 14.7 4.7 – – – –
0.8 14.3 – – 14.7 10.2 – – 19.7 7.0 – 12.5 – 0.2 – –
– 76.8 15.0 1.7 2.7 2.5 – – 14.5 8.5 – 15.2 – 2.3 – 0.7
– 52.4 8.0 – – 4.4 – 0.2 1.9 7.5 – 6.0 – 19.3 – –
– 36.3 35.0 – 2.9 3.3 0.4 2.9 0.8 10.3 – – – 5.0 0.4 –
II I II II II II II II I I II I II I II II
0.5 – – – – 0.7 – – 2.0 – – 3.3 0.1 1.7 – –
– – – – – – – 2.5 33.8 – – – 1.7 0.1 – –
22.0 – – – – – – – 2.8 – – – 0.1 0.3 – –
– 3.2 – – 0.5 0.2 – – 0.7 – – 2.5 0.1 4.2 0.5 –
– – – 0.5 – 2.2 1.2 0.8 7.7 12.8 0.7 6.9 0.1 8.0 – 5.7
– – 0.1 – – – – – 3.3 0.7 – 0.8 –0.1 1.3 – 0.4
53 Table 1. Continued Species Gigartina acicularis Gigartina tedii Gracilaria corallicola Gonyotrichon spp. Griffithsia schousboei Herposiphonia secunda Hypnea musciformis Jania rubens Laurencia obtusa Laurencia papilosa Lomentaria clavelosa Lophosiphonia scopulorum Lithothamnion spp. Pheyssonnelia rosa-marina Polysiphonia spp. Spermothanmion flabellatum
ESG
Site 1
Site 2
Site 3
Site 4
Site 5
Site 6
II II II II II II II I II II II II I I II II
4.7 – 0.1 0.1 0.5 – 2.8 28.0 7.7 – 0.2 – 0.7 – 0.3 –
5.8 2.2 1.7 0.7 0.5 – 0.2 2.8 0.5 – – 2.0 – – 5.7 –
0.2 – – 0.1 – – 12.8 36.5 9.8 – – – – – 2.2 –
– – – 0.1 0.2 0.3 0.2 19.5 0.7 – 0.7 – – 0.5 0.3 –
– – – 0.1 0.3 5.3 – 20.7 4.3 – 9.0 – 0.3 – 5.7 0.5
– – – 0.1 0.8 0.4 – 12.9 1.3 0.1 1.3 0.8 4.0 0.5 –
The EEI was calculated according to Orfanidis et al. (2001, 2003), described also on the site: www.fishri.gr (Laboratories / Marine Ecology / Water quality). The EEI is an original biotic index based on the concept of morphological and functional groups (Littler & Littler, 1980, 1984). The species presented on Table 1 were divided in two Ecological State Groups (ESG). In the ESG I were grouped the thick leathery, the articulate upright calcareous and the crustose calcareous species. Most of them are k-selected species. In the ESG II were grouped the foliose, the filamentous and the coarsely branched upright species. Most of them are r-selected species. Each sampling site was classified in one of the five ESC after a cross-comparison of the coverage value of the ESG I and II on a matrix (Figure 2). A numerical scoring system was used to express the category of ESC to a number (bad = 2, low = 4, moderate = 6, good = 8, high = 10). In order to evaluate the spatial scale-dependent ESC of the studied coastline, the length-weighted value was calculated. For this, the score for each site was multiplied by the percentage coastline considered to be representative and the products were summed (>8 = high, 8->6 = good, 6>4 = moderate, 4->2 = low, 2 = bad). According to the REFCOND document, the biological parameters should be expressed as a numerical value between 0 (bad ES) and 1 (high ES). For each ecological quality metric in a given sampling site, this range results
Figure 2. Matrix proposed by Orfanidis et al. (2001) for the evaluation of the ESC, according the classification induced in Directive 2000/60/EC.
from the ratio of the observed value versus the value of the same metric under reference conditions (Ecological Quality Ratio-EQR). The principal of EQR for the case of the EEI could be applied following the formula: EEIEQR=0.125x(EEIvalue/RCvalue)–0.25, where RCvalue=10.
54 Results Description of the vegetation The abundance and frequency of the species presenting at least 1% coverage in a sampling site is presented in Table 1. Red algae were dominant qualitatively at all sites, whereas brown algae were dominant quantitatively. The canopy layer of the vegetation was well developed at S1, S4, S5 and S6, mainly due to the presence of Cystoseira spp. Other species e.g. Dictyopteris membranacea formed a pseudo-canopy layer when they were massively present. A well-developed bushy layer was mainly formed by Jania rubens, Laurencia obtusa, Padina pavonica and Halopteris scoparia. At S2 and S3 the bushy layer was the only important stratum of the vegetation. In these cases, the species Corallina elongata and Ulva rigida were dominant. The encrusting layer was in general scarce and limited to the species of Lithothamnion spp. and Pheyssonnelia rosa-marina. Small epiphytes (Erythrotrichia spp., Gonyotrichon spp., Fosliella spp. and Dermatolithon spp.) were present in all sites. An exceptional massive presence of Erythrotrichia spp. was noticed on senile Dictyopteris membranacea specimens at S2 and an important presence of Fosliella spp. and Dermatolithon spp. was noticed at S1, S4, S5 and S6 on senile Cystoseira spp. specimens. Structural analysis of macroalgal community The number of species per sampling effort ranged from 9 (September ’01 at S2) to 29 (March ’99 at S5). A statistically significant increase of the total number of species was noticed from the Inner Saronikos Gulf sampling sites (S1, S2 and S3) towards the Outer Saronikos and S. Evoikos gulfs (S4, S5 and S6). Minimum and maximum species numbers were found at S2 and S5 respectively (Figure 3). The coverage values per sampling ranged from 90% (June ’01, S6) to 342% (June ’99, S5). Although there is a trend of decrease in coverage values from the Inner Saronikos towards the Outer Saronikos and S. Evoikos gulfs, no statistically significant differences among the studied sites were found. The values of H’ and J’ presented a similar pattern of variation: they are decreasing from S1 towards S4, then they are increasing towards S5 and finally they decrease again at S6. The values of H’ ranged from 1.33 (August ’98, S2) to 4.13 (March ’99, S5) and the
Figure 3. Comparative presentation of the number of species, coverage, H, J and EEI variations in the studied sites. Statistical significant variations are marked with ∗∗ .
values of J’ ranged from 0.36 (August ’98, S2) to 0.85 (March ’99, S5). Bray-Curtis similarity cluster analysis and multidimensional scaling ordination of the sites are shown in Figure 4. At 60% similarity three clusters were present: S1 and S3 formed the first one, S4, S5 and S6 formed the second, while S2 was isolated. The ANOSIM test showed that these groups are significantly different at a level 0.1% (global R equals 0.708). An analysis of the contribution of each species to
55
Figure 4. Similarity clusters and 2-d multidimensional scaling plot of the studied sites.
the average Bray-Curtis similarity between the groups using the SIMPER analysis showed that differences were mainly due to the species Ulva rigida, Cystoseira spp., Halopteris scoparia, Dictyopteris membranacea, Corallina elongata and Jania rubens (Table 2). Functional analysis of macroalgal community In the ESG I and II eighteen and forty-two species were classified respectively (Table 1). Species of ESG II were dominant mainly at S2. They had an important coverage also in S1 and S3, whereas species of ESG I were dominated at S4, S5 and S6. Using the matrix presented in Figure 2 the studied sites were classified as: S2 – ‘low’; ESC, S1 and S3 – ‘moderate’; ESC, S4 and S5 – ‘good’ ESC; S6 – ‘high’ ESC (Table 3). By taking into account the length of the coast corresponding to each of the sampled sites, the area near the urban complex of Athens (Inner Saronikos Gulf) and away (Outer Saronikos and S. Evoikos Gulf) was classified into ‘moderate’ (EEI = 4.9, EEIEQR = 0.36) and ‘high’ (EEI = 8.23, EEIEQR = 0.78) ESC respectively.
Discussion The taxonomic, structural and functional parameters of the macroalgal communities provided appropriate metrics for the ecological quality classification on the Attica coast and validation of possible reference conditions sites, by following a low-budget monitoring program. The presence-absence or the relative abundance of indicator taxa in respect to the total flora
(Pergent, 1991; Dauer, 1993; Dale & Beyeler, 2001) can be used as a simple, but robust, approach for ecological quality classification. However, this requires the definition of reference taxa and abundance levels for each habitat type and the ranges of variation for each quality class. In the case study of the Attica coast, the presence-absence of the key genera Cystoseira and Ulva could distinguish two ESC. In the first class are placed the most degraded sites (S2 and S3) with small coverage values or absence of Cystoseira spp. and dominance of Ulva (x>40%, Table 1). In the second one are placed the most pristine sites (S1, S4, S5 and S6) with small coverage values or absence of Ulva and dominance of Cystoseira spp. (x>50%, Table 1). This classification does not illustrate properly the coastal environment by mixing pristine sites (S5 and S6) with moderately degraded ones (S1). The diversity indices provide an approach to biological quality based on the structure of the community. Although the Shannon-Weaver diversity index is one of most commonly used in the assessment of pollution in marine benthic communities, the use and interpretation of this index has been subjected to long debate (Clarke & Warwick, 1994; Jennings and Reynolds, 2000). Sampling methodology, sample size and identification procedure influences the value of Shannon-Weaver index. The validity of the ShannonWeaver index in the case of hard substrata communities is further argued, because sedentary organisms are not easily enumerated. Consequently, species variety and community diversity values can only be compared if the same sampling methodology has been followed, including same level of taxonomic expert-
56 Table 2. Species contributing most to similarity among clusters of sites (SIMPER analysis) Groups a & b Average dissimilarity: 58.65 Species
Cystoseira cf. Crinita Halopteris scoparia Corallina elongata Jania rubens Dictyopteris membranacea Sargassum vulgare Dictyota spp. Laurencia obtusa Petalonia fascia Padina pavonica Polysiphonia spp. Groups a & c Average dissimilarity: 60.04 Species
Ulva rigida Cystoseira compressa Sphacelaria cirrosa Sargassum vulgare Dictyopteris membranacea Cystoseira cf. Crinita Halopteris scoparia Halimeda tuna Dictyota spp. Cladophora spp. Laurencia obtusa Padina pavonica Corallina elongata Acanthophora delilei Lithothamnion spp. Hypnea musciformis Jania rubens Polysiphonia spp.
Average abundance Group a
Average abundance Group c
Contribution (%)
Cumulative (%)
36.67 16.08 2.42 32.25 15.58 17.33 5.34 8.75 7.25 4.83 1.25
0.00 0.17 33.83 2.83 51.83 4.67 18.50 0.50 14.67 4.50 5.67
7.44 6.42 6.25 5.85 5.81 4.98 4.63 4.30 4.15 3.78 3.63
7.44 13.85 20.11 25.96 31.76 36.75 41.38 45.68 49.83 57.70 61.32
Average abundance Group a
Average abundance Group c
Contribution (%)
Cumulative (%)
25.00 4.75 0.08 17.33 15.58 36.67 16.08 2.08 5.34 6.00 8.75 4.83 2.42 11.25 0.08 7.83 32.25 1.25
1.94 19.33 8.86 7.06 1.86 55.17 5.75 4.81 3.39 4.42 2.08 8.78 3.89 0.00 3.64 0.06 17.69 2.00
6.03 4.93 4.49 4.47 4.13 4.01 3.92 3.23 3.01 2.86 2.86 2.85 2.68 2.53 2.50 2.49 2.42 2.31
6.03 10.95 15.45 19.91 24.04 28.05 31.97 35.20 38.21 41.07 43.93 46.78 49.46 51.99 54.50 56.99 59.41 61.72
ise. These indices are also habitat type dependent, which means that different ranges of values or classification schemes should apply for different habitat types. For the needs of the WFD implementation, it is very probable that sampling effort has to be based on low-budget monitoring and taxonomic effort will be limited to the abundant taxa. Thus, diversity and evenness have to be considered as accessory tools for the ecological quality classification. The present res-
ults confirm this suggestion. Multivariate techniques have been used successfully to identify disturbance at the macrobenthic community level (Clarke, 1993; Warwick & Clarke, 1993). The 2-d multidimensional scaling plot of similarity values could be used as a simple metric for the ecological quality classification. On the 2-d multidimensional scaling plot the points corresponding to the bad or low quality sites are placed at one side of the plot, while the points corresponding
57 Table 2. Continued Groups b & c Average dissimilarity: 76.66 Species
Average abundance Group b
Average abundance Group c
Contribution (%)
Cumulative (%)
0.00 45.83 51.83 0.00 33.83 0.00 18.50 2.83 4.50 0.00 0.17 4.67 0.17 5.67 4.33
55.17 1.94 1.86 19.33 3.89 8.86 3.39 17.69 8.78 4.81 4.42 7.06 5.75 2.00 0.00
7.34 6.73 6.61 5.71 4.78 4.15 3.27 3.16 3.08 3.00 2.87 2.78 2.60 2.52 2.38
7.34 14.07 20.68 26.39 31.18 35.32 38.60 41.76 44.83 47.84 50.71 53.48 56.08 58.60 60.97
Cystoseira cf. crinita Ulva rigida Dictyopteris membranacea Cystoseira compressa Corallina elongata Sphacelaria cirrosa Dictyota spp. Jania rubens Padina pavonica Halimeda tuna Cladophora spp. Sargassum vulgare Halopteris scoparia Polysiphonia spp. Colpomenia sinuosa
Table 3. Total coverage values of ESG I and ESG II per sampling site, calculated from Table 1. Estimations of the ESC based on the matrix given in Figure 2. Values of EEI and EEI EQR. Spatial scale-weighted ecological status classification of the studied area, based on the coastline length Outer SaronikosSampling Sampling Sampling Sampling Sampling Sampling Inner Site 4 Attica coast Site 1 Site 2 Site 3 Site 4 Site 5 Site 6 Saronikos & S. Evoikos (All sites) Sites 1, 2, 3 Sites 5, 6 Total coverage of ESG I Total coverage of ESG II ESC EEI value EEIEQR Coastline length in km % studied coast Scale weighted EEI value EEIEQR ESC
129 85 Moderate 6 0.5 69 16
46 159 Low 4 0.25 139 32
74 143 Moderate 6 0.5 44 10
151 44 Good 8 0.75 58 13
to the good or high ES sites are placed at the opposite side, forming a left/right or a top/bottom pattern. The points placed in the space between opposite sides could represent the moderate quality. In the present study the 2-d multidimensional scaling plot of the similarity values (Figure 4) shows S2 on the left, S4, S5 and S6 on the right while S1 and S3 in the middle. This pattern corresponds to low, high and moderate quality
151 59 Good 8 0.75 108 25
111 26 High 10 1 21 5
83 129 Moderate 6 0.5 251 57 4.9 0.36 Moderate
138 43 Good 8 0.75 188 43 8.23 0.78 High
111 86 Moderate 6 0.5 440 100 6.32 0.54 Good
respectively. The approach to the ecological quality through the biotic indices is an old but still relevant development (Engle et al., 1994; Grall & Gl˙emarec, 1997; Borja et al., 2000) and is based on the concept of indicator groups (taxonomic or functional) of organisms. Functional grouping of organisms was in some cases preferable than taxonomic one, reducing spatial and temporal community variability and emer-
58 ging patterns without loosing important information (Steneck & Watling, 1982). For example, a universal pattern described by Regier & Cowell (1972), Murray & Littler (1978), Sousa (1980), Duarte (1995), Schramm (1999) and validated also in this study, is that highly stressed or disturbed marine environments are inhabited by annual species with high growth rates and reproductive potential, while undisturbed marine environments by perennial species with low growth rates and reproductive potential (Table 1). This was the spark to develop the EEI (Orfanidis et al., 2001, 2003), based on the functional-morphological model of Littler & Littler (1980) and use it to divide marine benthic macrophytes in two different ecological groups, the late-successional or perennials (ESG I) and the opportunistic or annuals, (ESG II). In the present study, the EEI divided the sampling sites into four ESC (Table 3) and indicated the pristine S6 as possible RC location. This pattern is in accordance to existing environmental conditions in Saronikos Gulf (Simboura et al., 1995; Panayotidis & Chryssovergis, 1998). Furthermore, the EEI has also succeeded in classifying the Attica coast in sub-regional scales (Table 3) of moderate and good ESC (Inner Saronikos and Outer Saronikos-S. Evoikos respectivelly), underlining the scale-dependence of ecological patterns and processes (Schneider 1994). These results indicate the potential for restoration along the Inner Saronikos coast, something which is also required for the WFD. In the case of hard substrata in the N-E. Mediterranean, a restoration goal for a disturbed coastal environment could include an improvement of environmental conditions to allow the reinstallation of Cystoseira spp. communities (Montesanto & Panayotidis, 2000; Orfanidis et al., 2001). Restoration of communities is a primary focus of many restoration efforts, including a recently attempt to restore kelp communities along the Pacific Ocean coasts of Mexico (Robledo et al., 2000). In conclusion, the choice of macroalgae as QE for the evaluation of the ES of coastal waters is reliable. In the case study of the coast of Attica, with a relatively small sampling set, a taxonomic effort limited to the abundant species and a simple statistical treatment, the trends of the ecological quality were clearly emerging. Using different ecological indices, several ESC and potential RC locations were appearing. The number of classes depended on the resolving power of each index. For the Mediterranean eco-region the use of a biotic index as the EEI seems to be a well adapted for the implementation of the WFD, because there are no monitoring data series, published sampling sets are
usually small and the exhaustive lists of species are rare. Nevertheless, the results of this study have to be validated by similar studies in other areas.
References Athanasiadis A (1987) A Survey of the Aegean Sea, with Taxonomic Studies on the Species of the Tribue Antithamnieae (Rhodophyta). Ph.D Thesis, University of Goteborg, 174 pp. Ballesteros E (1990) Structure and dynamics of the Cystoseira caespitosa (Fucales, Phaeophyceae) community in the North-Western Mediterranean. Scient. Mar. 54: 155–168. Borja A, Franco J, Pérez V (2000) A marine biotic index to establish the ecological quality of soft-bottom benthos within European estuarine and coastal environments. Mar. Poll. Bull. 40: 1100– 1114. Boudouresque CF (1969) Etude qualitative et quantitative d’un peuplement algal à Cystoseira mediterranea dans la région de Banyuls sur Mer. Vie et Milieu 20: 437–452. Boudouresque CF (1971) Méthodes d’étude qualitative et quantitative du benthos (en particulier du phytobenthos). Tethys 3: 79–104. Boudouresque CF, Belsher T (1979) Le peuplement algal du port de Port-Vendres: Recherches sur l’aire minimale qualitative. Cah. Biol. mar. 20: 259–269. Carr MR (1997) Primer User Manual. Plymouth Marine Laboratory, UK: 44 pp. Clarke KR (1993) Non-parametric multivariate analyses of changes in community structure. Aust. J. Ecol. 18: 117–143. Clarke KR, Warwick RM (1994) Change in Marine Communities: An Approach to Statistical Analysis and Interpretation. Plymouth Marine Laboratory, UK: 144 pp. Coachman L, Hopkins T, Dugdale R (1976) Water masses of the Saronikos gulf in winter. Acta Adriatica 18: 133–162. COAST CIS Working Group (2002) Guidance on Typology, Reference Conditions and Classification Systems for Transitional and Coastal Waters. Final draft November 2002. Crowe TP, Thompson RC, Bray S, Hawking SJ (2000) Impacts of anthropogenic stress on rocky intertidal communities. J. aquat. Ecosyst. Stress & Recovery 7: 273–297. Dale VH, Beyeler SC (2001) Challenges in the development and use of ecological indicators. Ecol. Indicators 1: 3–10. Dauer DM (1993) Biological criteria, environmental health and estuarine macrobenthic community structure. Mar. Poll. Bull. 26: 249–257. Dhont F, Coppejans E (1977) Résultats d’une étude d’ aire minima des peuplements algaux photophiles sur substrat rocheux à PortCros et à Banyuls (France). Rapp. P.V. Reun. CIESM 24 (4): 141–142. Diapoulis A, Haritonidis S (1987) A qualitative and quantitative study of the marine algae in the Saronikos Gulf (Greece). P.S.Z.N.I. Marine Ecology 8: 175–189. Duarte CM (1995) Submerged aquatic vegetation in relation to different nutrient regimes. Ophelia 41: 87–112. EC (2000) Council Directive for a legislative frame and actions for the water policy, 2000/60/EC, Official Journal of the E.C. 22/12/2000. EEC (1994) Proposal for a Council Directive on the ecological quality of water. 94/C 222/06, Official Journal of the E.C. 10/8/1994. Elliott M (1996) The derivation and values of ecological quality standards and objectives. Mar. Poll. Bull. 32: 762–763.
59 Engle VD, Summers JK, Gaston GR (1994) A benthic index of environmental condition of Gulf of Mexico estuaries. Estuaries 17: 372–384. Friligos N (1985) Compensation effect of phytoplankton on nutrients from a sewage outfall in summer. Hydrobiologia 126: 53–58. Frontier S (1983) Sratégies d’échantillonage en Ecologie. Collection Ecologie, Masson, Paris: 494 pp. Gallardo T, Gómez Garreta A, Ribera MA, Cormaci M, Furnari G, Giaccone G, Boudouresque CF (1993) Check-list of Mediterranean Seaweed. II. Chlorophyceae. Bot. mar. 36: 399–421. Giaccone G, Bruni A (1972–1973) Le Cistoseire e la vegetazione sommersa del Mediterraneo. Atti dell’ Instituto Veneto de Scienze 81: 59–103. Gómez Garreta A, Gallardo T, Ribera MA, Cormaci M, Furnari G, Giaccone G, Boudouresque CF (2001) Check-List of Mediterranean Seaweeds. III. Rhodophyceae. Bot. mar. 44: 425–460. Grall J, Glémarec M (1997) Using biotic indices to estimate macrobenthic community perturbations in the Bay of Brest. Estuar. coast. shelf Sci. 44 (Suppl. A): 43–53. Jennings S, Reynolds JD (2000) Impacts of fishing on diversity: from pattern to process. In Kaiser MJ, De Groot S (eds), Effects of Fishing on Non-Target Species and Habitats, Blackwell Science, Oxford, pp. 235–250. Littler MM, Littler DS (1980) The evolution of thallus form and survival strategies in benthic marine macroalgae: field and laboratory tests of a functional form model. American Naturalist 116: 25–44. Littler MM, Littler DS (1984) Relationships between macroalgal functional form groups and substrata stability in a subtropical rocky-intertidal system. J. exp. mar. Biol. Ecol. 74: 13–34. Montesanto B, Panayotidis P (2000) The Cystoseira spp. communities from the upper Aegean Sea. J. mar. biol. Ass., U.K. 80: 357–358. Murray S, Littler MM (1978) Patterns of algal succession in a perturbated marine intertidal community. J. Phycol. 14: 506–512. Orfanidis S, Panayotidis P, Stamatis N (2001) Ecological evaluation of transitional and coastal waters: a marine benthic macrophytes model. Marine Medit. Sci. 2(2): 46–65. Orfanidis S, Panayotidis P, Stamatis N (2003) An insight to the ecological evaluation index (EEI). Ecol. Indicators 3: 27–33.
Panayotidis P, Chryssovergis F (1998) Végétation benthique des côtes Est de l’Attique (Mer Egée, Grèce). Mesogée 56: 21–26. Pergent G (1991) Les indicateurs écologiques de la qualité du milieu marin en Méditerranée. Océanis 17: 341–350. REFCOND CIS working group (2003) Guidance on establishing Reference conditions and Ecological Status Class boundaries for Inland Surface Waters. Final draft, version 7.0, 5 March 2003. Regier HA, Cowell EB (1972) Applications of ecosystem theory, succession, diversity, stability, stress and conservation. Biol. Conserv. 4: 83–88. Ribera MA, Gómez-Garreta A, Gallardo T, Cormaci M, Furnari G, Giaccone G (1992) Check-list of Mediterranean seaweeds. I. Fucophyceae. Bot. mar. 35: 109–130. Robledo D, Garcia O, Foster M, Hernandez-Carmona G (2000) Restoration techniques for Macrocystis pyrifera (Phaeophyceae) populations at the southern limit of their distribution in Mexico. Bot. mar. 43: 273–284. Schneider DC (1994) Quantitative Ecology: Spatial and Temporal Scaling. Academic Press, San Diego, California. Schramm W (1999) Factors influencing seaweed responses to eutrophication: some results from EU-project EUMAC. J. appl. Phycol. 11: 69–78. Simboura N, Zenetos A, Panayotidis P, Makra A (1995) Changes in benthic community structure along an environmental pollution gradient. Mar. Poll. Bull. 30: 470–474. Siokou-Frangou I (ed.) (2002) Monitoring of the Saronikos Gulf ecosystem 2002–2004. Hellenic (National) Center for Marine Research. Technical Report, 98 pp. Sousa WP (1980) The responses of a community to disturbance: the importance of successional age and species’ life histories. Oecologia 45: 72–81. Steneck RS, Watling L (1982) Feeding capabilities and limitation of herbivorous molluscs: A functional group approach. Mar. Biol. 68: 299–319. Verlaque M (1987) Contribution à l’étude du phytobenthos d’un écosystème photophile thermophile marin en Méditerranée Occidentale. Thèse Doctorat d’Etat-Sciences, Univ. Aix-Marseille II, Vol. 1 (text): 389 pp. Vol. 2 (illustrations and annex): 260 pp. Warwick RM, Clarke KR (1993) Comparing the severity of disturbance: a metaanalysis of marine macrobenthic community data. Mar. Ecol. Progr. Ser. 92: 221–231.