Transactions of the American Fisheries Society 137:1795–1811, 2008 Ó Copyright by the American Fisheries Society 2008 DOI: 10.1577/T08-033.1
[Article]
Use of Microsatellites to Determine Population Structure and Migration of Pacific Herring in British Columbia and Adjacent Regions T. D. BEACHAM,* J. F. SCHWEIGERT, C. MACCONNACHIE, K. D. LE,
AND
L. FLOSTRAND
Fisheries and Oceans Canada, Pacific Biological Station, Nanaimo, British Columbia V9T 6N7, Canada Abstract.—This study assessed genetic population structure of Pacific herring Clupea pallasii in British Columbia and adjacent regions by analyzing microsatellite variation; the utility of microsatellites for stock identification applications was also evaluated. Variation at 14 loci was surveyed in approximately 26,000 Pacific herring from 90 sampling locations. Estimates of the genetic differentiation index FST by locus varied between 0.000 and 0.014, and the mean across all loci was 0.003. Four stocks of Pacific herring were defined in British Columbia, and stocks were also identified in southeast Alaska, Washington, and California. In British Columbia, differences in timing of spawning are the main isolating mechanisms among stocks, although geographic isolation of the spawning populations may also have some effect in maintaining the genetic distinctiveness of each stock. The limited genetic differentiation among Pacific herring populations in British Columbia is consistent with among-population straying rates that are sufficient to homogenize allele frequencies over broad areas. Analysis of simulated mixtures from fishery sampling suggested that acceptable estimates of stock composition were achieved by use of the microsatellites. Mixed-stock samples (;1,700 individuals) were collected during research vessel surveys from 14 locations in British Columbia. Analysis of summer mixed-stock samples from the Strait of Georgia and adjacent waters indicated that resident fish on the west side of the strait were mainly derived from primary-spawning populations (i.e., those that spawned during the primary period in March) that failed to migrate to traditional summer feeding grounds. On the east side of the strait, Pacific herring of mainland inlet origin were found in higher proportions and presumably did not move in appreciable numbers to feeding areas off the west coast of Vancouver Island. In northern British Columbia, fish from northern late-spawning populations dominated fishery samples collected in waters adjacent to the mainland until the end of June; however, by late July, this group had been replaced almost entirely by primary-spawning Pacific herring of British Columbia origin.
Pacific herring Clupea pallasii are widely distributed across the Pacific Rim from Korea to California. In British Columbia, Pacific herring generally spawn from late February to July, but most spawning occurs in March and early April. Spawning typically occurs adjacent to the shoreline in large bays and inlets, but the precise spawning sites within a general location may change over time (Hay 1985). The eggs adhere to suitable substrates, and the larvae hatch within a few weeks after spawning. After several weeks of drifting in the water column, the larvae metamorphose into juvenile young of the year and reside in inshore waters. By summer, most of the newly spawned Pacific herring have moved from the spawning locations to the offshore feeding grounds distributed along the continental shelf; these Pacific herring are commonly referred to as migratory individuals. In late fall or early winter, most Pacific herring move to overwintering areas before migrating to actual spawning sites * Corresponding author:
[email protected] Received February 13, 2008; accepted June 4, 2008 Published online December 15, 2008
(Taylor 1964; Hay 1985). In some areas, such as the central coast of British Columbia, some percentage of the Pacific herring do not migrate to summer feeding grounds but instead reside in areas close to spawning sites (Stevenson 1946); such fish are commonly referred to as resident individuals. It is uncertain whether migratory and resident Pacific herring are genetically distinct. Delineation of population structure is fundamental to the assessment, conservation, and management of Pacific herring. Population structure of Pacific herring in British Columbia has been investigated with a variety of techniques. Early work centered on tagging (reviewed by Hay et al. 1999), and a large majority of Pacific herring returned to spawn in the region in which they were tagged (Hourston 1982). Spawning time and location were also thought to be important factors in delineating population structure (Haegele and Schweigert 1985). In British Columbia, Pacific herring are currently managed as five discrete stocks (Schweigert 2000). The main stocks are defined as occurring in the Strait of Georgia, the west coast of Vancouver Island, the central coast, the north coast, and the southeastern coast of the Queen Charlotte Islands. However, local
1795
1796
BEACHAM ET AL.
population structure has been an important issue raised in the management of Pacific herring in British Columbia, and it is believed that unique substocks or populations could exist within these five stocks, perhaps at the level of bays or inlets. The level of reproductive isolation, if any, among subcomponents or local populations is uncertain. If there are discrete genetic stocks, then genetic differences should be observable among stocks and repeatable over time, and individual fish should return to spawn in the same geographic area from which they originated. Genetic differentiation among spawning groups at neutral genetic loci indicates restricted gene flow among the groups and independent population dynamics and thus is an indicator of population structure. Moreover, if sufficient genetic differentiation is observed among populations, then genetic markers can be used to provide estimates of population or stock composition in areas of population mixing. This enables determination of stock-specific catch and subsequent estimation of exploitation rates, allowing managers to protect less-productive stocks from overexploitation in regions of mixing. Fidelity of spawning individuals to specific areas and low exchange of spawners among areas constitute basic requirements in the designation of a stock. The restriction of gene flow among spawning groups that results from this fidelity enables the development of genetic differentiation over time. For a marine fish, such as Pacific herring, a stock may consist of a single, large, randomly breeding aggregate or may be subdivided into smaller groups within which mating is random but among which the exchange of individuals is more limited. These local populations within a stock are more similar to each other than to populations in another stock complex. Analysis of genetic variation indicates whether gene flow is restricted among putative populations and whether the putative populations constitute genetically distinct spawning populations. It is obviously important for screening techniques to be able to detect genetic differentiation among putative populations should such differentiation exist. Previous analyses of genetic variation based on allozyme variation in eastern Pacific herring indicated that genetic differentiation was observed only over relatively large geographic areas, such as between fish from Asian and eastern Pacific regions, and perhaps within the eastern Pacific between the Gulf of Alaska and more-southerly areas (Grant and Utter 1984). Allozyme analyses of Pacific herring in the western Pacific Ocean indicated that genetic differentiation could occur on a more-localized basis (Kobayashi et al. 1990), similar to the local differentiation observed in Atlantic herring C. harengus
(Jorstad et al. 1994; Turan et al. 1998). Local differentiation in eastern Pacific herring was not indicated during a survey of mitochondrial DNA variation (Schweigert and Withler 1990) or during a study of ribosomal DNA sequence variation (Domanico et al. 1996). Analysis of variation at microsatellite DNA loci suggested that populations in the eastern Pacific Ocean exhibited more-local differentiation than was indicated by previous genetic techniques (O’Connell et al. 1998b), and similar results were reported for Atlantic herring (Shaw et al. 1999; McPherson et al. 2004; Hanne et al. 2005). Shaw et al. (1999) suggested that microsatellites uncover population genetic structuring that allozymes and mitochondrial DNA studies do not detect. Small et al. (2005), in an analysis of microsatellite variation, found differentiation in Puget Sound Pacific herring only in specific spawning locations within Washington, and differentiation was attributed to physical isolation of spawning locations or to a later timing of spawning. Genetic differentiation attributed to spawn timing differences has also been observed in Atlantic herring (McPherson et al. 2003), and both spawn timing and geographic separation provide the capability for estimation of stock composition in mixed-stock samples (Ruzzante et al. 2006). The objectives of the current study were primarily to (1) analyze variation at 14 microsatellite loci to evaluate population structure of Pacific herring in British Columbia and (2) to use genetic differentiation (if present) to estimate stock composition of mixedstock samples from various locations in British Columbia. The distribution of genetic diversity was compared among sampling years within populations, among populations within stocks, and among stocks to evaluate stability of stock structure; regional differences in allelic diversity were also evaluated. Stock composition evaluation was accomplished by the analysis of simulated mixed-stock fishery samples and actual fishery applications. Methods Collection of baseline DNA samples and laboratory analysis.—Samples were generally obtained from adult Pacific herring caught in test fisheries immediately prior to, during, or immediately after spawning from January to July of each year. A minor number of postspawn samples from northern British Columbia was collected from spawn-on-kelp fishery operations. In the test fisheries, Pacific herring maturity was determined by visual inspection of the gonads, and samples were collected from those fish classified as likely to spawn within a few days. The only exception to adult sampling was a juvenile sample that was collected in early June 1999 at Bute Inlet; this sample
PACIFIC HERRING POPULATION STRUCTURE
and a sample of resident adults (collected in June 2002) were used to characterize Pacific herring from the area. Samples were collected from 80 locations in British Columbia, 5 locations in southeast Alaska, 3 locations in Washington, and 2 locations in California; approximately 26,000 Pacific herring from these locations were scored at 14 microsatellite loci (Table 1; Figure 1). Samples were generally obtained by a crewed vessel equipped with either a gill net or purse seine to conduct test fishing at a particular location and were usually collected during March in the year of spawning. The Portage Inlet–Esquimault Harbor sample consisted of sport-caught Pacific herring from Victoria Harbor. Mixed-stock samples (;1,700 individuals) were also collected during research vessel surveys at 14 locations in British Columbia (Figure 2). Samples taken from research vessel surveys in the Strait of Georgia and adjacent areas during June (near Secret Cove and Deserted River) and October (French Creek) were well past the primary spawning season and thus were considered to be samples of resident Pacific herring. Extraction of DNA from the tissue samples was accomplished using a variety of methods, including a chelex resin protocol outlined by Small et al. (1998), a QIAGEN 96-well DNeasy procedure, or a Promega Wizard SV96 Genomic DNA Purification System procedure. Polymerase chain reaction products at 14 microsatellite loci (Cha63: O’Connell et al. 1998a; Cpa4, Cpa6, Cpa8, Cpa27, Cpa100, Cpa104, Cpa107, Cpa113, Cpa125, and Cpa134: Miller et al. 2001; Cpa103, Cpa107a, and Cpa114: Olsen et al. 2002) were initially size fractionated in denaturing polyacrylamide gels using an ABI 377 automated DNA sequencer (Applied Biosystems, Inc. [ABI], Foster City, California). Genotypes were then scored by ABI Genotyper 2.5 software using an internal lane sizing standard. Much later in the study, microsatellites were size fractionated in an ABI 3730 capillary DNA sequencer, and genotypes were scored by ABI GeneMapper 3.0 using an internal lane sizing standard. Allele identification was standardized between the two sequencers by analyzing the same subset of fish (;600 individuals) on both platforms and converting the sizing in the gel-based data set to match that obtained from the capillary-based set. Data analysis.—Each population was tested at each locus for departure from Hardy–Weinberg equilibrium (HWE; including heterozygote excess and deficiency) using Genetic Data Analysis (GDA) software (Lewis and Zaykin 2001). Critical significance levels were adjusted for simultaneous tests using the Bonferroni correction (0.05/90 ¼ 0.0006; Rice 1989). Weir and Cockerham’s (1984) genetic differentiation index (FST)
1797
was calculated for each locus over all populations by use of FSTAT version 2.9.3.2 (Goudet 1995The standard deviation of the FST estimate was determined by jackknifing over samples for an individual locus or by bootstrapping over loci for all loci combined. Tests of FST utilizing pairwise combinations between samples from Washington were conducted in GENEPOP (Raymond and Rousset 1995) with the Markovchain approach and chi-square (v2) probability values. The dememorization number was set at 1,000; 200 batches (2,000 iterations/batch) were run for each test. Cavalli-Sforza and Edwards’ (1967) chord distance (CSE) was used to estimate genetic distance between samples. An unrooted neighbor-joining dendrogram based upon CSE was generated in NJPLOT (Perriere and Gouy 1996). Bootstrap support for the major nodes in the tree was evaluated with the CONSENSE program of PHYLIP software (Felsenstein 1993) based upon 1,000 replicate trees. Allelic richness (allelic diversity standardized to a sample size of 321 fish) for each group of populations evaluated was determined in FSTAT. Computation of the number of alleles observed per locus was carried out in GDA, and allelic richness between groups was evaluated with Wilcoxon’s signed rank test. Hierarchical analyses of allele frequency variation within stocks were conducted in GDA using a nested random effects model. This analysis allowed testing (for each locus and for all loci combined) of the significance of stock effects relative to variance among populations within stocks and population effects relative to variance among sampling years within populations. Negative variance components were set to zero in the relative diversity analysis. The available samples allowed a comparison of mainland inlet populations (Wakeman Sound, Thompson Sound, Loughborough Inlet, and Bute Inlet), British Columbia primary-spawning populations (i.e., those that spawned during the primary period, generally March; Beaver Harbor, Kwakshua Channel, Kitasu Bay, Selwyn Inlet, and Section Cove), and northern late-spawning populations (Skidegate and Massett inlets) as putative stocks (Table 1). Balanced experimental designs were necessary for the variance component analysis; thus, at least two populations per stock and at least 2 years of samples per population were required. The selected British Columbia primary-spawning populations were chosen based on their adjacency to the mainland inlet and northern late-spawning populations that had been sampled for at least 2 years. Hierarchical analysis of allele frequency variation was also conducted among the southern late-spawning population (Portage Inlet) and the primary-spawning populations from Vancouver Island (Esperanza Inlet, Sydney Inlet, and Nootka
1798
BEACHAM ET AL.
TABLE 1.—Locations, sample collection dates, total number of fish analyzed (N) at 14 surveyed microsatellite loci, expected heterozygosity (He), and observed heterozygosity (Ho) of 90 Pacific herring populations within seven regional stocks (in bold) of southeast Alaska, British Columbia, Washington, and California. Number codes correspond to the locations illustrated in Figure 1. All samples were of adults except at Bute Inlet in June 1999, when juveniles were collected. N
He
Ho
93 462 193 93 426
0.89 0.88 0.87 0.88 0.88
0.87 0.87 0.86 0.87 0.87
27 Mar 1998, 7 Apr 1999, 30 Mar 2000 18 Mar 1998, 10 Mar 1999 29 Mar 1998, 14 Mar 1999, 4 Mar 2000, 6 Mar 2001 23 Mar 2000 17 Mar 2000 15 Mar 2001
398 418 636
0.88 0.88 0.88
0.86 0.85 0.87
158 166 113
0.87 0.87 0.84
0.88 0.86 0.84
20 Mar 1999, 19 Mar 2002, 17 Mar 1999, 12 Mar 2001, 23 Mar 2003 28 Mar 1998, 24 Mar 2001, 24 Mar 1999, 23 Mar 2002, 27 Feb 2002, 10 Mar 2003
24 Mar 2003 18 Mar 2002,
395 525
0.87 0.87
0.86 0.86
21 Mar 2002 26 Mar 2003
371 396 374
0.87 0.87 0.88
0.86 0.86 0.86
25 Mar 1999 25 Mar 1999 18 Mar 2000 25 Mar 1999, 21 Mar 2001 27 Mar 2000 26 Mar 2001 2 Apr 2002 8 Apr 2002, 4 Apr 2003
143 150 159 318 171 186 128 341
0.87 0.88 0.88 0.88 0.87 0.88 0.88 0.88
0.85 0.85 0.84 0.86 0.87 0.87 0.87 0.87
15 20 20 14 25 26 22 21 28 27 12 12 22
514 69 260 175 122 146 192 550 288 117 102 201 194
0.87 0.87 0.87 0.88 0.88 0.86 0.88 0.88 0.88 0.88 0.88 0.88 0.86
0.86 0.85 0.85 0.88 0.84 0.85 0.84 0.87 0.87 0.87 0.88 0.87 0.86
Apr 1999, 10 Apr 2002, 4 Apr 2003 26 Mar 2000
501 172
0.88 0.88
0.86 0.85
8 Mar 1997 4 Mar 1999 4 Mar 1999 4 Mar 1999 5 Mar 1999 3 Mar 2000 9 Mar 2000 2 Mar 2000 18 Mar 1999 7 Mar 2000 20 Mar 2000 15 Mar 1999 17 Mar 1999
95 150 118 261 260 137 171 66 236 127 149 164 166
0.87 0.87 0.88 0.87 0.88 0.86 0.87 0.84 0.88 0.86 0.87 0.87 0.88
0.84 0.85 0.85 0.85 0.87 0.86 0.86 0.86 0.85 0.85 0.86 0.86 0.84
Population
(1) (2) (3) (4) (5)
North Sitka South Sitka Kirk Point Mary Island Seymour Canal
Collection date Southeast Alaska spawners 18 Mar 2000 18 Mar 2000, 3 Mar 2001, 27 Mar 2002 3 Apr 2000, 4 May 2001 3 Apr 2000 5 Apr 2000, 5 May 2001, 9 May 2002 British Columbia primary spawners
Queen Charlotte Islands, east coast (6) Selwyn Inlet (7) Section Cove (8) Skincuttle Inlet (9) Haswell Bay (10) Skaat Harbor (11) Juan Perez Sound Queen Charlotte Islands, west coast (12) Rennell Sound (13) Port Louis (14) Inskip Channel (15) Kano Inlet (16) Louscoone Inlet North coast (17) Big Bay (18) Venn Passage (19) Tree Bluff (20) Gurd Point (21) Kitkatla Inlet (22) Ryan Point (23) Wilson Inlet (24) Hunt’s Inlet Central coast (25) Spiller Channel (26) Powell Anchorage (27) Dundivan Inlet (28) Gale Passage (29) Illahie Inlet (30) Pruth Anchorage (31) East Higgins (32) Kitasu Bay (33) Smith Inlet (34) Stryker Bay (35) Fairmile Passage (36) Kwakshua Channel (37) Kildidt Sound Queen Charlotte Sound (38) Beaver Harbor (39) Hardy Bay Strait of Georgia (40) Longbeak Point (41) Henry Bay (42) Norman Point (43) Whalebone Point (44) Bowser (45) Chrome Island (46) Komas Bluff (47) Fanny Bay (48) French Creek (49) Parksville Bay (50) Hammond Bay (51) Jessie Island (52) Link Island
Mar Mar Mar Mar Mar Mar Mar Mar Mar Mar Mar Mar Mar
1999, 1999 1999 2000 1999 1999 2000 2000, 1999, 1999 2001 2001, 2003
15 Mar 2000, 14 Mar 2001
12 Mar 2001, 22 Mar 2002 31 Mar 2000
20 Mar 2002
1799
PACIFIC HERRING POPULATION STRUCTURE
TABLE 1.—Continued. Population (53) Bargain Harbor (54) Secret Cove (55) Pender Harbor (56) Lambert Channel (57) Baynes Sound (58) Qualicum (59) Metcalf Bay (60) Sharpe Point (61) Saanich Inlet Vancouver Island, west coast (62) Winter Harbor (63) Klaskish Inlet (64) Nootka Sound (65) McKay Pass (66) Hesquiat Harbor (67) Sydney Inlet (68) Esperanza Inlet (69) Spilling Islet (70) Castle Rock (71) Bryant Islands (72) Forbes Island (73) Young Bay (74) Wakeman Sound (75) Thompson Sound (76) (77) (78) (79) (80) (81)
Loughborough Inlet Bute Inlet Knight Inlet Gikumi Point Rivers Inlet Goose Bay
(82) Skidegate Inlet (83) Masset Inlet (84) Metlakatla (85) Portage Inlet
N
He
Ho
7 Mar 1999 2 Mar 1999, 5 Mar 2003 3 Mar 2005 7 Mar 2001 3 Mar 2001 8 Mar 2001 16 Mar 2001 17 Mar 2002 16 Mar 2002
125 373 99 174 175 180 176 200 96
0.87 0.87 0.88 0.88 0.87 0.87 0.88 0.88 0.88
0.86 0.85 0.87 0.88 0.86 0.86 0.87 0.87 0.86
7 Mar 1999, 25 Mar 2001, 3 Mar 2002 6 Mar 1999, 2 Mar 2002 7 Mar 1999, 7 Mar 2000, 8 Mar 2001 18 Mar 1999 11 Mar 1999, 5 Mar 2001 24 Mar 1999, 3 Mar 2000 5 Mar 1999, 2 Mar 2000, 1 Mar 2001 5 Mar 1997 8 Mar 1999 9 Mar 1999 2 Mar 2000 15 Mar 2001
452 248 500 94 173 366 522 154 136 151 161 182
0.88 0.88 0.88 0.88 0.87 0.88 0.88 0.88 0.87 0.87 0.87 0.88
0.86 0.86 0.86 0.85 0.86 0.86 0.87 0.86 0.84 0.85 0.86 0.87
473
0.88
0.87
Collection date
Mainland inlet spawners 11 Mar 1999, 4 Mar 2001, 29 Mar 2002, 23 Mar 2003 11 Mar 1997, 25 Mar 1999, 9 Apr 2002, 22 Mar 2003 9 Mar 1997, 17 Mar 1999, 19 Mar 2003 22 Jun 1999, 18–20 Jun 2002, 3 Mar 2004 20 Mar 2003 3 Apr 2001 11 Mar 2001 13 Mar 2002, 20 Mar 2003
557
0.88
0.87
347 658 174 178 89 389
0.89 0.88 0.88 0.88 0.89 0.88
0.85 0.86 0.86 0.87 0.88 0.85
Northern British Columbia late spawners 15–18 Apr 1998, 7 May 1999, Jun 2002 Jun–Jul 2002, 26 Jun–4 Jul 2003 23 May 2002
395 388 179
0.87 0.87 0.87
0.84 0.86 0.85
390
0.86
0.84
Southern British Columbia late spawners 15 Mar 1999, 15 Mar 2001, 24–26 Mar 2002, 17 Mar–18 Apr 2003
(86) Cherry Point (87) Port Townsend (88) Skagit Bay
Washington spawners May 2000 28 Jan 2004 14 Feb 2004
164 100 99
0.87 0.88 0.89
0.86 0.88 0.86
(89) San Francisco Bay (90) Tomales Bay
California spawners 23 Jan 2001, 28 Jan 2002 Dec–Feb 2001, 22 Jan 2002
363 360
0.87 0.88
0.85 0.86
Sound). As only a single population was included in the southern late-spawning stock, the analysis only allowed for testing the significance of population effects relative to variance among sampling years within the population. From southeast Alaska, three populations were evaluated for differentiation relative to annual variation within populations: (1) Kirk Point and Mary Island samples, which were combined within years; (2) North Sitka and South Sitka samples, also combined within years; and (3) Seymour Canal. Sampling years within all populations are outlined in
Table 1. Allele frequencies for all location samples surveyed in this study are available from Fisheries and Oceans Canada (2008). Stock identification.—Genotypic frequencies were determined for each locus in each population, and the Statistical Package for the Analysis of Mixtures (SPAM) version 3.7 (Debevec et al. 2000) was used to estimate stock composition of simulated mixtures. The Rannala and Mountain (1997) correction to baseline allele frequencies was used in the analysis; this was done to avoid including in the simulated
1800
BEACHAM ET AL.
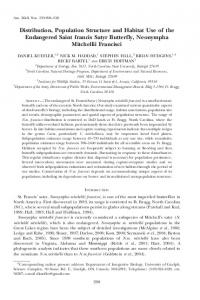
FIGURE 1.—Map of survey locations in British Columbia, Alaska, Washington, and California, where Pacific herring from 90 populations (codes defined in Table 1) were sampled for an analysis of genetic structure.
mixed-stock sample any fish with alleles that were absent from baseline samples drawn from that fish’s specific population. All loci were considered to be in HWE, and expected genotypic frequencies were determined from the observed allele frequencies. Stock composition for simulated fishery samples is reported as the bootstrap mean estimate for each analyzed mixture of 300 fish, and mean and variance estimates are derived from 100 bootstrap simulations. Each baseline population or simulated single-stock sample was sampled with replacement to simulate random
variation involved in the collection of the baseline samples and research vessel survey samples. Analysis of test fishery samples was conducted with a Bayesian procedure (cBAYES; Neaves et al. 2005). The BAYES (Pella and Masuda 2001) or cBAYES analyses required substantially more computer analytical time than did SPAM for analysis of an individual sample. Previous applications of SPAM and cBAYES to the same mixed-stock sample suggested that accuracy was greater when cBAYES was used (Beacham et al. 2005a; authors’ unpublished results).
PACIFIC HERRING POPULATION STRUCTURE
1801
FIGURE 2.—Map of locations in British Columbia where Pacific herring samples were obtained from research fisheries during 2001–2006 for an analysis of genetic structure.
Therefore, cBAYES was used in the estimation of stock composition from actual fishery samples. In the analysis, 10 Monte Carlo Markov chains (20,000 iterations/chain) of estimated stock composition were produced; initial starting value for each chain was set at 0.90 for a particular population, which was different for each chain. Estimated stock compositions were considered to have converged when the shrink factor was less than 1.2 for the 10 chains (Pella and Masuda 2001); therefore, the starting values were considered to be irrelevant. Stock composition estimates converged before 20,000 iterations, and no further improvement in the estimates was observed when more than 20,000 iterations were used. Therefore, 20,000 iterations were set as the standard in the analysis. The last 1,000 iterations from each of the 10 chains were then combined, and each fish’s probability of originating from each population in the baseline was determined. These individual probabilities were summed over all
fish in the sample, and the result was divided by the number of fish sampled to provide the point estimate of stock composition. Standard deviations of estimated stock composition were determined based on the last 1,000 iterations from each chain. Results Variation within and among Populations All microsatellite loci surveyed were highly polymorphic. The number of alleles per locus ranged from 28 at Cpa4 to 63 at Cpa104, and the average was 41 (Table 2). Expected heterozygosity estimates were very similar among sampling sites and ranged from 0.84 to 0.89 (Table 1). Genotypic frequencies at each locus within sampling sites generally conformed to HWE expectations; the greatest number of deviations was observed at Cpa8. Conformance to HWE expectations indicates that null or nonamplifying alleles were generally not detected at the surveyed loci and that
1802
BEACHAM ET AL.
TABLE 2.—Number of alleles per locus, expected heterozygosity (He), observed heterozygosity (Ho), percentage of tests indicating significant deviation from Hardy–Weinberg equilibrium (HWE; N ¼ 90 tests), and mean (SD in parentheses) genetic differentiation index (FST) for 14 microsatellite loci surveyed in 90 Pacific herring populations (Table 1). Locus
Alleles
He
Ho
HWE
Cpa4 Cpa6 Cpa8 Cpa27 Cha63 Cpa100 Cpa103 Cpa104 Cpa107 Cpa107a Cha113 Cpa114 Cpa125 Cpa134 All loci
28 29 49 31 37 49 33 63 37 42 33 31 52 55 41
0.91 0.71 0.92 0.74 0.90 0.92 0.89 0.96 0.88 0.83 0.87 0.89 0.95 0.91
0.90 0.68 0.84 0.72 0.90 0.90 0.87 0.97 0.87 0.79 0.86 0.88 0.94 0.89
1.1 2.2 6.7 1.1 0.0 1.1 1.1 2.2 1.1 2.2 0.0 1.1 4.4 1.1
the samples were composed of single genetic populations. The mean FST value over the 90 samples and 14 loci surveyed was 0.003, indicative of only limited differentiation among populations at these loci (Table 2). Genetic diversity varied little among regional groups of Pacific herring. Fish from Portage Inlet (southern late-spawning stock) displayed the fewest number of alleles and those from the mainland inlets of British Columbia exhibited the greatest number of alleles, but the difference in observed number of alleles was only about 3% and was not significant (P . 0.05; Table 3). In general, although a fairly wide geographic range of populations was included in the survey, allele frequency variation and observed number of alleles
FST 0.001 0.003 0.000 0.014 0.002 0.001 0.001 0.002 0.012 0.007 0.000 0.001 0.001 0.001 0.003
(0.001) (0.001) (0.000) (0.004) (0.000) (0.000) (0.001) (0.001) (0.005) (0.002) (0.000) (0.000) (0.000) (0.000) (0.001)
indicated very modest differentiation among regional groups of Pacific herring. Population Structure In pairwise comparisons across all 90 populations, California populations were genetically distinct from populations in all other regions or stocks and mean FST was typically greater than 0.01 (Table 4). On average, Washington populations were also distinct from those in other regions, particularly those in British Columbia. Northern late-spawning populations and the southern late-spawning population (Portage Inlet) were also genetically distinct from all other stocks (Table 4). Moderate values of FST were observed between populations in Alaska and British Columbia.
TABLE 3.—Mean number of observed alleles per locus at 14 microsatellite loci examined in 90 Pacific herring populations (Table 1) from seven regional stocks: (1) British Columbia (BC) mainland inlet spawners, (2) BC primary spawners (i.e., those that spawned during the primary period, generally March), (3) southern BC late spawners, (4) northern BC late spawners, (5) Washington spawners, (6) southern Alaska spawners, and (7) California spawners. Allele numbers were standardized to a sample size of 321 fish/region. Region Locus
1
2
3
4
5
6
7
Cpa4 Cpa8 Cpa6 Cpa27 Cpa63 Cpa100 Cpa104 Cpa107 Cpa113 Cpa125 Cpa134 Cpa107a Cpa103 Cpa114 Total
19.8 32.6 20.2 15.5 25.7 32.7 45.5 25.5 21.3 39.4 35.5 19.0 22.2 21.5 376.4
19.9 28.3 19.8 17.1 25.4 32.9 44.8 24.0 21.5 39.1 35.3 18.9 21.6 20.6 369.2
19.8 27.4 19.8 16.2 25.2 32.1 43.9 24.8 20.9 38.9 33.3 18.1 21.8 22.0 364.2
20.1 28.3 20.4 15.1 25.0 32.7 41.8 27.4 21.0 39.9 37.4 20.0 21.5 21.4 372.0
20.5 27.5 19.7 14.8 24.8 32.6 42.6 26.4 20.5 38.8 33.3 25.8 23.7 21.6 372.6
19.7 29.9 19.2 16.9 25.7 33.0 46.2 25.3 21.9 39.2 35.6 17.2 21.8 19.1 370.7
20.4 30.1 19.2 17.5 24.7 32.1 41.8 26.0 21.6 37.9 32.6 19.5 21.1 20.1 364.6
1803
PACIFIC HERRING POPULATION STRUCTURE
TABLE 4.—Mean pairwise values of the genetic differentiation index (FST) calculated from 14 microsatellite loci in 90 herring populations (Table 1) from seven regional stocks: (1) British Columbia (BC) mainland inlet spawners, (2) BC primary spawners (i.e., those that spawned during the primary period, generally March), (3) southern BC late spawners, (4) northern BC late spawners, (5) Washington spawners, (6) southern Alaska spawners, and (7) California spawners. Bold FST values indicate significant differences (P , 0.05). Region
1
2
3
4
5
6
7
1 2 3 4 5 6 7
0.001
0.003 0.001
0.023 0.025 -
0.006 0.004 0.027 0.003
0.004 0.003 0.018 0.005 0.002
0.002 0.002 0.024 0.005 0.003 0.001
0.012 0.011 0.022 0.010 0.009 0.011 0.000
Some structuring of samples based on region and spawn timing was observed in our study. Latespawning populations from Skidegate Inlet, Masset Inlet, and Metlakatla in northern British Columbia clustered together, and bootstrap support was 80% (Figure 3). The only geographically based clustering of population samples in British Columbia consisted of mainland inlet spawners from the southern central coast and Johnstone Strait. These geographically discrete population samples clustered together with a bootstrap support of 64%. The cluster analysis was notable for the general lack of well-defined clusters based upon geographic discreteness. In particular, Pacific herring population samples from the Queen Charlotte Islands did not form a discrete cluster, and the same was true of samples from Vancouver Island. This general lack of geographic structure in British Columbia was reflected in the very modest FST value of 0.003 noted previously. Pacific herring spawning in Esquimault Harbor at the extreme southern end of Vancouver Island move to Portage Inlet, where they were sampled prior to and just after spawning. This population was the most distinct population included in the survey and was well differentiated from other populations spawning in British Columbia. Outside of British Columbia, some geographic structuring of populations was observed; spawners in Tomales and San Francisco bays in California formed a distinct cluster with 99% bootstrap support. Washington population samples were generally distinct from those sampled in British Columbia. Populations sampled in southeast Alaska tended to cluster together (Figure 3). Structure among Stocks In British Columbia, four genetically distinct stocks of Pacific herring were observed in the survey. These included the smaller, late-spawning stock in northern British Columbia; the unique Portage Inlet stock; the mainland inlet spawning stock of the southern central
coast and Johnstone Strait; and the large, geographically dispersed primary-spawning stock in southern and northern British Columbia outside of the mainland inlets. If there are genetically discrete stocks, then genetic differences should be observable among stocks and consistent over time, as indicated in a gene diversity analysis. In a comparison of the northern late-spawning stock, mainland inlet stock, and primary-spawning British Columbia stock, allele frequency variation among stocks was greater than annual variation within spawning populations. Significant among-stock allele frequency variation was observed at 4 of the 14 loci surveyed (P , 0.05), and the greatest differentiation was observed at Cpa27 (Table 5, analysis 1). Annual variation in allele frequency within populations was approximately equivalent to the differences among populations within stocks, indicating a lack of consistent population differentiation. However, among-stock genetic differentiation was pronounced and stable over the time frame surveyed; allele frequency variation among stocks was approximately five times greater than the annual variation within populations. Among the Portage Inlet population and three Vancouver Island populations (Table 5, analysis 2), population differentiation was clearly evident: among-population allele frequency differed significantly from annual variation within populations at 6 of the 14 loci surveyed (P , 0.05). Differences among populations were eight times greater than annual variation within populations; the greatest differentiation was observed at Cpa27 and Cpa107. When the Portage Inlet population was removed from the genetic diversity analysis, no significant differentiation was observed among the three Vancouver Island populations (P . 0.05), indicating that the observed differentiation in the prior analysis was due entirely to the distinctive nature of the Portage Inlet population. Little differentiation was observed among local Pacific herring populations surveyed outside of British
1804
BEACHAM ET AL.
FIGURE 3.—Unrooted neighbor-joining dendrogram of Cavalli-Sforza and Edwards’ (1967) chord distances calculated for 90 Pacific herring populations (described in Table 1) that were surveyed at 14 microsatellite loci. The bootstrap value at each major node indicates the percentage of 1,000 dendrograms in which populations beyond the node clustered together. Regional spawning groups are indicated: British Columbia (BC) mainland inlet spawners, BC primary spawners (i.e., those that spawned during the primary period, generally March), southern BC late spawners, northern BC late spawners, and spawners from Washington, southern Alaska, and California.
Columbia. For example, no significant differentiation was observed between populations from San Francisco and Tomales bays (P . 0.05), as annual variation in allele frequency was as great as the differentiation between the two populations. Only single samples were surveyed for the three Washington populations;
therefore, it was not possible to evaluate allele frequency differentiation among populations relative to annual variation within populations. With this limitation, significant differentiation was observed between the Cherry Point population and the Port Townsend and Skagit Bay populations (P , 0.01), but
1805
PACIFIC HERRING POPULATION STRUCTURE
TABLE 5.—Results of hierarchical gene diversity analyses of Pacific herring surveyed at 14 microsatellite loci, indicating the level of allele frequency variation within populations (pops), among sampling years within populations, among populations within stocks, and among stocks (*P , 0.05; **P , 0.01). Analysis 1 examined three putative British Columbia (BC) stocks: (1) mainland inlet spawners (Wakeman Sound, Thompson Sound, Loughborough Inlet, and Bute Inlet populations), primary spawners (i.e., those that spawned during the primary period, generally March; Beaver Harbor, Kwakshua Channel, Kitasu Bay, Selwyn Inlet, and Section Cove populations), and northern late spawners (Skidegate Inlet and Massett Inlet populations). Analysis 2 examined southern BC late spawners (Portage Inlet population) and Vancouver Island primary spawners (Esperanza Inlet, Sydney Inlet, and Nootka Sound populations). Analysis 1
Analysis 2
Locus
Within pops
Among years within pops
Among pops within stocks
Among stocks
Within pops
Among years within pops
Among pops
Cpa4 Cpa6 Cpa8 Cpa27 Cha63 Cpa100 Cpa103 Cpa104 Cpa107 Cpa107a Cha113 Cpa114 Cpa125 Cpa134 All
0.9987 0.9965 0.9992 0.9740 0.9972 0.9991 0.9994 0.9974 0.9931 0.9968 0.9998 0.9989 0.9996 0.9995 0.9967
0.0011 0.0011 0.0008 0.0012 0.0009 0.0000 0.0002 0.0000 0.0008 0.0009 0.0000 0.0011 0.0002 0.0002 0.0005
0.0000 0.0024* 0.0000 0.0022* 0.0002 0.0002 0.0000 0.0005 0.0001 0.0009 0.0002 0.0000 0.0000 0.0001 0.0004
0.0002 0.0000 0.0000 0.0226** 0.0017* 0.0007 0.0004 0.0021* 0.0060** 0.0014 0.0000 0.0000 0.0002 0.0002 0.0024*
0.9906 0.9969 0.9988 0.9561 0.9974 0.9972 0.9975 0.9917 0.9267 0.9887 0.9991 0.9969 0.9946 0.9992 0.9882
0.0002 0.0008 0.0000 0.0007 0.0000 0.0002 0.0005 0.0005 0.0006 0.0006 0.0001 0.0015 0.0000 0.0000 0.0003
0.0092** 0.0023 0.0012 0.0432** 0.0026 0.0026 0.0020 0.0078* 0.0727** 0.0107** 0.0008 0.0016 0.0054* 0.0008 0.0115**
no significant difference was observed between the latter two populations (P . 0.05). The three southeast Alaska populations showed no significant differentiation relative to annual variation in allele frequency within populations (P . 0.05). Stock Identification Genetic differentiation observed among seven Pacific herring stocks was evaluated to determine whether it was sufficient to allow accurate estimation of stock composition in mixed-stock analysis. Analysis of
single-stock samples indicated that regional estimates of stock composition were variable, ranging from 67% to 98% (Table 6); it was expected that errors in estimation of a given regional stock would be maximized when fish from that single region made up 100% of the simulated sample. Poorest resolution was achieved when the simulated mixture contained only Pacific herring of southeast Alaska or Washington origin. The level of accuracy observed for British Columbia and California stocks indicated that accurate
TABLE 6.—Mean (SD in parentheses) estimated composition (%) of simulated single-region mixtures calculated from 14 microsatellite loci in Pacific herring of seven regional stocks (BC ¼ British Columbia; primary spawners ¼ fish that spawned during the primary period in March). Regional estimates (correct ¼ 100%) include percentages allocated to all populations within the regional stock; each regional mixture contained two populations at 50% each (except for the southern BC late spawners, which contained only the Portage Inlet population). Simulations were conducted with a 90-population baseline (Table 1), 300 fish in the mixture sample, and 100 resamplings in the mixture sample and baseline samples. Mixture
Regional stock
Regional estimate
Population
1
Southeast Alaska spawners
69.9 (5.7)
2
BC primary spawners
94.0 (3.0)
3 4
Southern BC late spawners Northern BC late spawners
97.8 (1.0) 86.3 (2.9)
5
Mainland Inlet spawners
85.3 (3.5)
6
Washington spawners
66.9 (4.3)
7
California spawners
96.0 (1.3)
South Sitka Island Seymour Canal Skincuttle Inlet Esperanza Inlet Portage Inlet Skidegate Inlet Masset Inlet Knight Inlet Thompson Sound Port Townsend Cherry Point San Francisco Bay Tomales Bay
Population estimate 32.8 36.1 29.1 31.5 97.8 41.3 43.8 30.8 40.2 30.2 36.5 46.6 49.4
(5.4) (4.8) (5.8) (4.9) (1.0) (4.3) (3.8) (3.5) (4.9) (3.5) (3.9) (4.2) (4.2)
1806
BEACHAM ET AL.
TABLE 7.—Mean (SD in parentheses) estimated regional stock composition (%) of Pacific herring simulated mixtures representing typical mixed-population samples from British Columbia (BC) mixed-stock fisheries. Each mixture of 300 fish was generated 100 times from baseline allele frequencies of 14 microsatellite loci, and the stock composition of the mixture was estimated with parametric resampling of each of 90 baseline populations (Table 1) to obtain a new allele frequency distribution at each iteration. Mixture 1 was made up of the following populations: Beaver Harbor (20%), Hardy Bay (20%), Stryker Bay (20%), Loughborough Inlet (20%), and Thompson Sound (20%). Mixture 2 was composed of Bowser (25%), Henry Bay (15%), Klaskish Inlet (15%), Sydney Inlet (15%), Thompson Sound (10%), Port Townsend (10%), and Portage Inlet (10%) populations. Mixture 3 contained Rivers Inlet (10%), Section Cove (20%), Haswell Bay (10%), Rennell Sound (20%), Tree Bluff (20%), Skidegate Inlet (10%), and Seymour Canal (10%) populations. Mixture and regional stock Mixture 1 Mainland inlet spawners BC primary spawners Mixture 2 Mainland inlet spawners BC primary time spawners Southern late spawners Washington spawners Mixture 3 Mainland inlet spawners BC primary spawners Northern late spawners Southeast Alaska
True value
Estimate
40 60
35.5 (4.7) 60.9 (4.6)
10 70 10 10
11.0 71.5 9.5 5.1
(3.1) (3.9) (1.7) (1.7)
10 70 10 10
11.3 69.9 8.3 10.0
(3.5) (5.0) (2.3) (4.4)
primary-spawning fish was within about 4% of the actual composition for each stock (Table 7, mixture 1). A more-complex simulated mixture containing four stocks, such as might be found in southern British Columbia waters, was estimated to be within 2% of actual stock composition for three of the four stocks; the Washington component was underestimated by a larger degree (Table 7, mixture 2). A final simulated mixture as may be found in northern British Columbia waters was estimated within 2% for all four stocks comprising the mixture (Table 7, mixture 3). Reasonably accurate estimates of Pacific herring stock composition should be obtained when the current baseline is applied to mixed-stock fishery samples from British Columbia, under the expectation that most individuals in the mixture originate from Canadian populations. Stock composition was determined for mixed-stock samples from a range of locations in British Columbia. In the Strait of Georgia and adjacent waters, three samples of Pacific herring were evaluated. A sample of resident Pacific herring collected near French Creek (off the east coast of Vancouver Island) in early October 2006 was estimated to consist of over 90% primary-spawning fish from British Columbia (Table 8). Thus, resident Pacific herring in this case were primary spawners that apparently failed to migrate to summer feeding grounds off the west coast of Vancouver Island. Primary-spawning British Columbia Pacific herring were estimated to make up 64% of an early June sample collected near Secret Cove on the mainland side of the Strait of Georgia, and mainland inlet Pacific herring contributed 23% of the sample. Washington Pacific herring were estimated to constitute 9% of the sample, but none were from the latespawning Cherry Point population. A mid-June sample
stock composition estimates can be generated for samples containing individuals from these regions. Testing of the accuracy of regional stock composition estimates for multiregion mixtures was conducted by evaluating three simulated fishery samples. Estimated stock composition of a simulated mixture containing only mainland inlet and British Columbia
TABLE 8.—Mean (SD in parentheses) estimated stock composition (%) of Pacific herring (N ¼ number of fish) collected from 14 research fishery sampling locations in British Columbia (BC; Figure 2). Regional stocks are BC primary spawners (BCP), mainland inlet spawners (main), northern late spawners (NL), Washington spawners (Wash), and southeast Alaska spawners (SAK). A 90-population baseline (Table 1) was used in the analysis. Location
Date
N
French Creek Secret Cove Deserted River Swiftsure Bank Forty Mile Bank Rathole Goose Island Bank Hecate Strait Butterworth Rocks Duncan Bay White Rocks Rose Spit Browning Entrance Houston–Stewart Channel
3 Oct 2006 4 Jun 2002 11 Jun 2002 4 Aug 2002 5 Aug 2002 6 Aug 2002 31 Jul 2003 2 Jun 2001 15 Jun 2002 31 May 2004 19 Jun 2002 28 Jul 2003 26 Jul 2003 30 Jul 2003
100 198 198 100 100 100 100 199 100 75 96 100 100 100
BCP 90.4 63.9 13.8 83.9 95.6 91.9 97.5 13.4 7.3 24.0 43.2 52.2 95.4 92.2
(8.9) (9.7) (7.5) (11.6) (6.2) (11.4) (4.3) (4.8) (5.5) (13.6) (11.4) (12.1) (7.4) (10.1)
Main 5.8 22.6 84.3 0.9 0.6 0.8 1.2 0.3 5.4 6.1 4.4 2.2 0.7 3.0
(7.5) (8.9) (7.5) (2.7) (1.9) (2.6) (3.0) (0.9) (5.0) (8.2) (6.9) (5.3) (2.5) (7.1)
NL 0.8 0.3 1.3 0.1 0.1 0.2 0.1 84.6 85.9 66.6 47.3 34.8 1.5 1.6
(2.0) (1.2) (3.2) (0.6) (0.7) (1.1) (0.6) (4.5) (5.6) (10.8) (9.3) (7.2) (4.1) (4.4)
Wash 1.7 9.4 0.3 14.4 3.1 0.4 0.3 0.7 0.4 0.5 3.9 2.2 0.4 2.3
(4.1) (6.9) (1.1) (11.3) (5.5) (1.7) (1.4) (1.8) (1.5) (1.9) (7.4) (4.6) (2.1) (5.8)
SAK 1.3 3.8 0.4 0.6 0.4 6.8 0.8 1.0 1.0 2.6 1.1 7.8 2.0 0.8
(3.7) (7.1) (1.3) (2.4) (1.9) (11.2) (2.7) (2.3) (2.5) (5.8) (3.9) (10.7) (5.6) (2.7)
PACIFIC HERRING POPULATION STRUCTURE
collected near Deserted River in Jervis Inlet was estimated as primarily containing mainland inlet Pacific herring (84%), and the remainder was mostly of British Columbia primary-spawning origin (Table 8). Mainland inlet Pacific herring were more prevalent on the east side of the Strait of Georgia near the mainland, particularly in the mainland inlets, as would be expected. Samples collected off the southwest coast of Vancouver Island in August were dominated, as expected, by primary spawners from British Columbia; this stock made up 84–96% of the Pacific herring sampled from three locations (Table 8). The sample from Swiftsure Bank had the highest component of Pacific herring from Washington (14%), but none was estimated to originate from the Cherry Point population. A single sample was obtained during late July in a central coast survey near Goose Island Bank, and virtually all fish in the sample were estimated to be British Columbia primary spawners. The remaining samples evaluated were all obtained from research surveys in northern British Columbia. The northern late-spawning British Columbia stock was estimated to constitute 47–86% of the samples taken from fisheries prior to the end of June. Samples taken in late July were estimated to consist mostly of primary spawners from British Columbia (Table 8), indicating that the late spawners had moved from the areas adjacent to the mainland. Late spawners were detected in appreciable relative abundance (35%) in a late-July sample taken near Rose Spit off the northeast coast of the Queen Charlotte Islands, and this area may serve as a summer feeding ground for late spawners. Discussion Population Structure High levels of genetic diversity were observed in the Pacific herring samples surveyed in our study. The observed average heterozygosity over 14 loci was 0.86, which is very similar to that of other microsatellite loci surveyed in Pacific herring by O’Connell et al. (1998b) and Small et al. (2005) and is comparable to microsatellite variation in Atlantic herring (Shaw et al. 1999). There was no reduction in heterozygosity that would indicate a recent population bottleneck at any sampling site. Although population sizes of Pacific herring in British Columbia declined to low levels during the 1960s (Hourston 1980), these declines were not extensive enough to substantially reduce heterozygosity or number of alleles per locus. The average FST value of 0.003 observed in Pacific herring was less than the 0.005 value observed in the anadromous, semelparous eulachon Thaleichthys pacificus (Beacham et al. 2005b); this suggests either (1) that the tendency to
1807
home to natal areas is weaker in Pacific herring (marine natal areas) than in eulachon (freshwater natal areas) or (2) that the long-term effective population size is larger and the rate of genetic drift is lower in Pacific herring than in eulachon. Within the five currently managed stocks of Pacific herring in British Columbia, there is little evidence for genetically discrete populations spawning in different bays (Beacham et al. 2002). In particular, along the east coast of the Queen Charlotte Islands, there was no evidence of genetic differentiation among spawners in Selwyn Inlet, Section Cove, Skincuttle Inlet, or Skaat Harbor, as the largest pairwise FST value from these locations was 0.0004. In the Strait of Georgia, Pacific herring spawning in Esquimault Harbor were clearly distinct from spawners in more-northerly areas along the east coast of Vancouver Island. If a goal of management is to include genetically undifferentiated populations within a management area, then the southwestern boundary of the Strait of Georgia management area should be evaluated. Pacific herring that spawn later in the year at Metlakatla are currently included in the north coast management area, and they spawn in locations very similar to those of the much more prevalent primary-spawning stock. For local population differentiation to occur, Pacific herring must home to their particular spawning area and must be isolated from other spawners through differences in spawn timing or spawning location. Differences in spawn timing may have led to some genetically discrete local populations of Pacific herring. Fish in Skidegate and Masset inlets on the Queen Charlotte Islands and Metlakatla on the north coast spawn later than those in other locations sampled in British Columbia, and this later spawn timing has provided enough reproductive isolation for genetic differentiation to occur. Farther south, Pacific herring at Cherry Point, Washington, spawn approximately 2 months after spawning typically begins in the Strait of Georgia or Puget Sound. This difference in spawn timing has probably led to the observed genetic differentiation between Cherry Point Pacific herring and fish from the Strait of Georgia and Puget Sound. Similar genetic differentiation between Cherry Point Pacific herring and other populations spawning in Puget Sound has also been reported by Small et al. (2005). Geographic isolation may have also led to differentiation of local populations. Prior to and just after spawning, Pacific herring that spawn in Esquimault Harbor at the extreme southern end of Vancouver Island move into Portage Inlet (where the samples were collected). Because spawner distribution in this area is restricted, geographic isolation of the spawning population and the somewhat later timing of spawning
1808
BEACHAM ET AL.
may have led to differentiation of the local population. Portage Inlet–Esquimault Harbor Pacific herring spawn in late March, later than Pacific herring in most other locations in the Strait of Georgia; thus, both geographic isolation and differences in spawn timing may be acting to maintain the distinctiveness of this population. Differentiation was observed between Pacific herring that spawned in mainland inlets and adjacent areas and those that spawned in more-seaward locations along the central coast and Johnstone Strait. Pacific herring in British Columbia are characterized by both migratory and resident life history types; migratory Pacific herring spawn in coastal areas and move to offshore summer feeding grounds. Resident Pacific herring are thought to remain close to their natal areas throughout life. The observed genetic differentiation may therefore reflect life history variation in which resident Pacific herring spawn in mainland inlets and adjacent areas and migratory Pacific herring spawn in more-seaward areas. Juvenile Pacific herring that feed in more-proximate coastal locations during summer should be examined to determine whether mainland inlet spawning populations are represented among them. In the single sample analyzed from resident Pacific herring in the Strait of Georgia, virtually all fish were estimated to belong to the primary-spawning stock. Pacific herring in different geographic areas of British Columbia are typically characterized by minimal genetic differentiation when fish with similar spawning times are compared. Minimal differentiation between putative stocks can occur even if gene flow among stocks is restricted; this will be the case if the stocks have only recently diverged and not enough time has passed since divergence to allow for sufficient genetic drift and, in turn, stock differentiation. Alternatively, significant gene flow among putative stocks can lead to homogenization of allele frequencies even if the putative stocks have been separated for thousands of years. In British Columbia, tagging data indicated that homing to management areas was about 85% (Hourston 1982). Additional analyses of all tagged Pacific herring indicated that homing ranged from 53% (for fish released from Johnstone Strait) to 97% (for fish released off the west coast of Vancouver Island; Hay et al. 1999). However, among tagged fish that were released from one region and that were at large for 1 year or longer, recoveries were usually made in each of the other five regions in addition to the tagging region. If the migrants are successful at reproducing, these levels of gene flow will lead to homogenization of allele frequencies and are the most likely explanation for the minimal genetic differentia-
tion among Pacific herring from disparate areas in British Columbia. There is straying among Pacific herring populations in British Columbia, but the levels of straying may not be sufficient to offset overexploitation of the species in specific regions. Therefore, exploitation of Pacific herring should continue to be distributed geographically in British Columbia to ensure maintenance of diversity that might not have been detected in our survey of microsatellite loci. Genetic structuring of populations has been reported for Pacific herring in Alaska (O’Connell et al. 1998b) and for Atlantic herring in Norwegian waters and the Barents Sea (Shaw et al. 1999). Both studies were based on microsatellite surveys where only 1 year of samples was analyzed, and conclusions about population structure were made without an available measure of within-population variation. Small et al. (2005) demonstrated that differentiation of two local populations in Washington was consistent over intervals of 2– 4 years, providing greater confidence that biologically meaningful differentiation was observed. Demonstration that population differentiation is persistent over time increases the likelihood that the appropriate population structure has been elucidated (Waples 1998). Divergent views have been expressed on population structure of Atlantic herring. In one case, discrete Atlantic herring populations were thought to exist, and larval retention in the spawning area and general homing to the natal area were believed to be the mechanisms maintaining population distinctiveness (Iles and Sinclair 1982). Conversely, Smith and Jamieson (1986) suggested that Atlantic herring populations fluctuate in size and occupied range and that straying among spawning populations does not result in distinct local populations. Alternatively, McQuinn (1997) suggested that Atlantic herring exhibit metapopulation structure wherein local population discreteness is maintained by homing to initial spawning areas (not necessarily natal spawning areas), while new recruits to a population learn migration patterns and spawning areas from existing spawners in the population. Although genetically distinct local populations of Pacific herring exist in British Columbia, they are the exception and differences in spawn timing constitute the main isolating mechanism. In the distinct populations, discreteness is maintained by homing to natal spawning grounds and a low straying rate due to the low number of fish spawning concurrently in areas adjacent to these populations. However, for most populations in British Columbia, spawning occurs in March and straying is probably sufficient to prevent the development of genetic distinctiveness in most areas.
PACIFIC HERRING POPULATION STRUCTURE
Stock Identification Given the lower level of genetic differentiation in Pacific herring than in salmonids (to which genetic stock identification is routinely applied), lower resolution of Pacific herring stock composition is to be expected. Four stocks of Pacific herring in British Columbia, as well as regional stocks in southeast Alaska, Washington, and California, were defined on the basis of microsatellite variation. Analysis of simulated single-stock and multistock fishery samples indicated that acceptable regional estimates of stock composition will be obtained when microsatellite variation is applied to estimate the composition of mixed-stock samples in British Columbia, where British Columbia populations would be expected to constitute the large majority of sampled fish. During the annual life cycle, Pacific herring migrate between spawning locations and summer feeding areas; this migration typically occurs very rapidly after spring spawning (Hay 1985). Fish that spawn at the heads of inlets are thought to migrate the relatively short distance to the inlet mouth to feed, whereas fish that spawn in more-exposed coastal areas are believed to migrate to continental shelf feeding sites. Tagging studies indicate that after spawning along the mainland shore and the east coast of Vancouver Island in the Strait of Georgia, Pacific herring typically migrate to summer feeding areas located off the west coast of Vancouver Island (Taylor 1964). However, some Pacific herring apparently remain as residents in the Strait of Georgia during the summer, and the origin of these fish has been of some assessment interest. Analysis of mixed-stock samples from the Strait of Georgia and adjacent waters indicated that resident fish on the west side of the strait were mainly derived from primary-spawning populations that failed to migrate to traditional summer feeding grounds. On the east side of the strait, Pacific herring of mainland inlet origin increased in abundance and presumably did not move in appreciable numbers to feeding areas off the west coast of Vancouver Island. Pacific herring found off the west coast of Vancouver Island in the summer were dominated by the British Columbia primary-spawning stock, as would be expected. Southern late-spawning fish were not detected in any fishery samples in southern British Columbia, but this was expected given the modest abundance of this population. In northern British Columbia, the timing of spawning appears to be more variable and summer feeding areas are not clearly defined, although Hecate Strait and Dixon Entrance along the Alaska border are the most likely locations. The mixed-stock samples only partially clarified the situation. Northern late-spawning fish dominated
1809
research survey samples from waters in northern Hecate Strait until the end of June, suggesting a transition from spawning to feeding areas. By late July, a mixture of late- and primary-spawning fish was observed in the northern portion of Hecate Strait, whereas samples in the south were mostly made up of primary spawners. Although the data are limited, they suggest a possible spatial segregation in feeding locations for these two spawning groups. Management Implications Virtually the entire Pacific herring fishery in British Columbia is focused on spring roe; because this fishery occurs on or near the spawning grounds just prior to spawning, there are no stock composition considerations in its management. However, periodic interest in bait fisheries for juvenile Pacific herring (i.e., to supply bait for the recreational salmon fishery) creates the potential for mixed-stock fisheries. Siting and timing of the bait fisheries could influence exploitation rates for specific stocks. For example, summer bait fisheries near the Queen Charlotte Islands would be more likely to exploit the northern late-spawning stock than would similar fisheries conducted adjacent to the mainland. If reducing exploitation rate of this stock is a management objective, then fishery managers have some flexibility in scheduling bait fisheries in the appropriate time and location. Acknowledgments Extensive amounts of support and communication were behind the acquisition of Pacific herring samples. Most samples were acquired through test fishing operations commissioned in British Columbia, and we greatly appreciate the assistance received from many skippers and crew members. In addition to test fishing sources, several other parties assisted with sample collections. Some Queen Charlotte Island samples were provided by R. Jones and P. Fairweather (Haida Fisheries Program). Sample collection from Portage Inlet–Esquimault Harbor was overseen by Y. Carolsfeld (World Fisheries Trust); B. Mercer and associates (Buccaneer Marina and Resort on the Sunshine Coast) helped us obtain the Secret Cove sample. Samples from southeast Alaska were provided by R. Larson, M. Pritchett, and K. Hebert (Alaska Department of Fish and Game). Samples from Washington were provided by J. Shaklee, G. Bargmann, K. Stick, and P. McCalister (Washington Department of Fish and Wildlife). Samples from California were provided by K. Oda and T. Moore (California Department of Fish and Game). We appreciate the work of K. Horst (Pacific Biological Station), who extracted DNA from many of the
1810
BEACHAM ET AL.
samples analyzed in the survey. Primary funding for the research was provided by the Herring Conservation and Research Society in British Columbia and ancillary funding was provided by Fisheries and Oceans Canada. References Beacham, T. D., J. R. Candy, B. McIntosh, C. MacConnachie, A. Tabata, K. Kaukinen, L. Deng, K. M. Miller, R. E. Withler, and N. V. Varnavskaya. 2005a. Estimation of stock composition and individual identification of sockeye salmon on a Pacific Rim basis using microsatellite and major histocompatibility complex variation. Transactions of the American Fisheries Society 134:1124–1146. Beacham, T. D., D. E. Hay, and K. D. Le. 2005b. Population structure and stock identification of eulachon (Thaleichthys pacificus), an anadromous smelt, in the Pacific Northwest. Marine Biotechnology 7:363–372. Beacham, T. D., J. F. Schweigert, C. MacConnachie, K. D. Le, K. Labaree, and K. M. Miller. 2002. Population structure of herring (Clupea pallasi) in British Columbia determined by microsatellites, with comparisons to southeast Alaska and California. Canadian Stock Assessment Secretariat, Research Document 2002/109, Ottawa. Available: www.dfo-mpo.gc.ca/csas/csas/Publications. (February 2008). Cavalli-Sforza, L. L., and A. W. F. Edwards. 1967. Phylogenetic analysis: models and estimation procedures. American Journal of Human Genetics 19:233– 257. Debevec, E. M., R. B. Gates, M. Masuda, J. Pella, J. M. Reynolds, and L. W. Seeb. 2000. SPAM (version 3.2): statistics program for analyzing mixtures. Journal of Heredity 91:509–510. Domanico, M. J., R. B. Phillips, and J. F. Schweigert. 1996. Sequence variation in ribosomal DNA of Pacific (Clupea pallasi) and Atlantic (Clupea harengus) herring. Canadian Journal of Fisheries and Aquatic Sciences 53:2418– 2423. Felsenstein, J. 1993. PHYLIP: phylogeny inference package. University of Washington, Seattle. Fisheries and Oceans Canada. 2008. Molecular Genetics Laboratory home page. Fisheries and Oceans Canada, Pacific Biological Station, Nanaimo, British Columbia. Available: www-sci.pac.dfo-mpo.gc.ca/mgl. (December 2007). Goudet, J. 1995. FSTAT: a program for IBM PC compatibles to calculate Weir and Cockerham’s (1984) estimators of F-statistics, version 1.2. Journal of Heredity 86:485–486. Grant, W. S., and F. W. Utter. 1984. Biochemical population genetics of Pacific herring (Clupea pallasi). Canadian Journal of Fisheries and Aquatic Sciences 41:856–864. Haegele, C. W., and J. F. Schweigert. 1985. Distribution and characteristics of herring spawning grounds and description of spawning behaviour. Canadian Journal of Fisheries and Aquatic Sciences 42(Supplement 1):39–55. Hanne, B., H. Jørgensen, M. H. Hansen, D. Bekkevold, D. E. Ruzzante, and V. Loeschcke. 2005. Marine landscapes and population genetic structure of herring (Clupea harengus L.) in the Baltic Sea. Molecular Ecology 14:3219–3234.
Hay, D. E. 1985. Reproductive biology of Pacific herring (Clupea harengus pallasi). Canadian Journal of Fisheries and Aquatic Sciences 42(Supplement 1):111–126. Hay, D. E., P. B. McCarter, and K. Daniel. 1999. Pacific herring tagging from 1936–1992: a re-evaluation of homing based on additional data. Canadian Stock Assessment Secretariat, Research Document 99/176, Ottawa. Available: www.dfo-mpo.gc.ca/csas/csas/ Publications. (February 2008). Hourston, A. S. 1980. The decline and recovery of Canada’s Pacific herring stocks. Rapports et Proces-Verbaux des Reunions Conseil International pour l’Exploration de la Mer 177:143–153. Hourston, A. S. 1982. Homing by Canada’s west coast herring to management units and divisions as indicated by tag recoveries. Canadian Journal of Fisheries and Aquatic Sciences 39:1414–1422. Iles, T. D., and M. Sinclair. 1982. Atlantic herring: stock discreteness and abundance. Science 215:627–633. Jorstad, K.E., G. Dahle, and O. I. Paulsen. 1994. Genetic comparison between Pacific herring (Clupea pallasi) and a Norwegian fjord stock of Atlantic herring (Clupea harengus). Canadian Journal of Fisheries and Aquatic Sciences 51(Supplement 1):233–239. Kobayashi, T., M. Iwata, and K. Numachi. 1990. Genetic divergence among local spawning populations of Pacific herring in the vicinity of northern Japan. Bulletin of the Japanese Society of Scientific Fisheries 56:1045–1052. Lewis, P. O., and D. Zaykin. 2001. Genetic Data Analysis: computer program for the analysis of allelic data, version 1.0 (d16c). Available: lewis.eeb.uconn. (September 2002). McPherson, A. A., P. T. O’Reilly, and C. T. Taggart. 2004. Genetic differentiation, temporal stability, and the absence of isolation by distance among Atlantic herring populations. Transactions of the American Fisheries Society 133:434–446. McPherson, A. A., R. L. Stephenson, and C. T. Taggart. 2003. Genetically different Atlantic herring Clupea harengus spawning waves. Marine Ecology Progress Series 247:303–309. McQuinn, I. H. 1997. Metapopulations and the Atlantic herring. Reviews in Fish Biology and Fisheries 7:297– 329. Miller, K. M., K. Laberee, A. D. Schulze, and K. H. Kaukinen. 2001. Development of microsatellite loci in Pacific herring (Clupea pallasi). Molecular Ecology Notes 1:131–132. Neaves, P. I., C. G. Wallace, J. R. Candy, and T. D. Beacham. 2005. CBayes: computer program for mixed stock analysis of allelic data, version 4.02. Available: www. pac.dfo-mpo.gc.ca. (October 2007). O’Connell, M., M. C. Dillon, and J. M. Wright. 1998a. Development of primers for polymorphic microsatellite loci in the Pacific herring (Clupea harengus pallasi). Molecular Ecology 7:357–363. O’Connell, M., M. C. Dillon, J. M. Wright, P. Bentzen, S. Merkouris, and J. Seeb. 1998b. Genetic structuring among Alaskan Pacific herring populations identified using microsatellite variation. Journal of Fish Biology 53:150–163. Olsen, J. B., C. J. Lewis, E. J. Kretschmer, S. L. Wilson, and
PACIFIC HERRING POPULATION STRUCTURE
J. E. Seeb. 2002. Characterization of 14 tetranucleotide microsatellite loci derived from Pacific herring. Molecular Ecology Notes 2:101–103. Pella, J., and M. Masuda. 2001. Bayesian methods for analysis of stock mixtures from genetic characters. U.S. National Marine Fisheries Service Fishery Bulletin 99:151–167. Perriere, G., and M. Gouy. 1996. WWW-Query: an on-line retrieval system for biological sequence banks. Biochimie 78:364–369. Rannala, B., and J. L. Mountain. 1997. Detecting immigration by using multilocus genotypes. Proceedings of the National Academy of Science of the United States of America 94:9197–9201. Raymond, M., and F. Rousset. 1995. GENEPOP (version 1.2): population genetics software for exact tests and ecumenism. Heredity 86:248–249. Rice, W. R. 1989. Analyzing tables of statistical tests. Evolution 43:223–225. Ruzzante, D. E., S. Mariani, D. Bekkevold, C. Andre´, H. Mosegaard, L. A. W. Clausen, T. G. Dahlgren, W. F. Hutchinson, E. M. C. Hatfield, E. Torstensen, J. Brigham, E. J. Simmonds, L. Laikre, L. C. Lasson, R. J. M. Stet, N. Ryman, and G. R. Carvalho. 2006. Biocomplexity in a highly migratory pelagic marine fish, Atlantic herring. Proceedings of the Royal Society Series B 273:1459–1464. Schweigert, J. F. 2000. Stock assessment for British Columbia herring in 2000 and forecasts of the potential catch in 2001. Canadian Stock Assessment Secretariat, Research Document 2000/165, Ottawa. Available: www.dfo-mpo. gc.ca/csas/csas/Publications. (February 2008). Schweigert, J. F., and R. E. Withler. 1990. Genetic differentiation of Pacific herring based on enzyme electrophoresis and mitochondrial DNA analysis. Pages 459–469 in N. C. Parker, A. E. Giorgi, R. C. Heidinger, D. B. Jester, Jr., E. D. Prince, and G. A. Winans, editors. Fish-marking techniques. American Fisheries Society, Symposium 7, Bethesda, Maryland.
1811
Shaw, P. W., C. Turan, J. M. Wright, M. O’Connell, and G. R. Carvalho. 1999. Microsatellite DNA analysis of population structure in Atlantic herring (Clupea harengus), with direct comparison to allozyme and mtDNA RFLP analyses. Heredity 83:490–499. Small, M. P., T. D. Beacham, R. E. Withler, and R. J. Nelson. 1998. Discriminating coho salmon (Oncorhynchus kisutch) populations within the Fraser River, British Columbia, using microsatellite markers. Molecular Ecology 7:141–155. Small, M. P., J. L. Loxterman, A. E. Frye, J. F. Von Bargen, C. Bowman, and S. F. Young. 2005. Temporal and spatial structure among some Pacific herring populations in Puget Sound and the southern Strait of Georgia. Transactions of the American Fisheries Society 134:1329–1341. Smith, P. J., and A. Jamieson. 1986. Stock discreteness in herrings: a conceptual revolution. Fisheries Research 4:223–234. Stevenson, J. C. 1946. Growth of herring along the upper east coast of Vancouver Island. Fisheries Research Board of Canada, Progress Reports to the Pacific Coast Stations 67:32–35. Taylor, F. H. C. 1964. Life history and present status of British Columbia herring stocks. Fisheries Research Board of Canada Bulletin 143. Turan, C., G. R. Carvalho, and J. Mork. 1998. Molecular genetic analysis of Atlanto-Scandian herring (Clupea harengus) populations using allozymes and mitochondrial DNA markers. Journal of the Marine Biological Association of the United Kingdom 78:269–283. Waples, R. S. 1998. Separating the wheat from the chaff: patterns of genetic differentiation in high gene flow species. Journal of Heredity 89:438–450. Weir, B. S., and C. C. Cockerham. 1984. Estimating Fstatistics for the analysis of population structure. Evolution 38:1358–1370.