We tkmk Esther Bonneaar, Alain Gagnk, and Denis Croteau for their assistance in both ... readings we= validated by Drs D. Copeman and C. Delisle. Funding.
Use of Variation in Biological Characters for the Classification of Anadromous Rainbow Smelt (Osmerus mordax) Groups1
Can. J. Fish. Aquat. Sci. Downloaded from www.nrcresearchpress.com by University of Laval on 08/02/15 For personal use only.
D6partemnb de biologic, Urtiverst'tt! Eaval, Sainte-Foy (Qui.) GPK 7P4
Departmem of Fisheries and Oceam, Gulf Region, Fisheries Research Branch, C.P. 15500, Quebec, Qcre. GIK 7Y7 FMCHET,A., J. J. DODSON,AND H.POWLES. 1983. Use of variation in biological characters ) Can. for the classification of anadromous rainbow smelt (Osmerus m ~ r d a xgroups. J. Fish. Aquat. Sci. 40: 718 - 727. Analysis sf meristics, growth patterns, and fecundity to somatic weight relationships s f spawning anadromous rainbow smelt (Osmerus mordax) in Q u e k c waters demonstrated the existence of thee geographical groups (Chaleur Bay, south shore of the St. Lawrence E s t u q , and Saguenay Fjord). Although homing to spawning rivers does not appear to occur, the degree of heterogeneity of spawning smelt of different geographical areas is less at the extremes of their Quebec distribution. Classification of smelt from the commercial fishery catch indicates limited mixing of these groups during open-water migration. The existence of a fourth group is suggested by classification analysis of smelt caught along the lower north shore of the St. Lawrence Estuary. ~ ~ C H EA., T J., 9. DODSON,AND H.POWLES. 1983. Use of variation in biological characters for the classificatisn of anadromous rainbow smelt (Osrnerus mordax) groups. Can. J. Fish. Aquat. Sci. 40: 718 -727. L'analyse de variables portant sur des caractkres mCpistiques, de croissance et de relations fCconditC-poids somatique de 1'Cperlan (Osmercrs rnsrdax) anadrome du Qu$kc pendant la pkriode du frai, indique l'existence de trois groupes geographiques (la Baie des Chaleurs, la rive sud du fleuve Saint-Laurent et le fjord du Saguenay). M$me si le phCnom&ne du homing ne semble 6e produire ici, le degrd d'hktdrogCnkit6 des regroupementa d96perlans d'origines gdographiques diff6~ntesest moins important aux limites de leur distribution au QuCkc. La classification de I'eperlan de la @the commerciale indique un faible degd de mklange de ces groupes lors de leur migration en pleine mer. Les resultats de la classification de l'dperlan eapturk le long de la basse C8te-Nord de 19estuairedu Saint-Laurent suggkrent l'existence d'mn quatgikme grompe. Received September 3, 1982 Accepted February 25, 1983 A fish stock has been described by Larkin (1972) as "a population of organisms which, sharing a common gene pool, is sufficiently discrete to warrant consideration as a selfperpetuating system which can be managed." This is founded on the presence sf isolating mechanisms that limnit gene flow. Discreteness in fish stocks is a property that results from the interaction between ecological and genetic factors. This duality has led investigators to qualify given stocks as genotypic or phenotypic (Booke 1981). Members of the genotypic stock should conform to the Castle -Hardy- Weinberg law whereas the phenotypic
Regu le 3 septembre 1982 Accept6 le 25 fCvrier 1983
stock would display a clinal pattern of biological variables (Spangler et al. 1981). Phenotypic stocks are characteristic of r-selected, short-lived fish, pelagic as fry, and dependent on very few age classes in the spawning stock (MacLean and Evans 1981; Ryder et al. 6986). Various processes may help to establish and maintain such stocks. Homing is one that limits gene flow. Stock discreteness can also be obtained by mutation, selection, and genetic drift (MacLean and Evans 1981). Tagging studies (Magnin and Beaulieu 1965) in the St. Lawrence Estuary have demonstrated that seasonal openwater migrations in rainbow smelt (Osmerus mordar) are generally between $6 and l$es km. Marcotte and Tremblay '~ontributionto the plQgrLUllof GROQ (G~Qu~C~ h~ellllliversitCiire (1948) found a no&-south gradient in the vertebral counts Be Recherche ocCsenographique du Quebec). of anadromous rainbow smelt of the Gasp6 Peninsula. 'Resent address: Department of Fisheries and Oceans, C.P. Homing has not been demonstrated in anadromous rainbow 15 500, Quebek, Que. G1K 4Y7. smelt (Magnin and Beaulieu 1%5); thus, the extent of gene hinted in Canada (97052) flow between the various spawning rivers is unknown. Imprim6 au Canada (J7052) 718
Can. J. Fish. Aquat. Sci. Downloaded from www.nrcresearchpress.com by University of Laval on 08/02/15 For personal use only.
FR~CNETET AL.: CLASSIFICATHQN OF ANADROMOUS SMELT
7 19
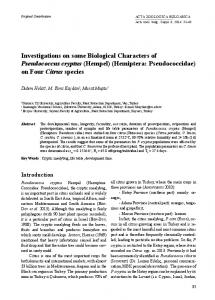
FIG. 1. Study areas on the Saguenay Fjord, the St. Lawrence Estuary, md Chaleur Bay. The objective of this paper is to assess the degree of spatial integrity of smelt groups~imrivers and in open waters using variation in the biological characteristics of mristics, growth, and fecundity. It is proposed that substantial differences in these characters between smelt of adjacent spawning rivers would be indicative of homing and the presence sf discrete genetic stocks. Once spawning smeit populations are characterized and the extent of overlap in heir biological characters is evaluated, a classification method is applied to the commercial fishery catch to assess the degree of spatial integrity of smelt stocks during their open-water migrations.
100 90-
> 80-
0
5 9 g
70so-
V
Materials and Methods
A total of 2239 anadromous spawning smelt were sampled by dipnetting during April and May, 1979 and 1980, at spawning sites in eight rivers located along the Saguenay Fjord (region I), the south shore of the St. Lawrence Estuary (region 11), and ChaIeur Bay (region 111) (Fig. 1). A minimum of 200 fish was sampled at each spawning site. Physical characteristics of these rivers are diverse, drainage basin areas ranging from 22.4 to 79 8863 km2 and maximum flow ranging from 233 to 5830 m' s-' . Another 2500 smelt were obtained from coastal commercial fisheries during the summers and winters of I979 and 1988 (Fig. I). Fishing gear of the csmmercial fishery was nonselective (box nets and weirs) in 80% of all samples and areas whereas gill nets sf varying m s h sizes accounted for the remaining 20%. All fish were frozen upon capture for subsequent analysis. Shrinkage in standad length due to freezing was compensated by applying the regression equation y = 1.0'3~- 2.38 (R* = 0.986, n = 140) to standard lengths measured from
STANDARD
LENGTH
(rn rn )
FIG. 2. Example of method for caiculating the critical length interval for length-at-age values sf spawning smelt. frozen fish (s -- standard length of frozen fish, y = standard Bength sf fresh fish). Standard Bength (tea the nearest millimeere), total weight (grams), gonad weight (grams), sex, and state of maturity (Nikolsky 1963) were noted for each specimen. Age was determined from scales (McKenzie 1958). Meristic counts included total left pectoral fin and anal fin rays, spines of the first left gill arch, and vertebrae (hypural excluded). Pecundity values were estimated by the dry weight method (Bagenal 1978) after treatment with Gilscsn's fluid and 24 h s f drying at 57OC- Five samples of 108 eggs were taken from each of 208 females and weighed to the nearest 0.1 mg. The
CAN. 3. FISH. AQUAT. SCI., VOL. 40, 1983
* 3
Z AREAS
Can. J. Fish. Aquat. Sci. Downloaded from www.nrcresearchpress.com by University of Laval on 08/02/15 For personal use only.
I
CHALEUR BAY
eP
E
= .3 f i j W W 2 z_t 6
SAINT L A ~ W E N C E SASUENAY
lIl II I FIG. 3. Means, standard deviations, and numbers of the meristic variables recorded for spawning smelt by river and area.
TABLE1. Univariate F value (ANOVA) s f meristic values before and after pooling. F(7, x , O.OOB) = 3.47; F ( 2 , m, 0.001) = 6.91. Characber --
Vertebrae Gill HakeH Pectoral Anal
-
p
2158 2165 2151
2166
-
areas
rivers
Eight
n p
--
123.4 44.6 33.9 6.0
-
-
-
413.7 118.0 79.9 15.7
procedure was repeated when the size of the 95% confidence interval was greater than 10% of the estimated mean fecundity. This occurred in only 25 cases.
Data Analysis
After testing interyear and between-sex differences, data were pooled for year and sex, and the variation of each of the
four meristic characters between the eight spawning rivers was tested using a one-way analysis of variance (ANOVA). Significant differences were identified using the StudentNewman-Keuls (SNK) test (Sokal and Rohlf 1969). As a result of this analysis, ;he eight riven were regrouped into three geographical regions, and Wilk's A test esnfxmed the validity of the pooling (P = 6.005). Multivariate discriminant analysis was performed to identifj the relative importance of the four meristic variables used in separating ' distance the three geographical regions. Mahalanobis B (Mahalanobis 1936) was used to calculate the percentage of fish correctly assigned to their area of origin. The statistical treatment of growth patterns involved an analysis of- variance of mean length at age for each sex and age class over the eight spawning riversn Student -NewmanKeuls tests were carried out to identify significant differences and p l samples. Sex and regional differences in growth were tested by the Hotelling T' test (Bernard 198 1) on parameters of the von Bertdanffy growth equation
FR~CHETET AL.: CLASSIFICATION OF ANABRBMOUS SMELT
TABLE2. Number of significant differences (SNK,P
S
0.05) of four meristic variables in the eight spawning rivers.
Area 111
Can. J. Fish. Aquat. Sci. Downloaded from www.nrcresearchpress.com by University of Laval on 08/02/15 For personal use only.
G . Wivibre Chaleur Bay (111) G . Rivikre (808) Bonaventure (384) CascragCdira ( 2 0 ) MaVqddiia (1 35)
721
Area 11
Bonaventure Cascapkdia
MatapMia T. Pistoks
Area I, R. Ouelle W. Boyer Chicoutirni
-
1
-
1
0 1
-
2
1
-
Saint Lawrence (11) south shore T. Pistoles (239) R. Ouelle (I 10) R. Boyer (106)
4 2 3
3 2 2
3 2 2
3
Saguenay (1) Chicoutimi (2W)
4
4
4
4
1 1
TABLE3. Standardized canonical coefficients of discriminant analysis of spawning smelt. Variable
Funetiow 1
Function 2
Anal fin rays Pectoral fin rays Gill rakers Vertebrae
0.05899 -0.18641 0.47344 Q.85952
-0.04958 0.97482 0.15947 0.12634
(Abramson 1965). As the growth of smelt was significantly different among regions and between sexes, length-at-age intervals characteristic of spawning groups were calculated using a simple method based on the cumulative frequency distribution of observed standard lengths of male and female smelt. An example. using fictitious data (Fig. 21, illustrates the method. After having calculated frequency (f), cumulative frequency ( F ) , and the complement of cumulative frequency ( 1 0 0 - F ) of the standard lengths of same-age fish of two adjacent groups (groups I and n), the cumulative frequency distribution of group HI is plotted against the complement (100 - F ) of g o u p I. The point at which these two curves intersect (at 113 mm in this case) determines the critical standard length that distinguishes smelt of the same age and sex of the two adjacent groups. Overlaps in length frequency of smelt from adjacent geographical areas rarely exceeded 20%. The procedure is repeated to calcuIate the critical standand length distinguishing smelt of the same age and sex of groups I1 and
2
-
0
2
-
3
4
4
111, thus establishing a critical length interval by age and sex for smelt from region II. The upper limit of the critical length interval for group I11 was based on the maximum observed standard lengths of spawning smelt captured in region I%geThe lower limit of the critical length interval for group I was based on the minimum observed standard lengths of spawning smelt captured in region I. Using these three critical length intervals by age and sex, smelt from the commercial fishery catch could thus be classified to a given region (I, 11, or Ill) on the basis of their length-at-age values. Initially, no length interval could be established for the single sample of spawning smelt of Chicoutimi (region I), as only one age class accounted for 94% of the fish sampled. This appeared to result from the temporal and spatial heterogeneity of smelt on the spawning grounds combined with the punctual nature of the sampling program. However, fish from the commercial samples at Anse St-Jean ( n = 236) were smaller at a given age than smelt fmm regions I1 and HI1 md displayed a wider age span than the Chicoutirni spawning samples. Therefore, the Anse St-Jean fish were considered a spawning sample, thus enabling us to calculate the critical length interval by age and sex for gmup I. Use of this commercial sample to replace a spawning sample is justified by the similarity of length at age 2 of the two samples and the geographical proximity of the sampling sites. Comparison of regression lines for the fecundity to somatic weight relationship was tested by analysis of covariance (ANCQVA) (Snedecor and Cochran 1978).
TABLE4. Classification results of discriminant analysis of meristic variables of spawning smelt.
Predicted group membership
Actuai group Chaleur Bay (111)
-
No. Chaleur Bay of cases (7%)
Saint Lawrence south shore Saguenay Fjord (%)
1477
67.0
26.8
6.2
Saint Lawrence (11) south shore
44 B
32.2
47.2
20.6
Saguenay Fjord (1)
197
4.6
18.3
77.2
CAN. J. FISH. AQUAT. SCI., VOL. 40, 1983
TABLE5. Results of SNK tests s f male standard length (SL) by spawning river and age ( P = 8.05). Non-
significantly different means me underlined. Age (yr)
-
--
Spawning rivers
-
Can. J. Fish. Aquat. Sci. Downloaded from www.nrcresearchpress.com by University of Laval on 08/02/15 For personal use only.
2 Chieoufimi W. Ouelle 118.96 SL 95.07 (n) (185) (5)
R. Boyer Cascapedia G. Rivikre T. Pistoles Bonaventure Matapedia 125.71 417)
127.77 (135)
131.38 (171)
132.44 (51
133.29 (153)
3 SL (n)
R . Boyer 145.39 (70)
R. Omelle T.Pistoles Cascapaia Bsnaventure G . Rivikre 152.46 162.53 162.60 145.41 145.46 (77) (59) (20) 41 14) C 153)
MatapCdia
4
R. Ouelle 365.26 (12)
Cascap6dia W. Boyer
T. Pistoles Bonsaventure G. Rivikre
MatapCdia
179.25 (12)
185.94 (3)
SL (n)
5 CascapCdia SL 180.59 bn) (5)
166.33 (31
R. Boyer 181.78 (9)
148.83 (3)
168.99 413)
179.46 (17)
842.71 (135)
171.44 (45)
T. Pistoles G . Riviere Bonaventure 187.44 189.58 196.03 (5) (5) (7)
FEMALE
Lm CHALEUR BAY
k
t.
202
0.5759
0.1654
SAINT LAWRENCE 309 SOUTH SHORE
0.1247
-2. 1 100
SAINT 2LAWRENCE SOUTH
0 2900
-8.109
SHORE
AGE
FIG. 4. von Bertalanffy growth curves for length-at-age data of spawning simelt (vertical bus represent
Each method of classification (meristics, length-at-age) was then validated by the degree of overlap of accurately predicted group membership of individual fish by a simultaneous application of both methods to the spawning mn samples.
C O M M ~ C IFISHERY AL SAMPLES
To assign smelt caught in the coastal commercial fisheries
k 1 SE
of measured length).
to one of the spawning groups previously identified, the Mahalanobis D2 generalized distance was calculated based on the four meristic variables. Fish from the commercial fishery were also assigned to one of the three areas of origin based om their length-at-age value. The fecundity 80 somatic weight relationship could not be used for classifying fish from the commercial fishery because no fecundity count could be made between spawning mns.
TABLE6. Results of the Motelling T 2 test applied to von Bertalanffy growth coefficients (Leo, asymptotic length; to. hypothetical age at zero length; k, growth coefficient; NS, not significant; **P =S 0.01; T i critical value of T' for significance).
-
Relative importance (critical &)
Can. J. Fish. Aquat. Sci. Downloaded from www.nrcresearchpress.com by University of Laval on 08/02/15 For personal use only.
Test
0 E
0
z
No. 1
T~
Saint Lawrence south shore, between sexes Chaleur Bay, between sexes Mdes, between areas Females, between areas
4093.9** 33 399.3** 14 193.3** 3242.9**
11.39
No.
a
(275.91)
L= (35.28)
11.36 6." (2462.17) k (395.79) 1 1.36 k (5327.63) to (2547.10) 11.37 k (542.84) Lm (361.84)
Lm (759.47)
fo
(318.75) k
No. 2
m
(2.47) (NS) (71.62)
130120-
t-
(If
ILO-
IQO
-
AGE
AGE
FIG. 5 . Intervals of standard length-at-age based on spawning smelt for assignment sf commercial fishery catch.
Results
Meristics - As no significant differences were found between year and sex (P > 8.05), the four meristic variables recorded at each spawning river (Fig. 3) were pooled for year m d sex. Each variable showed significant variance between rivers (ANOVA, P = 0.01) (Table 1). The a posteriori SNK test indicated an increase In the number of significant differences closely related to the geographical distance separating each spawning river (Table 2). Three geographic groups (areas, Fig. 3) were thus defined: Saguenay (I), the St. Lawrence Estuary (11), and Chaleur Bay (111). The Saguenay Fjord has the greatest number of differences in meristic counts when compared with spawning rivers of Chdeur Bay. Intermediate numbers of differences arise when one compares either area to the St. Lawrence spawning rivers. Small numbers of significant differences occur within each of
the three areas. This observation led us to pool results from the spawning rivers into three areas (I, 11, and 111) to obtain maximum separation of groups. The usefulness of this pooling is revealed by the increase of the F value for each meristic variable considered over the larger geographic scale (Table I). Furthermore, a significant Wilk's X (P = 8.005) confirmed the hypothesis of having effectively three smelt groups. The standardized canonical discriminant function coefficients (Table 3) of the first two functions illustrate the relative importance of the four meristic variables used. The first axis explained 89.5% of the variance ktween these three groups and was mainly due to the effect of vertebrae and gill raker counts. Classification results (Table 4) based on Mahalanobis D ' distance yield an overall value of correctly classified fish from the spawning runs of m a s I, 11, and I11 ranging from 47.2 to 77.2%.
CAN. B. FISH. AQUAT. SCH., VOL. 40, 1983
TABLE7. C1assifi~atin-wresults of spawning and commercial fishery catch of smelt on the basis of growth pattern. -
-
-
-
-
-
-
Redieted group membership 4%) No.
Actual group
Can. J. Fish. Aquat. Sci. Downloaded from www.nrcresearchpress.com by University of Laval on 08/02/15 For personal use only.
-
-
d cases
Not assigned
Chaleur Bay
Saint Lawrence south shore
Saguenay Fjord
-
Chaleur Bay spawners (111)
1490
3.3
76.6
454
0.9
20.9
Cbaleaar Bay
448
11.6
54.4
Saint Lawrence south shore
410
2.2
15.6
Anse Saint Jean (Aug. 23, 1979)
52
13.5
1.9
Anse Saint Jean (May 15, 1980)
87
10.4
28.7
Anse Saint Jean (duly 20, 1979)
97
36.1
0.0
Saint BrenCe (Sept. 9, 1979)
B 45
0.8
7.5
Saint IrenCe (Oct. 11, 1980)
71
2.8
4.3
Sdnt Simtcsm (3uly 2 1, 1979)
61
4.9
3.3
Saint Simton (July 22, 1979)
46
19.6
2.2
Saint SimCon (Aug. 5, 1980)
90
0.0
10.0
Fonstville (June 12, 197'9)
14'7
23.8
24.5
Baie C a m a u (Aug. 2, 1980)
104
40.4
34.6
Baie Camearn (Aug. 29, 1979)
116
21.6
39.7
Saint Lawrence south shsre spawners (11) Saguenay Fjord spawners (I) Commercial fisheries
Growth patterns - Because smelt growth is different (P < 8.05) for the two sexes but not different between years (P > 0.85), length-at-age data were tested separately by sex. Differences were significant between the eight spawning rivers frsm age 2 through 5 (P = 0.05). The SNK test was then performed on male length-at-age to test significance of differences between spawning river samples. Results
(Table 5) display a geographical gradient, with the northernmost hydrographic system having the smallest length-atage. Smples showing no significant differences were quite close geographically and often from the same area (I, 11, or 111). Because a geographical gradient was established and because samples from the same area often showed m n significant differences, sampling sites were p o l e d on the
Can. J. Fish. Aquat. Sci. Downloaded from www.nrcresearchpress.com by University of Laval on 08/02/15 For personal use only.
FRE?CHET ET AL.: CLASSIFICATION OF ANADROMOUS SMELT
SOMATIC
WEIGHT
( g )
FIG. 6. Fecundity to somatic weight regressions of spawning anadromous smelt (vertical and horizontal bars for Chicoutirni sample represent 21 SE).
TABLE8. F values (ANCOVA) of the fecundity to somatic weight relationship (NA, not applicable; **P S 0.01).
Saint Lawrence (HI) south shore Chaleur Bay (111) Saint Lawrence south shore vs. Chdeur Bay
F
F
(elevation)
(slope)
8.61**
2.72
7.38**
1.24
NA
34.89**
basis of their geographical distribution (I, 11, or 111). A similar pattern was observed for female standard length, but low numbers of females at certain spawning sites did not provide sufficient data for fine-scale comparison. von Bertalanffy growth curves were fitted by area and sex (Fig. 4). None were fitted at the Saguenay spawning site (Chicoutimi) because the fish sampled lacked an adequate age span. The Hotelling T~ test was then performed to compare von Bertalanffy growth parameters between sexes and areas (Table 6). All differences were significant except between sexes ( t o parameter) in Chaleur Bay.
Before attempting to classify fish from the commercial fishery catch to a given spawning area, the application of length-at-age intervals (Fig. 5) to fish from spawning river samples was tested. Here, 1524 of 2144 (7 1 .1%) fish could be correctly assigned to their spawning area (Table 'I). Once methods for classifying fish on the basis of meristics and growth had been tested, they were used simultaneously. Of a possible 1344 fish assigned to their area of origin by only one method, 996 (74%) fish were successfully assigned to their area of origin using both methods, thus validating the application of both methods to the commercial fishery catch. Fecundity analysis - The fecundity to somatic weight regressions were calculated for smelt from each spawning site (Fig. 6). Simple linear regressions s f fecundity on somatic weight gave better fits than regressions of transformed values (e.g. log transform). As values obtained for Chicoutimi were small (number of eggs ranging from 506 to 2862 and somatic weight from 5.8 to 7.3 g (n = lo)), no regression could be applied. Regression coefficients within a given area did not differ (ANCOVA, P > 0.05) (Table 8). However, the two areas (south shore of the St. Lawrence and Chaleur Bay) are significantly different (ANCOVA, P < 0.01) (Table 8). The regression equations were as follows: St. Lawrence south
CAN. J. FISH. AQUAT. SCI., VOL. 40, 1983
TABLE9. Classification results of commercial fishery based on discriminant analysis s f meristic values of spawning smelt.
Predicted group membership (5%) -
Actual group
No. of cases
Chaleur Bay
Saint Lawrence south shore
Saguernay Fjord
Can. J. Fish. Aquat. Sci. Downloaded from www.nrcresearchpress.com by University of Laval on 08/02/15 For personal use only.
Chaleur Bay (111) Saint Lawrence (HI) south shore Saguenay Fjord (I) Saint Lawrence north shore
Saint HrenCe (Sept. 3, 1979) Saint Irede (act. 1 1, 1980) Saint SimCon (July 20, 1979) Saint SimCon (July 2 1, 1979) Saint Simksn (July 22, 1979) Saint Simkon (Aug. 5, 1980) ForestvilBe (June 12, 1979) Forestville (Aug. 23, 1979) Fsrestvitle (Aug. 3, 1980) Baie Comeau (Aug. 29, 1979) Baie Comeau (Aug. 2 , 1980)
shsre, E = 788.71W - 3281.22 (R2 = 8.768, N = 97); Chaleur Bay, E = 1061.96W - 4118.79 (R' = 0.846, N = 92); where E = number of eggs and W somatic weight.
-
Mcristics - The classification of smelt from commercial fishery samples on the basis of meristics revealed varying degrees of mixing of the three spawning groups during their open-water migrations. In the Saguenay Fjord 66.1% of the commercial catch was assigned to the Saguemy spawning group, and in Chaleur Bay 63.39%of the commercial catch was assigned to the Chaleur Bay spawning group (Table 9). Commercial catches from the south shore of the St, Lawrence exhibited the gEatest degree of heterogeneity, with 45.9, 22.6, and 31 5 % k i n g assigned to the south shore, Chaleur Bay, and Saguenay Fjord spawning groups , respectively (Table 9). As no spawning river has been identified on the north shore of the St. Lawrence, all commercial samples from this area
were assigned to the already established spawning groups. Fish from the four sampling sites on the north shore fall into two groups. The first includes the St-Irenk and St-Simhn samples and are well assigned to the Saguenay group (I). A second group of samples from the downstream portion of the St. Lawrence (ForestvilBe, Baie Comeau) are variously assigned to all spawning groups.
Growth patterns - Fish from commercial samples were assigned by the length-at-age interval method to spawning groups. The commercial fishery catch shares almost the same growth patterns as those of local spawners (Table 7). AS no spawning site. was found on the north shore, all commercial fishery samples were classified and two distinct groups were observed, One consisted of samples from St-IrenCe and St-SimCon, which are assigned to the Saguenay group (45.9-69.7%) (Table 7). A second group of samples (Forestville and Baie Gmeau) is variously assigned to all spawning stocks, with a high proportion of individuals being not assigned at aHI.
FRBCET
ET AL.:CEASSHPICATION OF ANADROMQUS SMELT
Can. J. Fish. Aquat. Sci. Downloaded from www.nrcresearchpress.com by University of Laval on 08/02/15 For personal use only.
Significant variations are found in three biological characters of anadromous smelt in Quebec waters. Meristics ,growth patterns, and fecundity to somatic weight relations indicate significant variability between the eight spawning rivers sampled. An analysis of the pattern of variability revealed three geographical groups. This study has demonstrated that homing to spawning rivers does not appear to mcur because differences between rivers within a geographical area are small. However, the degree of heterogeneity of spawning smelt of different geographical areas is less at the extremes of their Quebec distribution. Differences between these geographical groupings are most likely due to both genetic and environmental factors. Classification of spawning smelt to an area other than the area of sampling may thus reflect either mixing of smelt from neighbouring areas or the variability of biological characters along an environmntal cline, characteristic of geographical stacks. The classification of smelt from commercial catches provides an insight into the extent of mixing over the summer season. Fish captured at the extremes of their Quebec distribution have the greatest affinity to the local spawning group. This indicates that open-water migrations are limited to the geographical area of origin and, to a lesser degree, to adjacent areas. Such locd migratory movements are consistent with those recorded by tagging (Magnin and Beaulieu 1965) of smelt in the St. Lawrence Estuary, which indicated average movements from 80 to 160 krn in the upstream-downstream direction. Magnin and Beaulieu (1965) also found very limited migrations between the north and south shores of the St. Lawrence Estuary. Because no spawning river was found on the north shore of the St. Lawrence between Quebec and Baie Gorneau, it is of interest to note the splitting of the four sampling sites on the north shore into two groups. Meristics as well as growth patterns assign the upstream group (St-IrenCe, St-SimCon) quite well to the Saguenay m a (I) whereas the downstream group (Forestville, Baie Comeau) does not relate clearly to any spawning area. This suggests the existence of an as yet unsampled spawning site along the lower north shore of the St. Lawrence Estuary. The survey for spawning rivers stopped at Franquelin, a village approximately 25 h downstream from Baie Comeau, but there may be a spawning river farther downstream that could be the source of these samples. Fecundity observations showed a geographical gradient and record values. A maximum of 93800 eggs was found in a 5-yr-old female at Grande-Rivikre (area 111). Smallest values were obtained for Ckicoutimi smelt (area 1). Spawning females sampled in the Saguenay exhibit growth, maturity, and fecundity similar to previously studied "stunted" freshwater smelt (Delisle 1969). A further indication supporting the existence of at least three discrete smelt groups is the similarity between the Bocations of fishing areas and the identified groups. Fisheries are extremely limited between Matam and Gas@, suggesting
727
that smelt are relatively rare in this area and thus that estuary and Chaleur Bay populations are distinct. Finally, information on distribution of parasites (Fdchet et al. 1983) confirms the existence of groups identified here.
Acknowledgments We tkmk Esther Bonneaar, Alain Gagnk, and Denis Croteau for their assistance in both the laboratory and the field. Special thanks to all commercial fishemen who coilabsrated in the sampling. Scale readings we= validated by Drs D. Copeman and C. Delisle. Funding was provided by the Government of Canada, Department of Fisheries and Oceans, Quebec Region, and FCAC.
ABWSQN,J. J. 1955. von Bertalanffy growth curve II, IBM 7094, Univac 1167, Fortran IV. Trans. Am. Fish. Soc. 94: f 95 - 196. BAGENAL, T. 1978. Methods for assessment of fish production in fresh waters. Blackwell Scientific Publications, Oxford, London, Edinburgh, and Melbourne, 365 p. BERNARD, D. R. 198 1 . Multivariate analysis as a means of comparing growth in fish. Can. J. Fish. Aquat. Sci. 38: 233-236. Boom, H. E. 1981. The conundrum of the stock concept - are nature and nurture definable in fishery science? Can. J. Fish. Aquat. Sci. 38: 1479-1480. DBLISLE, C. 1969. 6cologie, croissance et comportemnt de 19Cperlm du Lac Heney. comt6 Be Gatineau ainsi que la rkpartition en eau douce au Qudbec. Ph.D. thesis, Department of Biology, University of Ottawa, Ottawa, Ont. 180 p. FR~CHET, A., J. J. DODSON, AND H. POWLES. 1983. Les parasites de 1'Cperlan anahme (Osmerus mordax) du QuCkc et Beur utiIit6 comrne Ctiquettes biologiques. Can. J. Zool. 61: 621-626. LARKIN. P. A. 1972. The stock concept and management of Pacific salmon, p. 1 1- 15. In 8 . C. Simon and P. A. Larkin [ed.] The stock concept in Pacific salmon. University sf British Columbia, Vancouver, I3 .C . MACLEAN, J. A., AND D. 0.EVANS.1981. The stock concept, discreteness of fish stocks, and fisheries management. Can. J . Fish. Aquat. Sci. 38: 1889- 1898. MAGNM, E., AND G. BEAULIEU. 1965. Quelques donndes sup la bioiogie de 1'Cprlan Bsmerus eperdanus m r h (Mitchill) du Saint-Laurent. Natur. Can. 92(3 -5): 81 - 105. MAHALANUBIS, P. C. 1936. 8n the generalized distance in statistics. Pruc. Nat. Inst. Sci. India 12: 49-55. M A R C O ~A., E , AND J. L. ~ E M B L A1948. Y . Notes sur la biolsgie de lSCperlanOsmerus morda (Mitchill) de la pvince de Qukkc. Contrib. Sin. Biol. St-Laurent, Can. No. 18: 187 p. MCKENZE,W. A. 1958. Age and growth of smelt, Bsmerlos morrfax (Mitchill), of the Mirarnicki River, New Brunswick. J. Fish. Res. Board Can. 15: 1313-1327. NI~LSKY G., V. 1963. The ecology sf fishes. Academic Press, London and New Ysrk. 352 p. RYDBR, W. A., S. W. KERR,W. W. TAYLOR, AND P. A. EARKIN. 1981. Csrnmunity consequences of fish stock diversity. Can. J. Fish. Aquat. Sci. 38: 1856-1866. S N E D E ~6R.,W., AND W. 6. CWHRAN. 1978. Statistical methods. 6th ed. Iowa State. University Press, Ames, IA. 593 p. SOKAL, R.R.,AND F. J. RQHLF.1969. Biometry. W. W. Freeman and Company, San Francisco, CA. 776 p. SPANGLW, G . R., A. H.BEIPST, AND J. F. KOONCE. 1981. P ~ ~ S P C tives and policy recommendations on the relevance sf the stock concept to fishery management. Can. I. Fish. Aquat. Sci. 38: 1908-1914.