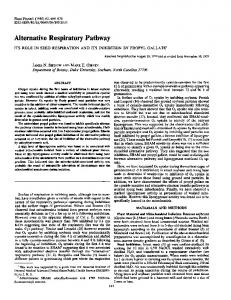
yields (closed circles) has a close fit to this function, indicating a. Fla. FIG. 3. Light-saturation curves of A) 02 flash yields and B) PSI respiratory tran- sients in C.
Plant Physiol. (1987) 84, 879-882 0032-0889/87/84/0879/04/$0 1.00/0
Use of a Light-Induced Respiratory Transient to Measure the Optical Cross Section of Photosystem I in Chlorella Received for publication November 14, 1986
NANCY L. GREENBAUM, ARTHUR C. LEY, AND DAVID C. MAUZERALL* The Rockefeller University, New York, New York 10021 (N.L.G., D.C.M.), and Biological Laboratory, Harvard University, Cambridge, Massachusetts 02158 (A.C.L.) molecules per unit is straightforward. In cases where the absorption differs, however, direct information can be gained about A method has been developed whereby the magnitude of a transient in how many of each of the different Chl are involved. 02 uptake attributable to photosystem (PS) I activity, following singleA method was developed by Ley and Mauzerall (6) by which turnover laser flashes of varying energy, can be used to measure the the light-saturation behavior of 02 formation by Chlorella cells optical cross section of PSI. As measurements are made under the in response to single turnover laser flashes was used to determine identical physiological conditions for which the cross section of PSII has the cross section of PSII. Unlike PSII, however, PSI has no previously been determined (AC Ley, DC Mauzerall 1982 Biochim readily quantifiable product indicative of its activity, and measBiophys Acta 680: 96-105), it is now possible to simultaneously measure urements must be made of other light-induced signals or interthe cross section of both photosystems in intact, photosynthetically mediates. For example, Weaver and Weaver (14) measured a competent cells, without the use of inhibitors or artificial mediators of light-induced EPR signal in spinach subchloroplast particles, and electron transport. Plots of light-saturation behavior of the respiratory Greenbaum (2, 3) studied H2 production by PSI of Chlorella oscillation following pulses at 596 nanometers indicate a mean optical cells under anaerobic conditions. cross section similar to that of PSII at this wavelength, but suggest In this report, we describe a new method for the measurement significant heterogeneity in the cross section of PSI. If this method of the optical cross section of PSI in Chlorella. As in the previous measures only PSI activity, this result implies that there exist units with studies from this laboratory (5, 6), use of monochromatic, singledifferent numbers of identical chromophores, or units having populations turnover flashes of light avoids the complicated kinetics induced of chromophores with different absorption spectra. by the distribution ofturnover times in electron transfer reactions which determine the steady state response. Since measurements are made under exactly the same conditions as those used for the measurements of PSII, it is possible for the first time to measure the cross sections of both photosystems under identical physiological conditions without the use of artificial inhibitors As a means of maintaining the efficiency of photosynthesis, or mediators of electron transport. the optimal size of a photosynthetic unit, defined as the number MATERIALS AND METHODS of pigment molecules capable of transferring energy to a given reaction center, can vary with changing environmental condiBatch cultures of green alga Chlorella vulgaris were grown at tions. It is known that several hundred Chl molecules are asso- 20°C in Buff's medium on a rotary shaker with continuous ciated with reaction centers (RC)' for PSI and PSII in plants and lateral illumination (8 x I03 erg cm2. s-') from cool-white algae, together with many additional components such as Cyt fluorescent lamps. Cells (5-6 d old) were collected from expoand quinones. Recent research has made it increasingly clear nentially growing cultures (doubling approximately every 24 h) that no simple or single stoichiometry of these components by centrifugation at 10,000g, and were resuspended in the same prevails, and that the relationships among the components of medium + 1 mm NaHCO3. These growth conditions are similar the photosynthetic apparatus can change on both a long and to those used by Ley and Mauzerall (6). short time scale (1, 4, 9). Thus, an objective measure of the Relative 02 flash yields (PSII activity) and respiratory oscillaabsolute size of the photosynthetic unit and of the distribution tions (PSI activity) were measured with a Pickett-type 02 polarof the pigments between RCI and Ii is a useful tool in the study ograph as described previously (6). From the average diameter of the structure and function of these systems. of an algal cell (approximately 4 ,m), it was calculated that the The absorption properties of a reaction center and its associ- settled cells covered about 35% of the area of the bare platinum ated pigments can be quantitatively described in terms of its electrode. The circulating buffer, the same medium as that in optical cross section a, the area for photon capture by the light- which the cells were suspended, was partially de-gassed by vacabsorbing pigments. This quantity, which for an isotropic system uum to avoid bubbles and excess contribution of oxygen to varies directly with the absorbancy index, can be translated into baseline variations. the number of pigment molecules functionally contributing to a Microsecond flashes of light were provided by a Candela LFDL particular photoreaction by use of the measured in vivo absorp- 2 flashlamp-pumped dye laser, using a dye solution of 100 gM tion cross section for a pigment molecule at the specified wave- rhodamine 6G/. 1% lauryldimethylamine oxide in 50% methlength. At wavelengths where the different Chl have similar anol (maximum emission at 596 nm). The measured laser flash absorbance, the conversion to obtain the total number of Chl energy reaching the entrance to the fiberoptics was decreased by insertion of calibrated filters of various concentrations of Cr-, 'Abbreviations: RC, reaction center; a, optical cross section; EPR, Ni-, Co-, and CuSO4 contained in closed glass cuvettes (5 cm x electron paramagnetic resonance. 2.5 cm light path). ABSTRACT
879
880
GREENBAUM ET AL. of 02 were measLight-saturation curves for the production Flashes ured essentially according to the procedure of Ley and Mauzerall (6). Briefly, cells on the electrode surface were illuminated with a train of saturating laser flashes at the rate of one flash every second. When the amplitudeof 02 production had become .... constant, the flash energy illuminating the cells was diminished with one or more of the filters. The mean amplitude of the02 produced as a result of the first attenuated flash was recorded, after which the filter(s) was removed and flash energy returned to saturating values. In this way, an entire light saturation curve could be rapidly obtained for cells in a steady state of pulsed light. For the measurement of the light-induced signal used here as an indication of PSI activity, algae were first dark-adapted by covering the electrode system with several layers of black cloth in a very dimly lit room for 3 min (such that no02 evolution could be measured following the first two flashes of saturating laser light delivered to the cells). Cells were then illuminated by inc. 02 the specified number of laser flashes of the indicated energies before returning to dark conditions. For measurement of the amplitude of respiratory oscillations following illumination, the difference between the maximal (approximately 20 s after the laser flashes) and minimal values (approximately 30 s later), corresponding to the'T3' and'T4' of Ried (10,11), from the linear baseline was recorded as the amplitude of the oscillation. 02 flash yields and amplitudes of respiratory transients were normalized to control values (measurements made at saturating energies) repeated at frequent intervals during each experiment, and data plotted as the relative amplitudes.
Plant Physiol. Vol. 84, 1987
4
-- -- -7 a-. . .. a*
RESULTS AND DISCUSSION
For the measurement of PSI activity, we have made use of a transient in the rateof 02 uptake exhibited by Chlorella cells
following one or more single-turnover flashes. This response 30 s, appears as a net decrease in uptake for approximatelysimilar followed by an overshoot in the opposite direction of duration, and a series of damped oscillations before returning to baseline levels of respiration (Fig. 1). Ried (10,11) found this behavior to be independent of oxygen evolution in Chlorella and Scenedesmus because it was not inhibited by DCMU, an inhibitor of photosynthetic oxygen was production. On the other hand, this oscillatory activity inhibited by 5 mm glucose, which did not affect02 production. Furthermore, the action spectrum of the magnitude of the oscillations followed that attributable to PSI activity (12, 13). The oscillations occur only in the presence of CO2 or HCO3 , and are best observed in dark-adapted cells (they do not occur in cells exposed to white background illumination greater than 6 x 10⁻² mW/cm2; data not shown). The magnitude of the oscillations by following saturating laser flashes is not noticeably diminished the inclusion of 10 AM DCMU in the circulating buffer (NL Greenbaum, D Mauzerall, unpublished data), thereby rendering unlikely any contribution by electron transport from PSII. The first amplitude of the oscillations is linearly dependent upon the number of flashes of saturating or of subsaturating of proportional energy (Fig. 2). It is observed that a response there is no single laser flash, and that oscillation, magnitude is elicited by aS-state variation associated with periodicity. Thus, the has the whose basic cause and function is as yet uncertain, desirable properties of a linear measure of photoexcitation of PSI. The saturation behavior of a light-induced response, under certain well-defined conditions, is described by the cumulative single-hit Poisson distribution: Relative yield = 1 - exp(-uE) where E is the energy per cm' of the laser flash at the electrode
[J t He 4 &
t~-
60 wec
FIG. 1. Time courseof 02 evolution and respiratory transient following laser flashes. The upper trace records the output of the thermopile used to monitor the total energies of the flashes (in this case, 13) before attenutaion. The lower trace shows the output of the oxygen detection circuit. The baseline represents the rateof 02 uptake by Chlorella in the dark. The patternof 02 evolution in response to laser flashes is due to Sstate periodicity; the amplitudes of the 02 evolution traces in this experiment are truncated by the amplifier response time. The minimal point of the oscillation, occurring approximately 20 s after the first laser pulse, and the maximum at approximately 50, s are analogous to the T3 and T4 described by Ried (10, 11).
surface. The conditions necessary for this behavior are: (a) uniform illumination upon isotropic units with the same cross section in optically thin samples; and (b) the same effect is produced by all reaction centers which are hit one or more oftimes an during each single-turnover flash. The approximation is acceptable in this case because of the depolarisotropic system effect of Chl antenna systems. A saturation curve rising izing more steeply than a simple exponential curve is caused by an increased probability of escape of energy from closed RC with an equal respect to open RC as the traps become filled, whereas in a escape from open and closed trapsAresults probability ofidentical to the simple Poissonian. saturation curve almost curve rising less steeply than the complement of an exponential is more ambiguous. It may be caused by an increased probability of escape from open traps over escape from closed traps, by nonhomogeneous illumination, or by a distribution of cross section sizes (see Refs. 7 and 8 for further interpretation of these curves). Figure 3A shows the results of an experiment for measurement of the optical cross section of PSII at 596 nm. Flash energies
LIGHT-INDUCED RESPIRATORY TRANSIENT
881
28 24 z
FIG. 2. Relationship between the number of single turnover flashes and amplitude of respiratory oscillations. The magnitude of oscillations (Fig. 1) is linearly dependent upon the number of laser flashes (from 1 to at least 20) of saturating (6 x 10¹⁶ quanta/cm2, represented by the symbol *) or of subsaturating (3 x i0'4 quanta/cm2, g or 2 x 10'3 quanta/cm2, A)
>0: 2o '
16
z
`
12
u U
0
energy.
8
a
0
'j 4-
MT-
I
0
2
A
8
6 N@UMBER OF FLASHES 4
12
10
1.I S
I 0.1
PSII 596 nm
p.4
' /
94 o
0 4Jod
0.: 0
1013
1014 ash
B
1016
1.0 .0.8
PsI ' S96zn
ao ,
FIG. 3. Light-saturation curves of A) 02 flash yields and B) PSI respiratory transients in C. vulgaris at 596 nm. The normalized 02 responses were plotted versus the total light energy per flash at the electrode surface. The solid curve fit to the flash yield data (closed circles in A) is the cumulative single-hit saturation function calculated for a unique mean a, = 100 A2. The solid curve fitted to the 02 transient data attributable to PSI activity (open circles in B) is that calculated for a ten-fold heterogeneity in the size of the PSI cross section, with a mean cross section similar to that of PSII. For comparison, the curve calculated for a unique a has been included (dashed
line).
0.6
0/4 80.2
MS'
0
-
1013
1014
10i5
1016
Quanta/on2 pe fFla were varied between 1016 quanta/cm2 per flash (unattenuated) unique (i.e. within a 3-fold range for a square distribution) mean and 1012 quanta/cm2 per flash. The solid curve is the cumulative size and little or no escape from closed traps (or a probability one-hit Poisson distribution calculated for a = 100 A2. It can be similar to that for escape from open traps). The light saturation curve of the respiratory oscillations (Fig. seen that, similar to the data of Ley and Mauzerall (6), the measurement of the light-saturation behavior for the 02 flash 3B, open circles) indicates a mean cross section similar to that yields (closed circles) has a close fit to this function, indicating a of PSII, but shows marked broadening compared with the ex-
882
GREENBAUM ET AL.
ponential behavior depicted in Figure 3A. While such a curve is generally indicative of nonuniformity in a, other sources of nonuniformity (e.g. illumination, optical thickness and anisotropy of sample, etc.) must be excluded. In these experiments, the light distribution was uniform by inspection and the objective criteria of the fit of the data of the O2 yields, leading to the conclusion that heterogeneity in the system is limited to the optical cross section of the unit. This conclusion is also consistent with findings of Greenbaum from measurements of H2 production by PSI in Chlorella (2, 3). Replotting of the data published by Weaver and Weaver (14), in which an EPR signal was used to measure photoexcitation of PSI of spinach subchloroplast particles at 694 nm, on a logarithmic scale yields a curve for the light saturation which demonstrates a similar deviation from the exponential curve as the data in Figure 3B. Two possible origins of heterogeneity in a are: (a) units having different numbers of identical chromophores, resulting in a distribution of cross sections, and (b) units having chromophores with different absorption spectra, resulting in discrete a values. By comparing the data with the curves predicted by the respective models, the likelihood of either possibility can be evaluated. As a possible fit, the data in Figure 3B are presented against the curve predicted for a 10-fold square distribution in a (an example of the first case). The second case, for which the saturation behavior would be expressed as the weighted sum of two individual Poissonian curves, cannot be adequately distinguished by the current data at 596 nm, as the Chl may well absorb similarly at this wavelength. If the second case prevails, measurement of the light-saturation behavior at other wavelengths at which the contributing chromophores have widely different absorption characteristics (e.g. in the far red) (12, 13) may permit dissection of the broad curve into its component Poissonian curves. Current experiments suggest the latter possibility is more correct. Note Added in Proof. In recent experiments at 723 nm, the 02 cross section has been measured to be 2 A2 and the lightsaturation behavior of'the respiratory transient is fit by a curve which is the sum of two'Poissonians with approximately equal contributions of cross sections of 2 A2 and 20 A2 (NL Greenbaum and D Mauzerall 1987 in: J Biggins, ed, Progress in Photosyn-
Plant Physiol. Vol. 84, 1987
thesis Research Vol. II, Martinus Nijhoff Publishers, Dordrecht, pp 65-68). Addition of DCMU results in a single Poissonian with a a of 20 A2, suggesting that the smaller a is due to PSII. However, the amplitude of the oscillation following saturating flashes is undiminished by the inhibitor, i.e. is not decreased by half as would be expected by the above explanation. Thus, assuming DCMU itself is not the cause of the discrepancy, either PSI is heterogeneous or the respiratory effect measures a specific interaction between the two photosystems. LITERATURE CITED 1. FALKOWSKI PG, TG OWENS, AC LEY, DC MAUZERALL 1981 Effects of growth irradiance levels on the ratio of reaction centers in two species of marine phytoplankton. Plant Physiol 68: 969-973 2. GREENBAUM E 1984 Biophotolysis of water: the light saturation curves. Photobiochem Photobiophys 8: 323-332 3. GREENBAUM E, AC LEY, D MAUZERALL 1979 Absolute optical reaction cross sections for photosystem I and photosystem II in green algae. Abstract MPMC8, American Society for Photobiology, 7th Annual Meeting 4. KAWAMURA M, M MIMURA, Y FUJITA 1979 Quantitative relationship between two reaction centers in the photosynthetic system of blue-green algae. Plant Cell Physiol 20: 697-705 5. LEY AC 1984 Effective absorption cross-sections in Porphyridium cruentum. Implications for energy transfer between phycobilisomes and photosystem II reaction centers. Plant Physiol 74: 451-454 6. LEY AC, DC MAUZERALL 1982 Absolute absorption cross-sections for photosystem II and the minimum quantum requirement of photosynthesis in
Chlorella vulgaris. Biochim Biophys Acta 680: 95-106 7. LEY AC, DC MAUZERALL 1986 The extent of energy transfer among Photosystem II reaction centers in Chlorella. Biochim Biophys Acta 850: 234-248 8. MAUZERALL DC 1982 Statistical theory of the effect of multiple excitation in photosynthetic systems. In R Alfano, ed, Biological Events Probed by Ultrafast Laser Spectroscopy. Academic Press, New York, pp 215-235 9. MYERS J, J-R GRAHAM 1983 On the ratio of photosynthetic reaction centers RC2/RCl in Chlorella. Plant Physiol 71: 440-442 10. RIED A 1968 Interactions between photosynthesis and respiration in Chlorella. Biochim Biophys Acta 153: 653-663 11. RIED A 1969 Studies on light-dark transients in Chlorella. In H Metzner, ed, Progress in Photosynthesis Research, Vol I. H. Laupp, Jr., Tubingen, Germany, pp 521-530 12. RIED A 1971 Improved action spectra of light reaction I and II. In G Forti, M Avron, A Melandri, eds, lInd International Congress on Photosynthesis, Stresa, Italy. W. Junk, The Hague, pp 763-772 13. WANG RT, J MYERS 1976 Simultaneous measurement of action spectra and photoreactions I and II of photosynthesis. Photochem Photobiol 23: 411414 14. WEAVER EC, HE WEAVER 1969 Paramagnetic unit in spinach subchloroplast particles: estimation of size. Science 165: 906-907