The official journal version of this paper appears as: Int. J. Inf. Secur. (2009) 8:387-398. Copyright Springer-Verlag 2009. DOI 10.1007/s10207-009-0080-7. The present version is the authors’ personal copy, for personal non-commercial use only.
User interface design affects security: Patterns in click-based graphical passwords . Sonia Chiasson · Alain Forget · Robert Biddle · P.C. van Oorschot
Received: August 7, 2008 / Accepted: April 9, 2009
Abstract Design of the user interface for authentication systems influences users and may encourage either secure or insecure behaviour. Using data from four different but closely related click-based graphical password studies, we show that user-selected passwords vary considerably in their predictability. Our post-hoc analysis looks at click-point patterns within passwords and shows that PassPoints passwords follow distinct patterns. Our analysis shows that many patterns appear across a range of images, thus motivating attacks which are independent of specific background images. Conversely, Cued Click-Points (CCP) and Persuasive Cued Click-Points (PCCP) passwords are nearly indistinguishable from those of a randomly-generated simulated dataset. These results provide insight on modeling effective password spaces and on how user interface characteristics The results of this paper first appeared in preliminary form as Technical Report TR-08-14 (June 16, 2008), School of Computer Science, Carleton University, and in S. Chiasson’s PhD thesis [3] The original publication is available at www.springerlink.com. DOI: 10.1007/s10207-009-0080-7. S. Chiasson School of Computer Science and Human Oriented Technology Lab, Carleton University, Ottawa, Canada E-mail:
[email protected] A. Forget School of Computer Science and Human Oriented Technology Lab, Carleton University, Ottawa, Canada E-mail:
[email protected] R. Biddle School of Computer Science and Human Oriented Technology Lab, Carleton University, Ottawa, Canada E-mail: robert
[email protected] P.C. van Oorschot School of Computer Science Carleton University, Ottawa, Canada E-mail:
[email protected]
lead to more (or less) security resulting from user behaviour. Keywords Usable security · Graphical passwords · Authentication
1 Introduction Users tend to select predictable passwords and tend to reuse passwords across different accounts. This occurs partially because users are unaware of what makes a secure password and partially as a coping strategy since users must remember an ever-increasing number of passwords. Studies have shown that most user-selected passwords suffer from this problem, including text passwords created with different strategies [11, 17, 22] and various graphical password schemes [8, 10, 23, 25]. A password scheme has both a full theoretical password space and an effective password space. The full theoretical password space includes all possible passwords, while the effective password space includes only the subset of passwords likely chosen by users of the system. Ideally, we want the effective password space to be as close as possible to the full theoretical password space. To better understand effective password spaces and the characteristics of user interfaces that can influence users towards more secure behaviour, we analyzed datasets collected through user studies of three different variants of click-based graphical passwords and compared them to a randomly-generated simulated dataset. The simulated dataset represents passwords that would occur if all passwords were equally likely and thus used the full theoretical password space. We chose to examine clickbased graphical passwords because they allow for clear comparisons of user choice, and can provide a simple
2
platform on which to test novel design ideas. Our goal is not to criticize or advocate for specific click-based password schemes, but to use them as an investigative tool. Our analysis is not driven by specific hypotheses, but rather by exploratory post-hoc questions aiming to identify patterns in click-points, and distinguish their presence in the different variant schemes. Our findings can inform the design of other authentication systems, such as applying them to text passwords. In this paper, we take a closer look at the types of patterns that occur in click-based graphical passwords and show that in some cases, these occur regardless of the background image. Our main objective is to study the differences in user choice of passwords between three click-based graphical password schemes, as a function of the different user interfaces presented by these schemes. Our results are based on user studies conducted in a laboratory, under identical conditions, where differences in user choice can attributed to differences in the user interface. Obviously, patterns in user choice reduce the effective password space. We show that the design of the interface impacts whether users select their click-points in predictable patterns and that the security of passwords can be improved through interface design choices. In fact, we show that for user-selected click-points in Cued Click-Points [6] and Persuasive Cued Click-Points [4], the click-point patterns are nearly indistinguishable from randomly selected click-points with respect to the metrics examined in this paper. We suspect that the differences compared to PassPoints [27, 28] are due to design choices such as providing one-to-one cued recall to aid in memorability and dividing the password selection process into several independent tasks. From our results, we note that design choices which subtly alter user selection of passwords cannot be made naively because they may weaken security. These design choices may lead users to employ coping mechanisms, may make it too easy to make insecure choices, or may make the insecure option most logical or most convenient from a user’s perspective. The remainder of the paper is organized as follows. Sections 2 and 3 provide background on user-selected passwords and introduce the click-based graphical password systems corresponding to the datasets analyzed in this paper. Our data analysis is described in Section 4. The paper concludes with discussion of how the design of the user interface can impact both the usability and security of the password scheme.
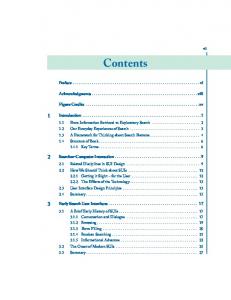
2 Background In investigating the security of an authentication system, its usability must also be evaluated since it can significantly impact the real-world security of the system. User interface design decisions may sway user behaviour, sometimes towards less secure behaviour. This may be a direct result of the particular interface, or may be compounded by external influences. Often, the easiest way of using a system is also the least secure way. An example of this would be choosing very short, simple text passwords as opposed to longer, more complex sequences of characters. Users must select and remember passwords to protect an ever-increasing number of accounts. Systems sometimes provide on-screen advice on how to create more secure passwords (e.g., select something memorable that would be difficult for others to guess), give feedback about password choice (e.g., with a password strength meter), or force users to create passwords that comply with specific system-defined rules (e.g., the password must include both letters and numbers). Despite these strategies, users often select weak passwords. This occurs partially because users misunderstand the advice or requirements, underestimate the risks, and because limitations of human memory mean that they must employ coping mechanisms in order to reduce the burden of remembering so many passwords. These coping mechanisms may include reusing passwords across several accounts, using predictable alphanumeric combinations, or storing passwords in an easily accessible, insecure location. Alternatives to text password systems have also been shown to result in predictable passwords. Davis et al.’s PassFaces [8, 18] study revealed that when given the task of selecting a set of facial images for their password, user choices followed obvious patterns (e.g., attractive females of their own race). Draw-A-Secret (DAS) [16] passwords consist of drawing a free-form picture onto a grid. Users of DAS favoured symmetrical sketches in several user studies [10, 23, 25]. A modification named BDAS [10] introduces a background image to a DAS system and early results show that this may lead to less symmetrical passwords; a closer look at patterns remains to be undertaken. 3 Click-based graphical passwords Based on Blonder’s original idea [1], PassPoints (PP) [27, 28] is a click-based graphical password system where a password consists of an ordered sequence of 5 clickpoints on a pixel-based image (Figure 1). To log in, a user must click within some system-defined tolerance
3
Fig. 2: With CCP, users select one click-point per image. The next image displayed is determined by the current click-point.
Fig. 1: On PassPoints, a password consists of 5 ordered clickpoints on the image (the numbered labels do not appear in practice). Background image reprinted from [12].
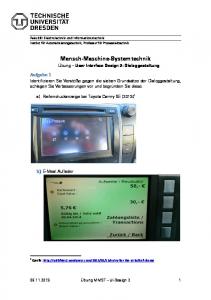
region for each click-point. The image acts as a cue to help users remember their password click-points. Earlier studies [5, 27, 28] show that PassPoints is usable both in lab and field settings. However, it has also been shown [5, 9, 14, 24] that some areas of the images are more popular among users, forming hotspots (areas of the image more likely to be selected by users for their click-points). Attackers can determine likely hotspots by gathering sample passwords on an image or through automated image processing techniques, and then use these to build an attack dictionary of likely passwords. Both these methods have had success at cracking some passwords [9, 24]. Furthermore, Golofit [14] manually categorized different areas of three images based on prominent features (e.g., flat, structural, commonplace, block edges) and shows that user-selected click-points cluster within the areas of the images categorized as “commonplace” or “block edge” based on his classification scheme. In parallel work, Salehi-Abari et al. [21] recently found that automated dictionary attacks where click-points are ordered according to horizontal or vertical lines, or general diagonal direction, were successful on PassPoints passwords. Since PassPoints showed promise as a usable system, we decided to further explore the area. Cued ClickPoints (CCP) [6] was developed as an alternative clickbased graphical password scheme where users select one point per image for 5 images (Figure 2). The interface displays only one image at a time; the image is replaced by the next image as soon as a user selects a click-point. The system determines the next image to display based on the user’s click-point on the current image. The next image displayed to users is based on a deterministic function of the point which is currently selected. This modified design has several security and usability ben-
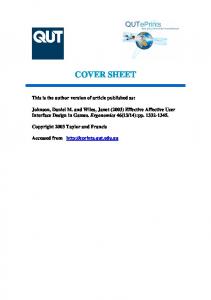
efits. It now presents a one-to-one cued recall scenario where each image triggers the user’s memory of the one click-point on that image. Secondly, if a user enters an incorrect click-point during login, the next image displayed will also be incorrect. Legitimate users who see an unrecognized image know that they made an error with their previous click-point. Conversely, this implicit feedback is not helpful to an attacker who does not know the expected sequence of images. A lab-based user study [6] showed CCP had similar usability to PassPoints, but showed that although hotspots are slightly less likely to occur in CCP than PassPoints, they do still occur. The advantage is that there are now hundreds or thousands (depending on system configuration) of images that attackers must first acquire and analyze individually as they do not know which images belong to a user’s password. This increases the effort needed to mount an attack compared to one image for PassPoints. To address the issue of hotspots, Persuasive Cued Click-Points (PCCP) was proposed [4]. As with CCP, a password consists of 5 click-points, one on each of 5 images. During password creation, most of the image is dimmed except for a small viewport area that is randomly positioned on the image (Figure 3). Users must select a click-point within the viewport. If they are unable or unwilling to select a point in the current viewport, they may press the Shuffle button to randomly reposition the viewport. The viewport guides users to select more random passwords that are less likely to include hotspots. A user who is determined to reach a certain click-point may still shuffle until the viewport moves to the specific location, but this is a timeconsuming and more tedious process. In effect, PCCP makes selecting a stronger password the “path-of-leastresistance” because choosing from the first offered viewport is quickest and simplest, as well as most random. The system does not rigorously constrain user choice, but makes it more difficult to behave insecurely. The viewport is only applied during password creation; subsequent logins operate the same as CCP. This feature may be compared to password policies for text pass-
4
words, but they differ on an important point: if a text password policy requires a symbol, the user is obliged to include a symbol within the password and cannot proceed until the requirement is met. With PCCP, users are free to select any click-point on the image, but the system encourages users to select a click-point from the first (or first few) viewport positions. Our user study [4] indicates most users do follow the systems’ suggestions in this way, and that users are still able to recall their resulting passwords. We found that PCCP significantly reduced the appearance of hotspots and had click-point clustering levels approaching that of a random distribution.
Fig. 3: The PCCP password creation interface. Users must select a click-point from the randomly-positioned highlighted viewport or press the Shuffle button to randomly reposition the viewport.
In separately reported work, we conducted user studies on each of the click-based graphical passwords discussed above. Lab studies using identical methodology were done for all three systems [4–6]. These studies showed that PassPoints, CCP, and PCCP were usable systems with acceptable memorability and reported on preliminary security analyses. This current paper analyzes these datasets to further identify differences in user choice that may affect security.
3.1 Data Collection The lab studies of PassPoints, CCP, and PCCP [4–6] focused on a core set of 17 images. CCP and PCCP required a larger pool of images, so a set of 330 images was used, which included the 17 from the core set. We also manipulated the selection algorithm so that each user saw all 17 core images.1 To be consistent with the original PassPoints user studies [27,28], the images were of size 451 × 331 pixels, the tolerance region around click-points was 19 × 19 pixels, and passwords consisted of 5 click-points. Users came to the lab for individual 1-hour sessions during which they completed as many trials as time permitted. A trial involved creating, confirming, and logging in with a new password; it consisted of the following steps: 1. Create: Users created a password by clicking on 5 click-points. With PassPoints, these click-points were on one image; with CCP and PCCP, users saw a sequence of 5 images. 2. Confirm: Users confirmed their password by re-entering their 5 click-points. If they made a mistake, they had the options of re-trying as many times as they wished, resetting their password (returning to step 1), or skipping this trial. 3. Questionnaire: Users answered two questions pertaining to their newly created password, giving their perception of how easy this password would be to remember in a week and how easy it was to create the password. 4. Distraction task: As established in psychology studies [13], users spent at least thirty seconds completing an MRT puzzle [19] to simulate a longer passage of time and to clear visual working memory. 5. Login: Users re-entered their password. They could retry if they made mistakes, reset their password (return to step 1), or skip the trial if they were unable to remember their password. Our analysis compares data from our three lab studies: PassPoints (PP), Cued Click-Points (CCP), and Persuasive Cued Click-Points (PCCP). Table 1 summarizes the number of participants, passwords, and individual click-points collected. More points per image were collected for PassPoints (PP) since each user’s password gave 5 click-points on an image whereas for CCP and PCCP, there was only one click-point per image. 1 This weighted image selection algorithm was not in place for the first few CCP participants. The system displayed random images and users may not have seen all 17 core images. This was modified for later participants of CCP and was in place for all of PCCP participants.
5
Table 1: Number of participants, click-points, and passwords per lab study. Note that only passwords where users were successfully able to confirm and login are used in our analysis and included in this table.
Study PassPoints (PP) CCP PCCP
Number of participants
Total number of click-points
Total number of passwords
43 57 39
2800 2520 1500
560 504 300
For PassPoints, we also previously conducted a field study (PPField) [5] where 191 participants used a webbased PassPoints system for accessing their class notes for 7-9 weeks. Two images, Pool and Cars (Figures 12a and 12b), were selected from the core set for use in the field study because they had performed well during lab testing. We collected 116 passwords (580 click-points) on the Pool image and 109 passwords (545 click-points) on the Cars image. In some cases, we collected more than one password per user because users were allowed to change their password during the semester. Besides analyzing the datasets for patterns, we wanted to see whether the datasets differed from randomlygenerated datasets. For this, we used a modified MonteCarlo approach of generating simulations. For each study (PP, CCP, PCCP, PPField), we generated 100 simulated datasets, each containing the same number of passwords as the corresponding original dataset. Each password consisted of 5 pairs of (x,y) coordinates, corresponding to 5 click-points. These simulated datasets approximate passwords taken from the full theoretical password space, where all passwords are equally probable. They were generated using R’s [15] random number generator function for uniform distributions (runif()). In the present paper, we are using these datasets to explore a new question: how does user interface design affect security in these similar graphical password schemes, and what patterns of user choice emerge as a result of the different interfaces?
4 Analysis of User Choice Patterns in user choice reduce the effective password space and are advantageous to attackers who can use this knowledge to modify their attack strategy and increase the likelihood of success. Previous studies [4,9,14, 24, 26] show that when attackers know the images used to create passwords, they can determine likely hotspots and use this information to successfully attack PassPoints and CCP passwords. In the following sections we show that, surprisingly, patterns emerge even without knowing the images. We look at several different password characteristics to see which ones reveal pat-
terns that could help attackers fine-tune their attack strategy. We focus mainly on data from the lab studies because the methodologies are the same and the studies cover a wide range of images, reducing the risk of getting results that are an artifact of a particular image. In the following analysis, data from the three lab studies (PassPoints, CCP, and PCCP) are examined and compared against the randomly-generated datasets. The number of passwords and individual click-points for each dataset is available in Table 1. Unless otherwise indicated, all analyses of PassPoints refers to the dataset from the lab study (not the field study also mentioned in Section 3.1). For each measure in the following analysis, we also calculated the results for each of the simulated datasets. We then determined the maximum and minimum median values among the 100 simulated datasets corresponding to a given study. These minima and maxima indicate the range of random values. There is a 99% probability that any collected result falling outside of this range did not occur by chance. This is because each simulation represents a chance to include the observed value. If this does not happen after 100 simulations, this suggests that there is less than one chance in 100 that it might do so at random. Therefore if median values for our real datasets fall outside of this minimummaximum range, it is likely because some pattern exists in the dataset that did not occur by chance. In all of the subsequent figures, we have represented these minima and maxima as lines, to more clearly observe patterns, but the data is not continuous. Three additional standard statistical tests are used in analyzing whether differences in the data reflect actual differences between conditions or whether these may have occurred by chance. In all cases, a value for p < .05 signifies that the groups being tested are different from each other with at least 95% probability, making the result statistically significant. Fisher’s F test compares variance of the means between more than two groups. In F (a, b), a represents the between-groups degrees of freedom (df) and b indicates the within-groups df. T-tests are used to compare the variance of the means between two groups. In t(c), c represents the
6
df. If the df for a t-test includes a decimal point, it is because Levene’s Test indicated that equal variances could not be assumed, and so a Welch Two-Sample ttest was used instead. Chi-square tests (χ2 ) compare the probability distributions of two or more samples of non-ordered categorical data. In χ2 (d, N = e), the d represents the df and e provides the sample size. In all cases we show the relevant statistic, and then the p-value that it indicates. In post-hoc analysis, it is important to avoid the misleading situation where many directions are pursued, but only those which lead to significant results are reported. Although we omit the precise statistical test values and p-values for insignificant results, we report on all of our pattern investigations, regardless of their results.
4.1 Click-point distribution Are click-points distributed in some recognizable manner independent of the background image? We found that when selecting 5 click-points on a single image (as in PassPoints), users tend to select their first point towards the top-left of the image and progressively move towards the bottom-right with each subsequent clickpoint. This was not the case when users only selected one click-point per image (as per CCP and PCCP). Figure 4 shows the distribution of click-points along the x-axis of the image.2 The origin (0,0) is at the bottom-left of the image. The box plots represent the original datasets, while the blue and red lines respectively represent the minimum and maximum median values for the random simulations. As explained in Section 4, if the medians for the real datasets fall outside of the lines, then this pattern did not occur by chance with 99% probability. With PassPoints, there is a clear progression from the left side of the image for the first click-point towards the right for fifth clickpoint (see Figure 4). The same occurs for the y-axis, as demonstrated in Figure 5; PassPoints click-points progress from the top of the image towards the bottom. Note that our participants were volunteers from an environment where Western (top-down, left-right) writing and reading is dominant; we suspect that a tendency towards right-to-left or other distributions may be evident in other cultures. With CCP and PCCP, the click-points are quite uniformly distributed along both 2 Notched box plots can be interpreted as follows. The thick line in the narrowest part of the box represents the median. The box represents the centre quartiles (25th to 75th percentile). The notches surrounding the median represent the confidence intervals. If the notches of two boxes do not overlap, then they are significantly different from each other at p < .05.
the x- and y-axes, regardless of the click-point number, as Figures 4 and 5 also illustrate. For PassPoints, the medians fall outside of the random range for three of the five click-points, while all of CCP and PCCP’s medians fall within range of the simulated datasets. Regression analysis shows that for PassPoints, there exists a strong relationship between the click-point number and its position on the x- and y-axes. For the x-axis, F(4, 2795)=123.7 and p < .0001, and F(4, 2795)=30.2 and p < .0001 for the y-axis. No such relationship exists for CCP, PCCP, or the simulated datasets. With PassPoints, it is possible to determine which areas of the image are more likely to contain clickpoints based entirely on the click-point number, without knowledge of the image used. For example, looking at Figure 4 we see that 75% of the first click-points fall within the first 200 pixels (out of 451 pixels) on the x-axis. Contrarily, the click-point number is not a predictor of click-point location for CCP and PCCP.
4.2 Segment lengths We next looked at the length of the segments formed between two adjacent click-points. If attackers can predict the likely distance between click-points, they could prioritize guesses containing click-points that are approximately that distance apart. Figure 6 illustrates the distance in pixels between adjacent click-points in each dataset. For example, in PassPoints, the median segment length is 87 pixels while the median for CCP is 193 pixels. Adjacent click-points in PassPoints are more closely positioned, with very few individual segments spanning the entire image. For segment length, the PassPoints click-point distribution is statistically different from the simulated datasets (t(2288.92)= 45.30, p < .0001)). An attacker may be able to use this information to predict higher probability click-point combinations, again even without knowledge of the specific image. On the other hand, CCP segment lengths are more evenly distributed and are indistinguishable from those of the simulated datasets. The PCCP dataset, however, appears distinct from the simulated datasets for segment lengths (t(1231.89)=14.17, p < .0001). Figure 6 confirms that PCCP segments are shorter (median of 160 pixels) than those of the random sets. We were surprised by this result and suspect that it may have occurred as a side-effect of the viewport positioning algorithm, or it may be that users were more likely to select a click-point towards the center of the viewport and so the edges of the image were less likely to be selected.
7
●
●
●
1
2
3
4
5
●
●
●
●
●
1
2
3
4
5
●
●
●
●
●
1
2
3
4
5
0
0
0
300
●
100
●
PCCP
100
300
300
CCP
100
Pixels
PP
Fig. 4: The box plots show the distribution of click-points along the x-axis of the image, grouped and ordered by click-point number for the three original datasets. The image dimensions were 451 × 331, therefore 451 is the maximum possible x-coordinate. The red line (with circles) and the blue line (with triangles) represent the maximum and minimum median values among the simulation datasets, respectively.
1
2
3
4
5
300 ●
●
●
●
●
1
2
3
4
5
200
●
●
●
●
●
●
1
2
3
4
5
0
0
100
●
200
●
100
200
●
100
●
0
Pixels
PCCP
300
CCP
300
PP
Fig. 5: The box plots show the distribution of click-points along the y-axis of the image, grouped and ordered by click-point number
Pixels
4.3 Angles and slopes ●
●
●
PP
CCP
PCCP
0
50
100 150 200 250 300
for the three original datasets. The image dimensions were 451 × 331, therefore 331 is the maximum possible y-coordinate. The red line (with circles) and the blue line (with triangles) represent the maximum and minimum median values among the simulation datasets, respectively.
Fig. 6: The box plot shows the distance in pixels between two adjacent click-points in a password (segment length) for the 3 original datasets. The red line (with circles) and the blue line (with triangles) represent the maximum and minimum median values among the simulation datasets, respectively.
We also examined whether the segment number had any effect on segment length. Segment lengths appear consistent regardless of their position within the password (Figure 7). Regression analysis confirmed that there were no statistically significant relationships between segment number and segment length for any of the datasets.
Users of PassPoints tend to create a straight line with their click-points, as evidenced in Figure 8.3 The PassPoints diagram shows that the most common angles formed between two line segments are near 0 degrees, indicating that the users often selected click-points in a straight line, heading in the same direction. In comparison, CCP, PCCP, and the simulated datasets favour large angles resulting from back and forth motion between click-points. The distribution of segment slopes relative to the xaxis in PassPoints (Figure 9) shows that users strongly favour horizontal lines (0 degree slopes), followed by vertical segments in the downward direction (270 degree slopes). The slopes for the CCP and PCCP datasets are quite evenly distributed, which matches the slopes from the simulated datasets. Of the three systems, only PassPoints is distinct from the simulated datasets. We further investigated whether angle number or slope number had any effect on the angle or slope respectively. We found no evidence of such interaction. In 3 Figures 8, 9, and 16 use circular diagrams to summarize angle data. These can be interpreted as circular frequency distribution diagrams. They appear flattened due to the rectangular shape of the images (451 × 331 pixels) from which this data was collected.
8
2−3
3−4
4−5
300 ●
●
●
1−2
2−3
3−4
4−5
200
1−2
●
●
●
●
●
1−2
2−3
3−4
4−5
0
0
100
●
200
●
100
200
●
100
●
0
Pixels
PCCP
300
CCP
300
PP
Fig. 7: The box plots show the segment lengths grouped by segment number for the 3 original datasets. The red line (with circles) and the blue line (with triangles) represent the maximum and minimum median values among the simulation datasets, respectively.
(a) PassPoints (PP)
(b) CCP
(c) PCCP
Fig. 8: Frequency distribution of the angle (in degrees) formed between two adjacent line segments. These line segments are formed by joining two consecutive click-points in a password. The grey bars and black line represent the original dataset. The red dotted line and the blue dashed line represent the maximum and the minimum median values among the simulated datasets, respectively. other words, the likelihood of finding a given angle (or slope) was not impacted by its ordinal position within the password.
Chi-square tests revealed no statistically significant difference between either of the CCP and PCCP datasets and their corresponding simulated datasets.
4.4 Shapes
4.5 Analysis of our PassPoints field study (PPField)
We also looked at shapes formed by all 5 click-points and the line segments between adjacent points. Our classification scheme identified 5 different categories of patterns, as detailed in Table 2 and Figure 10. For example, click-points may form a W-shape pattern. A password was classified into this category if the line segments formed this particular pattern, regardless of orientation; a sideways or upside down W was still considered a W, as illustrated in Figure 10. The password shapes were identified by following the path formed from the first to last click-point sequentially, as entered by the user. Once again, we found that the PassPoints dataset was easily distinguishable from the simulated datasets (χ2 (5,56560)=6798.67, p < .0001).4 PassPoints includes simpler shapes, with far more passwords forming lines and V-shape patterns. Figure 11 reveals how PassPoints is distinct from CCP, PCCP, and the simulated datasets.
The PassPoints field study [5], as previously mentioned, offers an opportunity to look at “real-world” passwords used over an extended period of time. It provides evidence of the types of passwords that one may expect to see if such a system was deployed. However since only two images were used, the patterns may be a direct result of the Pool (Figure 12a) and Cars (Figure 12b) images. We present the patterns found, but caution that further work is required to determine whether these occur across different images as well. Figure 13 reveals that in the PassPoints field study, the click-point number has an effect on the x-coordinates of the click-points but not on the y-coordinates. The lack of interaction for the y-axis is likely a result of the Cars image since users frequently selected their clickpoints in a horizontal line across a row of cars. This is further supported by Figure 14 which shows that 24% of passwords followed a straight line. A further 17% had only one bend, forming a V-shape. Figure 16 also shows users’ preference for straight lines since the most popu-
4
The degrees of freedom shown relate to all samples, including those that were randomly generated.
9
(a) PassPoints (PP)
(b) CCP
(c) PCCP
Fig. 9: Frequency distribution of the slope (in degrees) of each line segment, relative to the x-axis. Line segments are formed by joining two consecutive click-points in a password. The grey bars and black line represent the original dataset. The red dotted line and the blue dashed line represent the maximum and the minimum median values among the simulated datasets, respectively.
Table 2: Shape classification scheme Shape
Description
Line W
The sum of the absolute values for all 3 angles is less than 15 degrees. Angle 1 and angle 3 have the same sign (turn in the same direction) and angle 2 has the opposite sign. Two of the angles have opposite signs (turn in opposite directions) and the third angle is less than 15 degrees (forms a straight line). Two of the angles are less than 15 degrees and the third angle is greater than 15 degrees. All 3 angles have the same sign (turn in the same direction) and the sum of the absolute values for all 3 angles is greater than 180. Anything that does not fall into the above patterns, i.e.,“no known pattern”.
Z V C Other
Fig. 10: Examples of the click-point patterns for each category. These represent the path formed by the sequence of points as entered by the user, proceeding in constant direction from one end of the pattern to the other.
50
●
W
Z
20
●
W
Z
C
Other
● Line
● V
0
● V
0
● Line
●
●
●
C
Other
●
10
20
●
10
●
40
●
30
40
●
30
●
30 20
Percentage
40
●
10 0
PCCP
50
CCP
50
PP
C
Other
● Line
● V
W
Z
Fig. 11: The bar graph shows the percentage of passwords that fall into each shape category for the 3 original datasets. The red line (with circles) and the blue line (with triangles) represent the maximum and minimum median values among the simulation datasets, respectively.
10
(a) The Pool image [20]
(b) The Cars image [2]
Fig. 12: Images used in the PassPoints Field (PPField) study
●
●
C
Other
●
●
●
●
●
1
2
3
4
5
30
40 ●
●
20
●
●
10 1
2
3
4
5
● Line
● V
W
Z
Fig. 14: The bar graph shows the percentage of passwords that fall into each shape category for the PassPoints Field study. The red line (with circles) and the blue line (with triangles) represent the maximum and minimum median values among the simulation datasets, respectively.
The median segment length for the PassPoints field study matches the median for the PassPoints lab study (Figure 15). This shows that even in the field study, users still tended to select adjacent click-points in close proximity to each other. The PassPoints field data certainly exhibits clickpoint patterns; although some of these may be sideeffects of the Pool and Cars images. We suspect that they may also be partially attributed to users trying to select more memorable and simple passwords since they had to remember PassPoints passwords over a longer period of time, and because they had to actually use their passwords on a regular basis to access their class notes. This serves as further cautionary evidence that user behaviour tends towards the easiest path when using authentication systems in a practical setting.
●
PPLab
PPField
50
150
●
0
lar angles and slopes are very near 0 degrees. The slopes diagram (Figure 16b) further highlights that users preferred horizontal or vertical directions, with peaks near 0, 90, 180, and 270 degrees.
Pixels
250
Fig. 13: The box plots show the distribution of click-points for the PassPoints field study along the x- and y-axes of the image, grouped and ordered by click-point number. The image dimensions were 451 × 331, therefore 451 is the maximum possible x-value and 331 is the maximum y-value. The red line (with circles) and the blue line (with triangles) represent the maximum and minimum median values among the simulation datasets, respectively.
0
●
Percentage
250 ●
150
●
0 50
Pixels
PPField Y
0
100 200 300 400
PPField X
50
PPField
Fig. 15: The box plots represent the line segment lengths for the PassPoints lab (PPLab) and PassPoints field (PPField) studies. Line segments are formed by joining two consecutive click-points in a password. The red line (with circles) and the blue line (with triangles) represent the maximum and minimum median values among the simulation datasets, respectively.
5 Discussion and Conclusion Previous studies [5,9,14,24,26] have shown that hotspots occur in PassPoints and provide some evidence of clickpoint patterns [21]. Our present analysis provides considerably more evidence of click-point patterns. Our analysis revealed that click-point coordinates, segment
11
(a) PassPoints Field Angles
(b) PassPoints Field Slopes
Fig. 16: Frequency distributions of angles between segments and segment slopes for the PassPoints field study. There are more data points in the slopes diagram since each password contains 4 slopes and only 3 angles, making the slopes diagram appear slightly larger than the angles diagram. The grey bars and black line represent the PPField dataset. The red dotted line and the blue dashed line represent the maximum and the minimum median values among the simulated datasets, respectively. Table 3: Summary of hotspots and patterns in click-based graphical passwords Measure Hotspots Patterns
PP Yes Yes
CCP Yes No
PCCP No No
lengths, angles between segments, segment slopes, and shapes formed by click-points can all be used to identify patterns in user passwords when all click-points are on a single image. Interestingly, these same patterns were not apparent when click-points within a password were based on distinct images. For example, users of PassPoints prefer straight lines, with click-points that are roughly evenly spaced across the image, starting from left to right, and either completely horizontal or sloping from top to bottom. These patterns appeared across a wide range of images, suggesting that attackers may benefit from strategies which attempt to leverage the patterns, independent of specific background images. Conversely, CCP and PCCP do not display these same patterns and are very similar to the randomlygenerated datasets based on the pattern characteristics analyzed in this paper. We note that there may exist other patterns, which we have not examined, and that different results may occur in a long-term usability study of CCP and PCCP. In click-based graphical passwords, hotspot information may be combined with knowledge of common click-point patterns. We expect that knowledge of likely patterns could be effectively used to prioritize a dictionary of passwords comprised entirely of (or biased towards) component click-points found to attract attention, e.g., hotspots. As shown in recent work [21], a dictionary of passwords could also be constructed based solely on the patterns, without knowledge of the particular image. Not all images will have the same suscep-
tibility to every type of pattern. However, the patterns identified are sufficiently prevalent that attackers trying to launch an automated attack on PassPoints would have an advantage by prioritizing passwords that follow the simple patterns identified in this paper. For PassPoints, using these patterns will likely give attackers an advantage even without having to analyze specific images. Table 3 summarizes the susceptibility of each scheme to hotspots and patterns. All three schemes (PassPoints, CCP, and PCCP) are based on the same fundamental idea that a password consists of 5 ordered click-points while the image (or images) acts as a cue to remember the click-points. Nonetheless, our results indicate important differences in usage which lead to patterns that a conservative defender must expect to be exploitable by attackers. With PassPoints, users receive one image as a cue and must recall 5 click-points. This may be a more challenging cognitive task and it may be that users resort to click-point patterns in an effort to cope. Alternatively, asking users to select 5 click-points on one image may simply encourage the creation of patterns because it is the easiest strategy. If this is the case, the mere fact that a password consists of 5 clicks on one image leads to insecure behaviour and design choices such as “what type of images” become less significant, since the system is inherently less secure. With CCP and PCCP, each image provides a cue for the corresponding click-point. The one-to-one relationship may be easier for users to remember, therefore reducing the tendency towards selecting an overall geometric pattern formed by the click-points. Also, as each image appears on the screen, it forces users to refocus and take in the new stimulus which may interrupt the thought process for forming a pattern. PCCP further tries to persuade users to select more random points through the viewport, making it much less conve-
12
nient to select hotspots. Consequently, the easiest path is most secure. Overall, we note that the implications of design choices need to be carefully considered when making securityrelated modifications to a graphical password design or user interface. For example, adding a sixth click-point to PassPoints may provide less of a security improvement than adding a click-point to PCCP. With PassPoints, our results suggest that an extra click-point is likely to extend an existing click-point pattern, whereas in PCCP the extra click-point would add considerably more randomness to the password. User choice is heavily influenced by the design of the system. Previous work focused on how image choice led to the formation of hotspots. We show that relatively minor changes in the type of cueing used and feedback provided by the system can lead to a significant reduction in the occurrence of patterns, regardless of image choice. In the case of click-based graphical passwords, it appears that having multiple images within a password is a main factor in reducing patterns in user-selected passwords. We are currently investigating what parallels exist with text passwords and hope that the insight gained from graphical passwords can be applied to other types of passwords or usable security systems in general.
8. Davis, D., F. Monrose, and M.K. Reiter. On User Choice in Graphical Password Schemes. 13th USENIX Security Symposium, 2004. 9. Dirik, A.E., N. Menon, and J.C Birget. Modeling user choice in the PassPoints graphical password scheme. ACM Symposium on Usable Privacy and Security (SOUPS), 2007. 10. Dunphy, P., and J. Yan. Do Background Images Improve “Draw a Secret” Graphical Passwords? ACM Computer and Communications Security (CCS), 2007. 11. Florencio, D., and C. Herley. A Large-Scale Study of Web Password Habits. ACM International World Wide Web Conference (WWW), 657-666, 2007. 12. FreeImages.com. http://www.freeimages.com Last accessed: February 2008. 13. Goldstein, E.B. Cognitive Psychology, Wadsworth Publishing, 150-161, 2006 14. Golofit, K. Click Passwords Under Investigation. European Symposium on Research in Computer Security (ESORICS), LNCS 4734, 343-358, 2007. 15. Ihaka, R., and R. Gentleman. R: A Language for Data Analysis and Graphics. Journal of Computational and Graphical Statistics, 5(3), 299-314, 1996. 16. Jermyn, I., A. Mayer, F. Monrose, M.K. Reiter, and A.D. Rubin. The Design and Analysis of Graphical Passwords. 8th USENIX Security Symposium, 1999. 17. Kuo, C., S. Romanosky, and L.F. Cranor. Human Selection of Mnemonic Phrase-based Passwords. ACM Symposium on Usable Privacy and Security (SOUPS), 2006. 18. Passfaces. http://www.realuser.com Last accessed: December 1, 2006. 19. Peters, M. Revised Vandenberg & Kuse Mental Rotations Tests: forms MRT-A to MRT-D. Technical Report, Department of Psychology, University of Guelph, 1995. 20. PD Photo. http://pdphoto.org/ Last accessed August 2007. Acknowledgements The authors thank anonymous referees whose 21. Salehi-Abari, A., J. Thorpe, and P.C. van Oorschot. On comments have helped improve the clarity of this paper. The Purely Automated Attacks and Click-Based Graphical Passthird author acknowledges funding of a Discovery Grant through words. 24th Annual Computer Security Applications Conferthe Natural Sciences and Engineering Research Council of Canada ence (ACSAC), 2008. (NSERC). The fourth author is Canada Research Chair in Net22. St. Clair, L., L. Johansen, W. Enck, M. Pirretti, P. Traynor, work and Software Security, and acknowledges NSERC funding of P. McDaniel, and T. Jaeger. Password Exhaustion: Predicting this chair, a Discovery Grant, and a Discovery Accelerator Supthe End of Password Usefulness. International Conference on plement. Partial funding from the NSERC Internetworked SysInformation Systems Security (ICISS), Springer-Verlag, 37-55, tems Security Network (ISSNet) is also acknowledged. 2006. 23. Tao, H. Pass-Go, a New Graphical Password Scheme. M.S. thesis, School of Information Technology and Engineering, University of Ottawa, Canada, 2006. References 24. Thorpe, J., and P.C. van Oorschot. Human-Seeded Attacks and Exploiting Hot-Spots in Graphical Passwords. 16th 1. Blonder, G.E. Graphical Passwords. United States Patent USENIX Security Symposium, 2007. 5,559,961. 1996. 25. van Oorschot, P.C., and J Thorpe. On Predictive Models 2. Britton, Ian. http://freefoto.com Last accessed Feb. 2007. and User-Drawn Graphical Passwords. ACM Transactions on 3. Chiasson.S. Usable Authentication and Click-Based Graphical Information and System Security (TISSEC), 10(4), Article Passwords. PhD Thesis, School of Computer Science, Carleton 17, 1-33, January 2008. University, Ottawa, Canada, 2008. 4. Chiasson, S., A. Forget, R. Biddle, and P.C. van Oorschot. 26. van Oorschot, P.C., and J. Thorpe. On Predicting and Influencing Users Towards Better Passwords: Persuasive Cued Exploiting Hot-Spots in Click-Based Graphical Passwords. Click-Points. HCI 2008. British Computer Society. September School of Computer Science, Carleton University Technical 2008. Report TR-08-21, November 2008. 5. Chiasson, S., R. Biddle, and P.C. van Oorschot. A Second 27. Wiedenbeck, S., J.C. Birget, A. Brodskiy, and N. Memon. Look at the Usability of Click-based Graphical Passwords. Authentication Using Graphical Passwords: Effects of TolerACM Symposium on Usable Privacy and Security (SOUPS), ance and Image Choice. ACM Symposium on Usable Privacy 2007. and Security (SOUPS), 2005. 6. Chiasson, S., P.C. van Oorschot, and R. Biddle. Graphical 28. Wiedenbeck, S., J. Waters, J.C. Birget, A. Brodskiy, and N. Password Authentication Using Cued Click Points. European Memon. PassPoints: Design and longitudinal evaluation of a Symposium on Research in Computer Security (ESORICS), graphical password system. International Journal of HumanLNCS 4734, pp.359-374, 2007. Computer Studies 63, 102-127, 2005. 7. Cranor, L.F., and S. Garfinkel. Security and Usability. O’Reilly Media, 2005.