range control, power control, wireless networks, probabilistic modeling ... is quite high, ranging by 2 orders of magnitude from 1 to over 100/m ... node density and sending rate follow poisson distributions, all nodes ... found in sensor networks.
Poster Abstract: Using Adaptive Range Control to Optimize 1-Hop Broadcast Coverage in Dense Wireless Networks ∗
Xiaoyan Li, Thu D. Nguyen, Richard P. Martin Department of Computer Science, Rutgers University 110 Frelinghuysen Rd, Piscataway, NJ 08854 {xili,
tdnguyen, rmartin}@cs.rutgers.edu
Categories and Subject Descriptors
protocols. This metric stands in contrast to most existing range control works, which try to minimize energy consumption [4], maintain network connectivity [1, 5] or maximize spatial reuse in terms of unicast traffic [3].
C.2.1 [ Computer-Communication Networks ]: Network Architecture and Design—Wireless communication; I.6 [ Computing Methodologies ]: Simulation and Modeling—Model Validation and Analysis
2. DISTRIBUTED RANGE CONTROL General Terms
Our proposed approach is for each node to infer its local environment, i.e., density and packet rate, by passive observation, and then via power control, set its range to the optimal value predicted by a probabilistic model, which will produce the maximum expected coverage in the particular environment.
Algorithms, Design, Experimentation, Performance
Keywords range control, power control, wireless networks, probabilistic modeling, broadcast, coverage
1.
2.1 Probabilistic Model We developed an analytic model of expected coverage based on the packet rate, density and radio range. We can then solve for the radio range which results in maximum expected coverage for a particular environment. The assumptions we made to construct the analytic model include: node density and sending rate follow poisson distributions, all nodes use the same range, and transmissions reception ability follows a perfect circle/sphere. The simplifications enable us to model wireless communication geometrically, as well as model CSMA collisions as intersecting circles. With the further simplification that send rates outside the transmission circle follow a poisson distribution regardless of CSMA, the model can compute the optimal range numerically. We then follow 2 approximations to relate density to coverage (a longer range in a sparser network is equivalent to a shorter range in a denser network) and packet rate to coverage (a higher packet rate in a sparser network is equivalent to a lower packet rate in a denser network), which allows the extrapolation of the optimal range for any density and packet rate from a pre-computed optimal point. We validated the model through simulation and show that in spite of the numerous simplifications, the model predicts the optimal range setting to within 20% across an order of magnitude of rates and densities which could be realistically found in sensor networks.
MOTIVATION
As technology trends continue to reduce the size, power consumption and cost of embedded networked sensors, they are rapidly approaching the small size and low cost necessary to allow a much wider range of novel usage. The resulting tremendous growth in sensor networks applications predicates increases in both scale and density for their wireless networks. Our initial measurements of an active tagging application, i.e., representing the state of everyday objects, within a common indoor environment shows that the average degree of such a network could easily range up to several hundred. In addition, the variance of object density is quite high, ranging by 2 orders of magnitude from 1 to over 100/m3 . The characteristics of future sensor networks large scale, high densities and large variances - compounded with the fundamental broadcast nature of wireless networks poses a challenge for these systems: how to manage channel capacity to ensure good performance. Our work [2], in particular, considers the problem of how nodes within such dense networks can maximize the number of 1-hop receivers of a broadcast message, which we call the broadcast coverage problem. We choose broadcast coverage as a metric because broad classes of routing, localization and discovery protocols rely on periodic or aperiodic single hop broadcasts, and coverage is an important metric for such
2.2 Distributed Algorithm
∗ This work was supported in part by NSF grant EIA-9986046 and DARPA contract N66001-00-1-8953.
To actually use the model and extrapolation rules at runtime, each node has to infer its environment (especially density, since we assume a constant packet rate). The challenges in doing this arise from several factors. First, if the range setting results in either a too sparse or too dense network,
Copyright is held by the author/owner. SenSys’03, November 5–7, 2003, Los Angeles, California, USA. ACM 1-58113-707-9/03/0011.
314
X span(m) 7.62
Y span(m) 13.4112
Z span(m) 8.1534
number of nodes 3162
λp (pkts/sec) 0.2
range (m) 1.0
min out-degree 1
max out-degree 143
Frequency in Percentage (%)
10
Percentage to all nodes (%)
Table 1: Parameters and initial settings of the non-uniform density network. Initial Final
8 6 4
100 80 60 40 20 0 0
2
5
10 Range (m)
15
20
(a) Uniform network: density=0.006/m3 , random initial range
30
40 50 60 70 time (100 secs)
80
90 100
[0,2) has estimation
(a) No range control Percentage to all nodes (%)
Freqency in Percentage (%)
25
20
Error (m) [0,0.2) [0,0.5) [0,1)
0 0
10
Initial Final
20 15 10
100 80 60 40 20 0 0
5
10
20
30
40
50
60
70
80
90 100
time (100 secs) Error (m) [0,0.2) [0,0.5) [0,1)
0 0
20
40
60
80
100
120
140
160
Nodes out-degree
[0,2) has estimation
(b) Non-uniform network, initial range = 1m
(b) With range control
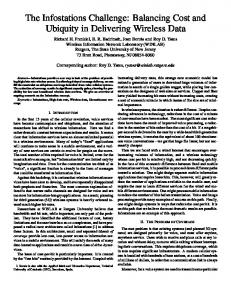
Figure 1: Simulation results for range adjustment. Packet rate = 0.2 pkt/sec
Figure 2: Localization accuracy vs. time under nonuniform density. Each line represents the percentage of nodes which can localize within that error range.
the observed symptom is the same, i.e., the number of observed neighbors will be too small. However, the correct range adjustment is opposite in the two cases. Second, outliers and skewed distance distributions adversely distort the density computation if not accounted for. Third, whether or not a node can observe a neighbor depends not on its range, but rather depends on its neighbor’s range,which is out of its control. Finally, with different ranges, fairness under CSMA can become an issue. We currently use techniques such as collision monitoring, outlier consideration, warmup periods and occasional longer range messages to provide accurate observations with minimal overhead. With simulation, we show that the density observation problem can be addressed by expanding the transmission range for just 2% of the broadcast without any extra message exchanges.
3.
is able to adjust the range to obtain good coverage even for highly non-uniform densities. Figure 2 shows the results of nodes in the same nonuniform network running a localization algorithm with an additional 40 evenly distributed landmarks. In this algorithm, each node gathers landmark or neighbor position estimations and performs trilateration. If a node trilaterates successfully, it broadcasts its position. As shown in the result, without range control, 70% of the nodes could not get enough information to start trilateration. While using range control, around 60% of the nodes can localize to within 1m.
4. REFERENCES [1] V. Kawadia and P. R. Kumar. Power control and clustering in ad hoc networks. In INFOCOM, 2003. [2] X. Li, T. D. Nguyen, and R. P. Martin. Using Adaptive Range Control to Optimize 1 Hop Broadcast Coverage in Dense Wireless Networks. Technical Report DCS-TR-529, Rutgers University, Department of Computer Science, Jul. 2003. [3] J. Monks, V. Bharghavan, and W. mei W. Hwu. A power controlled multiple access protocol for wireless packet networks. In INFOCOM, pages 219–228, 2001. [4] S. Singh and C. Raghavendra. Power efficient MAC protocol for multihop radio networks. In Proc. of IEEE PIRMC’98 conf. Vol 1, pp. 153-157, Sep. 1998. [5] R. Wattenhofer, L. Li, P. Bahl, and Y.-M. Wang. Distributed topology control for wireless multihop ad-hoc networks. In INFOCOM, pages 1388–1397, 2001.
EXPERIMENTAL EVALUATION
We validated the analytic model under a uniform network. We next evaluate the distributed algorithm’s robustness and its impact on a localization service through simulation. Figure 1(a) shows experiments with uniform networks. It shows that even starting with random ranges, nodes can still infer the correct density and set their ranges centered around the optimal value. We also simulated a non-uniform network as specified in Table 1, which is based on the 3-D positions of objects found in a laboratory inventory. After performing range control, and despite the density variance, most of the nodes have out-degree around 15 as shown in Figure 1(b). We leave as future work to define ideal coverage for the non-uniform case. However, comparing our results to the uniform case qualitatively shows that our algorithm
315