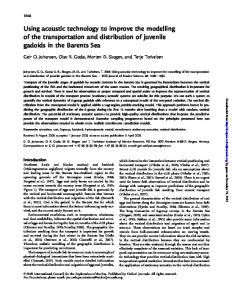
Closely Integrated Organisational. Structure. We incorporate cultural factors in this experiment by assuming that cultural differences lead to misunderstanding.
return to menu
Using Agent-Based Modelling to Study Organisational Performance and Cultural Differences A. H. Dekker Defence Science and Technology Organisation, Department of Defence, Canberra, ACT, Australia. Abstract: In the modern world, many activities require cross-cultural cooperation. Business conglomerates and military coalitions involve contributions from different countries. Partnerships between government and industry are also increasingly important. In this work, we use agent-based modelling to study cooperation between entities from different cultures. We investigate which organisational structures result in the best performance, depending on the degree of cultural differences and the synergies between entity's capabilities. The initial study involves a Defence-specific task, but application of the conclusions is more general. Our results show that reducing communication delays benefits integration, and that close integration is not necessarily a good thing. Excessively closely integrated units experienced communications problems, were vulnerable to the loss of critical members, and were strongly influenced by cultural misunderstandings. Keywords: Organisations; Culture; Modelling; Agents; C4ISR
1.
services (Army, Navy, and Air Force), as well as liaison with other government departments and non-government organisations (Dekker 2001).
INTRODUCTION
In this paper, we describe modelling and simulation work focusing on organisational structure in the presence of cultural differences. This work builds on previous simulation studies of organisational architecture (Dekker 2002a, Dekker 2002b, Dekker 2002c), which did not examine cultural factors.
In all of the examples we have listed — business, resource management, emergency management, and military operations — cultural differences can be exacerbated by the involvement of individuals from different countries, with different languages and national cultures. On the other hand, contributions from different nations are in many cases essential in order to ensure success, because of the complementary approaches and resources brought to the problem. The classic work of Geert Hofstede (1997) provides a taxonomy of national cultural differences which affect organisational behaviour, and on decision-making (Heacox et al 2000).
Cultural differences within organisations are important in a wide range of areas. For example, business organisations include research and development, sales, information technology, and human resources staff. These staff have different training, different personal goals, different vocabularies, different philosophies, and different approaches to problem-solving, all of which can lead to conflicts and misunderstandings. On the other hand, they also have complementary strengths, and access to complementary resources.
In order to study these issues, we have developed a simple grid-based testbed focusing initially on Defence-related activities, where several dozen agents cooperate on a task such as search or combat. The simulation testbed is Java-based, taking advantage of Java’s object-oriented and dynamic instantiation capabilities. Each agent contains slots for different behaviours (including goal formation, communication, sensors, weapons, and other capabilities), and each slot is filled by a string which specifies the name of a behaviour subclass and the values of appropriate parameters. These slot-strings are edited using a graphical configuration tool, which also allows easy editing of organisational structure. When the simulation is initiated from within the
In a similar way, resource management problems involve representatives from business, government agencies, non-government organisations, and community groups. Again, these participants have different goals, philosophies, and approaches. Emergency management provides another example, involving rural and urban fire services, ambulance, and police officers, utility providers (water, gas, and power), and local, state, and federal government agencies. These issues also arise in military operations, which involve elements from different
1793
return to menu
configuration tool, the slot-strings are automatically translated into properly configured behaviour objects. The resulting modularity greatly simplifies experimentation. 2.
x
The Blue Air Force consists of ground-attack aircraft.
x
The Indigo Army consists of infantry units.
x
The Blue Army consists of artillery which have little chance of destroying targets, but which successfully suppress enemy fire.
THE EXPERIMENT
In the experiment reported here, we studied the performance of a military force composed of 16 friendly units (arranged in hierarchy) against 16 opposing units. The forces engaged in combat on a 12 by 12 discrete grid containing obstacles. Figure 1 shows an example combat session. Simulation time was also discrete, occurring in distinct timesteps. We conducted Monte Carlo simulations of combat (typically taking 20 to 50 timesteps) until one side was defeated or a limit of 100 timesteps was reached.
This balance of forces was chosen to ensure a benefit in friendly forces working together, and approximately equal capabilities for friendly and enemy forces. Units differ in sensors, weapons, and speed. Sensors are accurate up to a certain range, and have limited use over a somewhat broader range. Weapons differ in range and the probability of successful strike. In addition, some weapons can strike only a single enemy unit, while others can strike multiple enemy units within a particular grid square. Speed is measured in grid squares traversed per timestep. Table 1 shows unit capabilities in this experiment. Enemy forces consist of 16 identical units (also 4 groups of 4), but without cultural differences. At each timestep, units send a summary of information collected by their sensors along the hierarchy. This data assists other units in locating and engaging the opposing force. One of the factors studied in our experiment is the impact of communications technology. We model this using a message delay d of 1, 2, 4, or 8 timesteps which is the time taken for a message to reach its recipient. Technological factors are assumed to affect both enemy and friendly units, and are therefore applied to both sides. As a measure of performance p, we use the natural logarithm of the ratio of enemy to friendly casualties (Ce and Cf), as shown in (1). This measure of performance has the advantage of being symmetric (inverting the ratio merely changes the sign of the result), and was used successfully in previous work (Dekker 2002b). It ranges (in this case) from approximately -3 to +3. For each combination of parameters, this performance measure is averaged over ten simulated combat runs.
Figure 1. Example Combat Session The 16 friendly units were divided into groups of four, assumed to come from different nations (Blue and Indigo) and different services (Army and Air Force). four friendly contingents were chosen to capabilities which are complementary: x
four two two The have
The Indigo Air Force consists of electronic warfare aircraft, with excellent sensors and the ability to suppress enemy communication, which complements units with offensive capabilities. Unit Hostile Indigo AF Blue AF Indigo Army Blue Army
Speed 1 2 3 1 1
p
Sensor Range Accurate 1 3 0 0 0
Limited 3 7 3 3 3
§ 1 � Ce · log¨ ¸ © 1 � Cf ¹
(1)
Weapon Capabilities Range 2 2 2 1 2
Type Strike Suppress comms Strike Strike Suppress fire
Multiple No Yes Yes No Yes
Table 1. Unit Sensor, Weapon, and Speed Capabilities
1794
Hit Probability 0.75 0.5 0.5 1.0 1.0
return to menu
We examine the performance of four organisational structures, shown in Figures 2 through 5. In the figures, Air Force units are shown light grey, and Army units dark grey. Also, units from the Blue nation are shown as boxes, while units from the Indigo nation are shown as circles. a.
Loose integration: four groups, each containing units all of one type, as shown in Figure 2.
b.
Service integration: each of four groups contains units all from the one service (Army or Air Force), but mixed nationally (2 Blue and 2 Indigo units), as shown in Figure 3.
c.
Country integration: each of four groups contains units all from the one country (Blue or Indigo), but mixed services (2 Army and 2 Air Force units), as shown in Figure 4.
d.
Close integration: each group contains four different kinds of units, as shown in Figure 5.
Figure 4. Country Integration
Figure 5. Closely Integrated Organisational Structure We incorporate cultural factors in this experiment by assuming that cultural differences lead to misunderstanding. In its most general form misunderstanding means that messages which are sent within the organisation are not interpreted the way the sender intended. They may even be completely ignored. We model misunderstanding as resulting in messages being ignored, although in real life misunderstandings which result in messages being distorted are probably more serious.
Figure 2. Loosely Integrated Organisational Structure
Naturally, cultural differences also generate benefits because of the complementary approaches and resources brought to the problem, and we have modelled that by assigning units complementary capabilities. We model cultural differences using a measure c, which we take to be 0.0 between units from the same service and country. We assume that this cultural difference c is 0.5 for units from the same country, but different service; or from the same service, but different country. We assume that this difference is 1.0 for units where both the service and country are different. Note that a
Figure 3. Service Integration
1795
return to menu
difference of 1.0 on a single link can only occur within the closely integrated organisational structure. A more realistic measure of cultural difference is discussed in (Dekker 2002d).
The logarithm used here is the natural logarithm, as shown in Table 3. The regression line (2) predicts 67% of the variance in performance (a reasonably high correlation of –0.82), and is statistically very significant (p < 0.000001).
We assume that the probability of a message being lost due to misunderstanding is the product cm, where m is a misunderstanding factor ranging from 0.0 to 0.9. Thus for m = 0.0, no misunderstanding occurs, while for m = 0.9, messages are lost with probability 0.0, 0.45, or 0.9, depending on the cultural difference c. Such a lost message is essentially equivalent to a onetimestep delay, since successful message transmission may occur on the next timestep (because messages are sent out at every timestep).
Loose Integration Service Integration Country Integration Close Integration
0.74 0.06 –0.45 –0.71
(3)
(4)
p ci | �0.08 � 0.50m
The impact of the misunderstanding factor m explains 5% of the variance in performance for the closely integrated structure. The misunderstanding factor m has a smaller effect than the message delay d, since it has its greatest impact only on links where the cultural difference c = 1, and because each message lost due to misunderstanding only results in a delay of one timestep. Table 4 shows these results in more detail:
Standard Deviation 0.42 0.74 0.71 0.76
Table 2. Average Performance for Different Organisational Structures The differences between the first two organisational structures and the second two structures was statistically significant (p = 0.02). In other words, loose integration and service integration performed significantly better than the other two organisational structures. The largest impact on performance was the message delay d. Not surprisingly, increasing the message delay decreased performance. Regression analysis gave the best-fit line shown in (2): p | 0.66 � 0.77(log d )
0.00 0.69 1.39 2.08
Regression Prediction 0.66 0.12 –0.41 –0.95
The poor performance of the closely integrated organisational structure requires closer analysis. This is the only organisational structure where cultural differences c of 1.0 arise, and as a result, it is the only organisational structure where there is a statistically significant impact of the misunderstanding factor m (p = 0.08). The resulting single-variable regression equation for the closely integrated organisational structure alone is (4):
Performance
0.15 0.15 –0.36 –0.30
1 2 4 8
Std Dev 0.20 0.50 0.53 0.35
p | g � 0.80 � 0.77(log d )
The overall average performance score was –0.09, i.e. a slight tendency for enemy units to win. Averages for the four organisational structures were as shown in Table 2: Average
Ave
Incorporating the averages from Table 2 predicts 77% of the variance in performance (an additional 10%, giving a correlation of 0.88). The new regression line is (3), where g is the group average performance in Table 2:
RESULTS
Organisational Structure
log d
Table 3. Average Performance for Different Message Delays
For each combination of organisational structure, message delay d, and misunderstanding factor m, the simulation was run 10 times, and the resulting performance measures averaged. Time constraints ruled out collecting more data (the simulation, written in Java, ran continuously for over one week collecting the data presented here). Averaging over only 10 runs resulted in a substantial degree of random noise within the data. However, our analysis was able to draw statistically valid conclusions from the simulation results. 3.
Performance
Msg Delay d
Performance
Misunderstand Factor m
Ave
0.0 0.3 0.6 0.9
–0.10 –0.21 –0.32 –0.57
Std Dev 0.69 0.81 1.13 0.55
Regression Prediction –0.08 –0.23 –0.38 –0.53
Table 4. Average Performance for Closely Integrated Structure with Different Misunderstanding Factors
(2)
1796
return to menu
appropriate to ask whether any corrective action is possible. To explore this, we conducted an additional experiment, where additional communication links are introduced between some of the nodes in the closely integrated organisational structure, as shown in Figure 7. In particular, the four Indigo Air Force units, which have the best sensors, are linked in a sensor net.
These results show that cultural misunderstandings have a significant effect on the closely integrated organisational structure, although the effect on the other organisational structures was not significant. The closely integrated organisational structure is also vulnerable to the loss of key units. Each closely integrated team consists of four different units which are required to work together, but if one of these units are unavailable, the performance of the team is drastically affected. On the other hand, the loosely integrated structure groups units of the same type together, and such a grouping is able to perform its function as long as at least one unit of each type is available. If in equation (3) we replace the group average of –0.30 for the closely integrated organisational structure by the regression equation (4), we are able to predict 79% of the variance in performance (an additional 2%, giving a correlation of 0.89). The resulting regression equation is (5), and the fit to the data is shown in Figure 6. 0.72 � 0.50m � 0.77(log d ), close integ ° p | ® 0.44 � 0.77(log d ), country integ ° 0.95 � 0.77(log d ), otherwise ¯
Figure 7. Closely Integrated Organisational Structure with Additional Communications Links
(5)
These additional communication links improve the average performance by 0.20 (increasing from –0.30 to –0.10). This improvement is statistically significant (p = 0.04). Consequently, the regression equation for the closely integrated organisational structure alone becomes (6):
Given the amount of random noise in the data, it is unlikely that a further improvement in predicting performance is possible, i.e. the 79% of variance which we are able to predict represents as complete an understanding as we could expect to obtain from the given data.
1.01 � 0.50m � 0.85(log d ), extra links (6) p ci | ® ¯ 0.81 � 0.50m � 0.85(log d ), original 5.
CONCLUSIONS
The limited number of simulation runs we were able to perform has resulted in a significant amount of random noise in the data. As a consequence, it is unlikely that a further improvement in predicting performance is possible. However, the regression analysis that we have performed demonstrates several points: a.
Figure 6. Scatter Diagram for Regression Equation (5) 4.
ADDITIONAL INVESTIGATIONS
Having noted the poor performance of the closely integrated organisational structure, it is
1797
Reducing communication delays benefits integration generally. Recall that the communications delay was applied to both friendly and hostile forces, but the reduced communications delay led to better performance for the integrated friendly units. This was because improved communications facilitated information transfer from units with good sensors to those in a position to use the information collected. This effect is confirmed by the performance improvement that resulted when additional communication
return to menu
links were added to the closely integrated organisational structure, as in Figure 7. b.
Close integration was not necessarily a good thing. Loose integration was in fact the bestperforming organisational structure. The closely integrated units experienced communications problems, and were vulnerable to the loss of critical members.
c.
Close integration was strongly influenced by cultural misunderstanding. Because the close integration structure mixed units from radically different cultures, when the misunderstanding factor was high, performance dropped significantly. The performance drop (0.45) was approximately equal to the drop from the best to the worst organisational structure, or to the impact of doubling the message delay.
7.
Dekker, A.H., Applying Social Network Analysis Concepts to Military C4ISR Architectures, Connections, the official journal of the International Network for Social Network Analysis, 24 (3), 93–103, 2001. See http://www.sfu.ca/~insna/ConnectionsWeb/Volume24-3/Dekker.pdf Dekker, A.H., C4ISR Architectures, Social Network Analysis and the FINC Methodology: an Experiment in Military Organisational Structure, DSTO Report DSTO-GD-0313, 2002a. Available at http://www.dsto.defence.gov.au/corporate/ reports/DSTO-GD-0313.pdf Dekker, A.H., Applying the FINC (Force, Intelligence, Networking and C2) Methodology to the Land Environment, DSTO Report DSTO-GD-0341, 2002b. Available electronically at http://www.dsto.defence.gov.au/corporate/ reports/DSTO-GD-0341.pdf
Some implications of these results are as follows: x
Fast effective communications are essential for geographically dispersed organisational structures integrating disparate elements, where the elements have different information available to them and different opportunities for activity. We would therefore expect technologies that operate in real time to be most effective. These technologies include instant messaging and videoconferencing.
x
Integration of different capabilities is a good thing, but excessively close integration may not be. Proposals for close integration of people or units should be considered carefully.
x
Where close integration of culturally distinct units is decided on, all possible steps should be taken to prevent misunderstandings. Such steps include presenting information in a variety of different ways, improved communications, improved social interaction, etc. Duarte and Snyder (2001) discuss these and other techniques in detail.
Dekker, A.H., Agent-Based Modelling And Organisational Structure. Presentation at The First Lake Arrowhead Conference On Computational Social Science And Social Complexity: Agent-Based Modeling In The Social Sciences, May 9–12, 2002c. See http://www.acm.org/~dekker/LA.html Dekker, A.H., A Category-Theoretic Approach to Social Network Analysis, Electronic Notes in Theoretical Computer Science, 61, 2002d. Available electronically at http://www.elsevier.nl/locate/entcs/volume 61.html Duarte, D.L., and Snyder, N.T., Mastering Virtual Teams, 2nd ed, Jossey-Bass, 2001. Handy, C., Understanding Organizations, 4th ed, Penguin, 1993. Heacox, N.J., Gwynne, J.W., Kelly, R.T., and Sander, S.I.,. Cultural Variation in Situation Assessment: Influence of Source Credibility and Rank Status. Technical Report 1829, US Navy (SSC San Diego), 2000.
In future work we intend to examine a wider range of organisational structures, and apply them to more complex resource management tasks, where simulating group decision-making will become a significant factor. 6.
REFERENCES
Hofstede, G., Motivation, Leadership and Organization: Do American Theories Apply Abroad? In Organization Theory: Selected Readings, 4th ed (Pugh, D., ed) Penguin, 1997.
ACKNOWLEDGEMENTS
The author wishes to thank Irena Ali and an anonymous referee for helpful comments on the paper.
1798