Enterprise Architecture Management, Visualization, Business Intelligence, IT-Alignment. 1. ..... In Software & Systems Modeling, published online April. 2014.
IADIS International Journal on WWW/Internet Vol. 14, No. 1, pp. 57-69 ISSN: 1645-7641
USING BUSINESS INTELLIGENCE SYSTEMS FOR ENTERPRISE ARCHITECTURE VISUALIZATION Dirk Frosch-Wilke. University of Applied Sciences Kiel, Sokratesplatz 2, D-24149 Kiel, Germany Sina Tuchtenhagen. Wall 55, D-24103Kiel, Germany
ABSTRACT In today’s business the optimization of the alignment between Business and IT can be assessed as a critical success factor for enterprises. Enterprise Architecture (EA) is used by enterprises for providing an integrated environment in order to support this Business-IT-Alignment. But establishing EA practice still remains a challenging endeavor with low success rates. Mayor reasons for that are the high complexity of the enterprise models and the resultant necessity for stakeholder specific visualization of the enterprise model, the different information requirements of different stakeholder groups, and the not sufficient integration of EA in the management processes and IT management tools used by a company. For this reason we argue that the business management of an enterprise and the Enterprise Architecture Management (EAM) of the company should be integrated in a more consistent way to minimize application proliferation and to avoid information system silos. One possibility for achieving this is to provide and to visualize all necessary management information in only one IT-tool which is well integrated in the management processes of a company. In the business management context Business Intelligence (BI) systems are information integrators which allow stakeholder specific visualization and analyses of high quality and integrated business data. Also EAM systems have to collect, to manage and to visualize information from one or various sources. In this paper we demonstrate how information needed by EAM can also be modelled, stored, and business friendly visualized within a BI system. Thus, we demonstrate how Enterprise Architecture Visualization can be managed by a BI system. KEYWORDS Enterprise Architecture Management, Visualization, Business Intelligence, IT-Alignment
1. INTRODUCTION Enterprise Architectures and their corresponding management functions (EAM) received ongoing interest from practitioners, academia as well as from tool vendors and standardization bodies. In the last two decades many papers and books have been published about EAM and
57
USING BUSINESS INTELLIGENCE SYSTEMS FOR ENTERPRISE ARCHITECTURE VISUALIZATION
many approaches and viewpoints have been discussed (a good literature overview can be found in (Buckl and Schweda, 2011)). EAM should not be seen as an isolated management discipline and should be integrated with other management functions (Matthes, 2014). Enterprise Architecture (EA) is increasingly being used by large organizations to handle the complexity of their business processes, information systems and technical infrastructure. Although seen as an important instrument to help solve major organizational problems, effectively applying EA is not an easy task (van der Raadt et al., 2010). The key objective of EAM is the optimization of the business-IT alignment. To achieve this objective, EAM creates and analyses models of the current and future state of the Enterprise Architecture and use this model for decision support in IT management in enterprises (Farwick et al., 2014; Ekstedt et al., 2004). Thereby the Enterprise Architecture serves as a common means to look at an entire organization as a whole. It captures business aspects (e.g., business processes, business objects), and IT aspects (e.g., interfaces, IT-services, networks, devices) as well as their interrelations (Buschle et al. 2012). Todays organization are faced with the challenge of contionously changing economic, regulartory and technical environements. Performing the necessary adapatation needs a holistic perspective on the overall-make-up of the organisation, its components, and their dependencies. But therquired perspective depends on the current EA management problem to be addressed, The different EA stakeholders (e.g. enterprise architects, business executives) needs different information about the EA during decision-making (Hauder et al., 2013b). The Enterprise Architecture model building is based on data which have to be collected from different distributed data sources (e.g., CMDBS, process log files, Excel spreadsheets) with varying data quality. The issue of cost-intensive gathering, maintaining, and disseminating of EA information is discussed in (Buckl et al., 2011) and can be seen as a challenge in EAM (e.g.(Hauder et al., 2013a), (Le, 2015)). The Enterprise Architecture models supported the “architecture life cycle” described by (Arbab et al., 2007; Lankhorst, 2009) . This life cycle consists of the phases 1) design, 2) communication, 3) realization, and 4) feedback. Especially with respect to the communication of EAs, the importance to visualize architectural aspects relevant to particular stakeholders is repeatedly discussed (e.g. in (Jonkers et al., 2006), (Tribolet et al., 2014)). There exists different frameworks which help companies to support and to manage the “architecture life cycle”. The Open Group Architecture Framework (TOGAF) is such an architecture framework which provides different tools and methods. TOGAF is one of the most extensive, widest and reliable EAM frameworks (e.g. Josey, 2011; Mueller et al., 2012) In the business management context BI systems are intensivley used for decision support. For this reason BI systems a) collecting business data from various data sources, b) consolidating these data and c) make these data available for analysing and visualization regarding stakeholders information requirements and visualization needs. In the last couple of years BI systems have become the most important tool for strategic and operative management and decision support in enterprises (Bansal, Awasthi, Gupta, 2013). Thus, the essential objectives and tools/methods used in BI are very similar to the ones in EAM. For this reason we study in this paper, how data relevant for EAM can be modelled in BI systems and which visualization types of Enterprise Architecture models are offered by BI systems. Our approach is evaluated by a prototype implementation using a case study from an insurance company. We use the Architecture Development Method (ADM) of TOGAF to adress the busines as well as the IT needs. The prototype implementation is made by using the
58
IADIS International Journal on WWW/Internet
BI system IBM Cognos, which is used by this company. During this prototype implementation we take care for an active participation of different EA stakeholder groups. Therfore this paper makes a contribution to a stronger integration of EAM with business management. Besides data collection and visualization of EAs by using a BI tool our approach provides new opportunities to combine EA with business data (e.g., cost (activity cost, project cost etc.), returns) which will be allocated by the BI data base. Beyond the scope of this paper is the introdcution of new visualization types for EA models. Our reseach design is based on the System Research Development Process (Nunamaker et al, 2001)). In consequence, the paper is organized as follows. In the next section we state the research question and we investigate the different necessary visualization types of EA models. Further we study the possibilities to visualize these models in IBM Cognos. In section 3 we design the data model of EA data based on a multidimensional data model which is used by IBM Cognos.
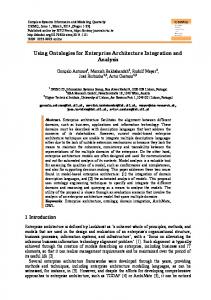
2. ENTERPRISE ARCHITECTURE MODEL BUILDING AND VISUALIZATION Enterprise Architecture describes the fundamental artifacts of business and IT as well as their interrelationships (Ross et al., 2006). Architecture models constitute the core of the approach and serve the purpose of making the complexities of the enterprises and their environment understandable and manageable (Winter, Fischer, 2007). For this reason it is necessary to collect a vast amount of data from different data sources. These data become valuable if they will be used to build an EA model which visualizations fit the information requirements of the EAM stakeholders. Thus, these visualizations should enable the stakeholders to choose their specific views on the Enterprise Architecture model (Niemann, 2006). The representation of an EA can effectively done in terms of hierarchies. To use hierarchy levels to represent the structure of an organization is quite common. But hierarchy levels also express the granularity of the enterprise model (i.e. going from a coarse-grained description to a fine-grained ones) (Le, 2015). The design of an EA model required a multi-disciplinary team of stakeholders having different backgrounds and different requirements regarding the model. Active participation of EA stakeholders is one of the main critical factors in EAM (van der Raadt et al., 2010). Thus, every EA modeling process has to be started with an intensive requirements elicitation from the different EA stakeholders. The architecture-life-cycle topic of communicating Enterprise Architecture models in a stakeholder- and organization-specific manner has been addressed by (Hanschke, 2010). Further this was concretized in multiple exemplary and best-practice visualizations for the four EAM relevant landscapes (cf. figure 1).
59
USING BUSINESS INTELLIGENCE SYSTEMS FOR ENTERPRISE ARCHITECTURE VISUALIZATION
Figure 1. Enterprise Architecture Model (Hanschke, 2010)
This landscape model documents the application landscape in interaction with the business, technical and infrastructure landscapes and with the current project portfolio. By assigning the business landscape elements to the elements of the application landscape model, it becomes transparent which IT system delivers support to the business. The mutual dependencies and connections in and between the business and IT sides of the enterprise become visible. Links from the application landscape to infrastructure elements map the connections with the operating infrastructure of an enterprise. Links from the application landscape to the technical landscape documents how applications and interfaces are implemented in technical terms. With the help of this links a company will be enabled to identify technical dependencies and points where there is a need for action or potential for improvement (Hanschke, 2010). For the different landscapes of the EA model the following visualization types are proposed (Hanschke, 2010), which are sometimes overlapping regarding the visualized information: Lists: Showing specific and detailed attributes of an element of the EA; Cluster graphics: Showing the functional and technical organization of an enterprise (e.g., process- and product map, blueprint or reference model); Layout plans: Showing relationships and interdependencies between different elements of the business and IT architecture (e.g., matrix diagram); Portfolio graphics: Describing different elements of the IT and business architecture by using up to five dimensions (x- and y-axis; size, colour and shape of the symbol); Information flows: Showing relationships between IT systems, information objects, interfaces and the logical data flows;
60
IADIS International Journal on WWW/Internet
Allocation tables: Showing mappings between different elements of the EA. The type of mapping could be explicitly specified; Masterplan: Showing time-dependencies between projects, IT systems and/or products.
For being able to fit specific information and specific user needs an EAM tool should offer a wide variety of visualization possibilities. Otherwise the information provided by an EAM tool is less valuable. Thus the visualization of information can be seen as a success critical functionality within EAM. Based on these observations for visualization requirements within EAM we formulate the following research question: Is it possible to use a BI system to fulfil the visualization requirements of Enterprise Architecture Management in an adequate extent and thereby contributing to a stronger merging of business management and Enterprise Architecture Management by using the same systems for data visualization and data analyses? Though BI systems like IBM Cognos offer a wide range of data visualization possibilities, it has to be carefully evaluated, if they can comply with the specific EAM requirements. The results of our evaluation are summarized in table 1. Table 1. EAM visualization in IBM Cognos
In table 1 we distinguish between the standard graphic engine in IBM Cognos and the Rapidly Adaptive Visualization Engine (RAVE). RAVE is introduced in IBM Cognos Version 10.2.1 and can be used only in active reports. Our results demonstrated that many visualization types used in EAM can be created in IBM Cognos. But layout plans can be visualized only in simple forms (though we show in chapter 4 that this is often sufficient). If many interleaving have to be visualized in a layout plan then this is not possible with IBM Cognos. Further, IBM has announced a new graphic type for information flows within RAVE, but currently this is not available. Summarizing our results we can conclude that a great variety of visualization types are necessary within EAM to achieve a stakeholder-centric information support. Most of these visualizations types are (or will be) provided by the BI system IBM Cognos.
61
USING BUSINESS INTELLIGENCE SYSTEMS FOR ENTERPRISE ARCHITECTURE VISUALIZATION
3. MODELLING OF EAM DATA IN A BI SYSTEM The visualization of data within a BI system is based on some specific data structures. These data structures correlate with the objective to allow different views on business data. In this chapter we demonstrate how EAM data can be modelled within IBM Cognos by adapting EAM data to the data structures of this BI tool. Most of the EAM relevant visualization types of IBM Cognos need a multidimensional data structure. This data structure consists in a BI context of a cube (including business key figures/measures, e.g., sales volume) and multiple dimension tables (reflecting the different views for analyzing the key figures). Each dimension (e.g., article) includes attributes (e.g., weight) as well as hierarchies (e.g., article group -> article family) and levels (indicating the position of an entity within the dimension hierarchy) (cf. figure 2).
Figure 2. Multidimensional data model in BI systems (https://web.stanford.edu/dept/itss/docs/oracle/10g/olap.101/b10333/multimodel.htm)
This multidimensional data model will usually converted into a relational data base model by using a star schema (cf. figure 3). The star schema consists of one fact table (including the measures (or facts)) and for each dimension one dimension table.
Figure 3. Star Schema (Song et al., 2007)
In the case of EAM data we do not have explicitly facts in terms of a BI system, but the EAM data represent relationships between different Enterprise Architecture aspects. For this reason we are using a factless fact table (Kimball and Ross, 2013:44) which allows describing events and states. Attributes of different EA elements are modelled as (descriptive) attributes
62
IADIS International Journal on WWW/Internet
of dimensions. Hierarchies regarding EA objects can be modelled as a hierarchy within a dimension table. For this reason the fact table includes the primary key attributes of the different EA elements which have to be visualized, and an artificial fact attribute with a constant value.
4. THE EAM-BI-PROTOTYPE As a proof-of-concept for Enterprise Architecture model visualization in a Business Intelligence System we implemented a prototype in IBM Cognos.
4.1 Context The prototype was developed in the context of an insurance company which was establishing a project to implement a new BI system or which at least wanted to reengineer an already existing BI system and were supported by an external consultancy company. One of the first steps in such a development project is to get an overview of the functionalities which should be provided by the BI systems (BIF), the information areas (IA), the business domain (BD) etc. (for details of the relevant EA objects cf. table 2). This kind of information can be visualized in the EAM context with the help of a technical layout plan. Table 2. Definitions of EA objects
4.2 Requirements Elicitation The EA prototype implementation is based on the results of a comprehensive requirements elicitation from different project stakeholder. Therefore we take care of an active participation of EA stakeholders. For the identification of the relevant stakeholder (groups) in this project
63
USING BUSINESS INTELLIGENCE SYSTEMS FOR ENTERPRISE ARCHITECTURE VISUALIZATION
we take TOGAF ADM stakeholder types as a basis. We identify the following stakeholder groups within the different stakeholder types: Corporate Functions: Corporate Management, Compliance and Security Management, Project Portfolio Management, Business Planning, Accounting End-User: Department Management, Business Unit Management, Supplier, External Consultants Project: Project Management System: CIO, Enterprise Architect, IT Application Management In the requirements elicitation process we gathered from these different stakeholder groups 59 functional and non-functional requirements in total, which were classified in 6 categories. In the following we give a short summary about the categories, the quantity of requirements within each category and one example of some requirement per category: Required data: 15 requirements (e.g., “A business domain is characterized by the attributes Name, Description, Information Areas, Data Source Systems”); Data usage: 13 requirements (e.g., “Business domains should be provided by an extendable drop down list”); Visualization: 12 requirements (e.g., “A user in the role ‘external consultant” should be able to generate an overview of all information clusters and the related information areas”); Interfaces: 4 requirements (e.g., “The prototype has to be able to export all data into a file”); Quality: 9 requirements (e.g., “The response time for generating a report has to be less than 1 minute”); Other constraints: 6 requirements (e.g., “The prototype should allow reading access on mobile devices”).
4.3 Logical Data Model Based on these stakeholder requirements we developed a logical data model based on a star schema for the EA visualization in IBM Cognos (cf. figure 5). Thereby we are using a factless fact table with an attribute ‘Size’ with constant value ‘1’ as well as multiple parallel hierarchies within different dimension tables. The dimensions correspond with different EA objects and their interrelations which should be visualized.
64
IADIS International Journal on WWW/Internet
Figure 4. Multidimensional data model for the prototype
The concept of hierarchies is well-known in BI systems for enabling drill-down or roll-up data analysis. We are using hierarchies in the context of EA visualization for displaying EA information on different aggregation levels. Parallel hierarchies allow additionally the visualization of different EA objects within one context where no hierarchical relationship between the EA objects exists. We will demonstrate the concept of parallel hierarchies with help of the dimension ‘Information Area’. In these dimension six parallel hierarchies exits (cf. figure 4). These hierarchies allow the aggregation of EA information from e.g., a group of business tasks (BT) to the correlated information area (bottom-up analyses) or the disaggregation from an information area to all relevant key figures (KF) of this information area (top-down analyses) in the EA layout plan. Further on different aspects of an ‘Information Area’ like ‘relevant dimensions’ or ‘substantial business tasks’ can be visualized. Using a dimension ‘Information Area’ with parallel hierarchies is enabling to deliver this kind of information which is currently needed by the user.
4.4 Visualization Implementation To be able to implement the specific requirements regarding the layout plan, we have created a new RAVE visualization type with help of the Visualization Customizer. For this reason we extended RAVE graphic types by adding e.g., a new hierarchy level, which allows displaying
65
USING BUSINESS INTELLIGENCE SYSTEMS FOR ENTERPRISE ARCHITECTURE VISUALIZATION
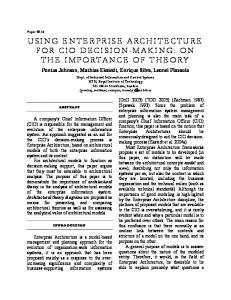
the relationships between information clusters and information areas. The specifications of these new graphic types were imported as a library by the IBM Cognos BI Suite. For the implementation of the different visualizations we used the Report Studio of IBM Cognos. Thereby we implemented a dash board which allows generating different EA visualizations by using the graphic types of the imported library and of the EA data structured by the underlying multidimensional data model. The dash board were provided by a Webinterface using IBM Cognos Connection, which allows report generation, interactive usage of the reports, and access control. The prototype implementation allows filtering of the EA data for specific information needs of users and visualizing this information in a graphic which is adequate for the user (cf. figure 5). Further on we have developed a template for the presentation of EA information in MS Powerpoint and are using the IBM Cognos OfficePlugin for updating this information.
Figure 5. Example of EA layout plan generated by the BI system IBM Cognos
The layout plan in figure 5 shows in the top row (segment no. 1) the necessary BI functionality (e.g., standard reporting, time series analysis) for the different information clusters (e.g., accounting) and the corresponding information areas (e.g., profitability analysis, reporting procedure). Three information clusters and their associated ten information areas are shown in the middle segment (no. 2) of the layout plan. The bottom row (no. 3) in figure 5 shows technical domains (e.g., product, contract data). The prototypes allow users to get detailed information for the different information areas by just clicking the corresponding segment of the layout plan (cf. figure 6). This is possible, because we implement a “Drill-Through” function which connects the Dashboard view with the view for fine grained information.
66
IADIS International Journal on WWW/Internet
Figure 6. Detailed information report for the information area “Balancing of accounts (in German: Bilanz/Abschluss)”
In the detailed report in figure 6 you will find all information which are corresponding with an information area and which are modelled in the dimension table “Information Area” in the multidimensional data model in figure 4 (e.g., corresponding key figures, stakeholders, required BI functionality).
5. CONCLUSIONS Enterprise Architecture Management is an important management discipline which helps an enterprise by achieving a better IT- alignment to the business objectives and strategies. Business Intelligence systems are extensively used for strategic and operative management activities. For a company to be successful Enterprise Architecture Management should be integrated with business management. One possibility for this kind of integration of different management disciplines can be by using the same IT-based management tools. For this reason we demonstrated in this paper how data of the Enterprise Architecture can be integrated in a Business Intelligence system and how these data can be used to visualize Enterprise Architecture information within a BI system. We implemented a prototype based on the IBM Cognos system to demonstrate our concepts and findings by using an extensive real-life example. In (Roth, Matthes 2014) the necessity for visualization of current and future states of the EA as well as the visualization and analysis of the differences is emphasized. In future research we will evaluate how the well-known concept of a scenario dimension (e.g. Eder, Koncilia, 2002)), which in the BI concept typically represent different versions of transactional data (e.g. “actual value”, “planned value” and “current difference”) can be used to address this necessity. Additionally, further research should examine the impact of using one (integrated) management tool for business and EA management on the success and agility of an enterprise and a better communication and understanding between different groups of stakeholders in a company. For this reason it should be evaluated how business data and EA data could be merged (and visualized) together to create meaningful information models.
67
USING BUSINESS INTELLIGENCE SYSTEMS FOR ENTERPRISE ARCHITECTURE VISUALIZATION
Additionally future activities have to concentrate on analyzing how the different data sources relevant for EAM can be connected to BI systems and how to transform the data into the internal multidimensional data structure. Because BI systems are able to integrate multiple data sources and to implement transformation routines these integration of EA data sources seems to be possible by standard procedures. In addition other BI systems have to be analyzed regarding their possibilities for visualization types which are relevant for EAM.
REFERENCES Arbab, F., Boer, F. S. d., Bonsangue, M. M., Lankhorst, M. M., Proper, E. H., Torre, L. W. N. v. d., 2007. Integrating Architectural Models - Symbolic, Semantic and Subjective Models in Enterprise Architecture. In Enterprise Modelling and Informa-tion Systems Architectures. 2(1), pp. 40–57. Bansal, S., Awasthi, S., Gupta, C., 2013. A Review on Need of BI in Organization. In Journal of Engineering, Computers & Applied Sciences, Vol. 2, No. 4, pp. 76-79. Buckl, S., Schweda, C.M., 2011. On the State-of-the-Art in Enterprise Architecture Management Literature. Technical Report, TU München. Buschle, M., Grunow, S., Matthes, F., Ekstedt, M., Hauder, M., Roth, S. , 2012. Automating enterprise architecture documentation using an enterprise service bus. In Proceedings of the 18th Americas Conference on Information Systems. Washington. Eder, J., & Koncilia, C., 2002. Representing temporal data in non-temporal olap systems. In Proceedings. 13th International Workshop on Database and Expert Systems Applications, pp. 817-821. Ekstedt, M.; Johnson, P.; Lindström, Å.; Gammelgård, M.; Johansson, E.; Plazaola, L.; Silva, E. et al, 2004. Consistent Enterprise Software System Architecture for the CIO – A Utility-Cost Based Approach. In 37 th Hawaii International Conference on System Sciences (HICSS 2004). Farwick, M., Schweda, C.M., Breu, R., Hanschke, I., 2014. A situational method for semi-automated Enterprise Architecture Documentation. In Software & Systems Modeling, published online April 2014. Hanschke, I., 2010. Strategic IT Management – A Toolkit for Enterprise Architecture Management, Springer. Berlin. Hauder, M., Roth, S., Schulz, C., Matthes, F., 2013a. An Examination of Organizational Factors Influencing Enterprise Architecture Management Challenges. In Proceedings of 21st European Conference on Information Systems (ECIS), Utrecht, Netherland, Hauder, M., Roth, S., Pigat, S., Matthes, F. 2013b. A Configurator for Visual Analysis of Enterprise Architectures. In Demos/Posters/StudentResearch@ MoDELS pp. 16-20. Jonkers, H., Lankhorst, M. M., ter Doest, H., Arbab, F., Bosma, H., Wieringa,R., 2006. Enterprise architecture: Management tool and blueprint for the organisation. In Information Systems Frontiers. No.8, pp. 63–66. Josey, A., 2011. TOGAF Version 9.1 Enterprise Edition: An Introduction. The Open Group. Kimball, R., Ross, M., 2013. The Data Warehouse Toolkit. New York, 3 rd edition. Lankhorst, M. M., 2009. Enterprise Architecture at Work: Modelling, Communication and Analysis, Springer. Berlin, Heidelberg, Germany. 2 nd edition. Le, L.-S., 2015. Multi-Diagram Representation of Enterprise Architecture: Information Visualization Meets Enterprise Information Management. In Dang, T.K. et al. (Eds.). Future Data and Security Engineering.Springer LNCS (9446), Springer, pp. 211-225.
68
IADIS International Journal on WWW/Internet
Matthes, F., 2014. Agile Enterprise Architecture Management. In Digital Enterprise Design & Management 2014. Invited talk. Mueller, T., Schuldt, D., Sewald, B., Morisse, M., & Petrikina, J.,2013. Towards inter-organizational Enterprise Architecture Management-Applicability of TOGAF 9.1 for Network Organizations. In: AMCIS 2013 Proceedings. Niemann, K. D., 2006. From Enterprise Architecture to IT Governance – Elements of Effective IT Management. Vieweg+Teubner. Wiesbaden. Nunamaker, J.F., Chen, M., Purdin, T.D.M., 2001. Systems Development in Information Systems Research. In Journal of Management Information Systems, Vol. 7, No. 3, pp.86-106. Ross, J.W., Weill, P., Robertson, D., 2006. Enterprise Architecture As Strategy: Creating a Foundation for Business Execution. Harvard Business School Press Roth, S., Matthes, F. 2014. Visualizing differences of enterprise architecture models. In Proc. International Workshop on Comparison and Versioning of Software Models (CVSM) at Software Engineering (SE). Song, I-Y., Khare, R., Dai, B., 2007. SAMSTAR: A Semi-Automated Lexical Method for Generating Star Schemas from an Entity-Relationship Diagram. In Proceedings DOLAP’07, pp. 9-16. Tribolet, J., Sousa, P., Caetano, A., 2014.The Role of Enterprise Governance and Cartography. In Enterprise Engineering. In: Enterprise Modeling and Information Systems Architectures, Vol. 9, No. 1, pp. 38-49. Van der Raadt,B., Bonnett, M., Schouten, S., van Vliet, H., 2010. The Rekation between EA Effectiveness and Stakeholder Satisfaction. In The Journal of Systems and Software, Vol. 83, pp. 1954-1969. Winter, R., Fischer, R. 2007. Essential Layers, Artifacts, and Dependencies of Enterprise Architecture. In Journal of Enterprise Architecture, pp. 7-18.
69