Jun 10, 2010 - on top of the Netbeans Platform, currently in alpha version 0.7. Categories and ... system uses a thread pool for parallelizing visualization jobs,.
Poster Abstracts at Eurographics/ IEEE-VGTC Symposium on Visualization (2010)
Using Computer Games Techniques for Improving Graph Visualization Efficiency Mathieu Bastian1 , Sebastien Heymann1,2 and Mathieu Jacomy3 1 INIST-CNRS, France CNRS - ENSC Bordeaux, France 3 WebAtlas, Telecom ParisTech, France
2 IMS
Abstract Creating an efficient, interactive and flexible unified graph visualization system is a difficult problem. We present a hardware accelerated OpenGL graph drawing engine, in conjunction with a flexible preview package. While the interactive OpenGL visualization focuses on performance, the preview focuses on aesthetics and simple network map creation. The system is implemented as Gephi, a modular and extensible open-source Java application built on top of the Netbeans Platform, currently in alpha version 0.7. Categories and Subject Descriptors (according to ACM CCS): H.5.2 [Information Systems]: User Interfaces—I.3.6 [Computing Methodologies]: Methodology and Techniques—Interaction techniques
1. Introduction Large scale graph drawing remains a technological challenge, actively developed by the infovis community. Many systems have successfully brought interactive graph visualization [Aub03], [Ada06], [TAS09] but still have visualization limitations to render large graphs at some moments. Various techniques have been used to either optimize graph drawing or reduce the number of objects with aggregation [AvHK06]. Real-time graphics application (e.g., games) uses high optimization techniques and exploit parallelism of modern graphics hardware to guarantee responsiveness at all times. In information visualization, severals projects investigated using OpenGL, notably [WB09] but with a limited use of these techniques. We also observed that flexibility is opposed to performance and the difficulty to build a graphic engine that fulfills both aspects.
For guaranteeing best performance, the 3-D visualization engine leaves apart effects and complex shapes, for instance curved edges and focus on basics, i.e. nodes, edges and labels. As it is specialized in a particular task, the visualization engine is thus less flexible. That’s why a complementary drawing library, named Preview is needed to bring parametrization and flexibility. The following sections descibe the role granted to each visualization module.
2. Our Appoach Our approach is to use two different, yet complementary graph visualization engines combined in a single application. We propose to focus on performance for the interactive graph exploration using an efficient OpenGL rendering engine, and focus on aesthetics and flexibility on a second system based on a general 2-D drawing library. c The Eurographics Association 2010.
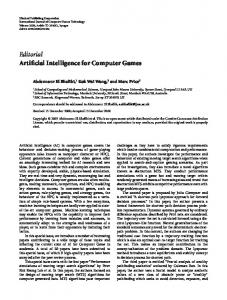
Figure 1: A screenshot of Gephi version 0.7 alpha
Bastian, Heymann & Jacomy / Using Computer Games Techniques for Improving Graph Visualization Efficiency
Efficient 3-D Visualization We propose an ad-hoc OpenGL three-dimensional (3-D) visualization engine with hardware-based acceleration and interactive visual analytics. Developping a visualization system only devoted to graph drawing reduces abstraction and allows better optimization, compared to general 2-D drawing libraries. It uses high optimization techniques, traditionnaly used in games or scientific visualization like [SNK∗ 03] to fasten rendering and updates, including: • Frustum culling with Octree • Level-of-detail (LOD) • Multi-thread OpenGL enables the visualization engine to take advantage of hardware-based acceleration to render graphs. The octree spatial data structure recursively divides the screen into eight octants. The engine maintains the list of visible octants and therefore ignore non-visible objects on screen. That dramatically reduces computation when users are zooming in a particular area. In addition, mouse selection tests are fasten by computing only octants when the mouse is traversing. The Level-of-detail (LOD) technique reduces rendering costs when objects are far from camera and therefore reduces the amount of vertices rendered. The embedded scheduling system uses a thread pool for parallelizing visualization jobs, and keeps them separated from the rest of the application, which remains responsive. The visualization is loosely coupled with the graph structure and supports incremental asynchronous updates. Besides very fast panning and zooming, the visualization engine implements several helpful interaction techniques for navigating in large networks. The highlighting feature [MCH∗ 09] has been extended to highlight nearest neighbors of selected nodes. Selection and dragging can be performed either with a classical rectangle selection or with a direct mouse mode. Tools are displayed by the side of the graph window in a toolbar and let users interact with selected elements. A various set of tools has been implemented, including brush for coloring nodes, shortest-path or diffusion. A visualization event framework allows to add new tools as plug-ins. The visualization engine is implemented with JOGL (Java OpenGL) and relies on OpenGL 1.5. For a graph of 80K nodes and 70K edges we obtain approximately 5 frames per second when the complete graph is shown and more than 30 frames per second when zooming in. Applying a layout doesn’t interfere on the rendering speed. The test computer we used is a PC with an Intel Core2 T9600, 4GB RAM and Nvidia Quatro FX 3700M running Windows Vista x64. Preview Preview visualization module in Gephi renders the graph exactly how it is exported in SVG or PDF format. Various settings, including text, curved edges or border colors are accessible from the GUI panel. The system lets the users to
visualize the current graph by allowing zooming and panning but without additionnal interaction. The aim is to adjust visual parameters relevant for readability and aestetics, and then export the network graph. The feedbacks provided by the preview dramatically speed up the map creation process and avoid several iterations between the export settings and the visual result. More advanced and resource-consuming visualization techniques are implemented in the preview because performance is not a hurdle. For instance, it displays edge minilabels, the opposite node’s label written on each edge side. The preview is implemented with Processing Java [FR] on top of a flexible framework. 3. Conclusions and Future Work We described Gephi visualisation system, which brings a novel approach for large graph visualization by coupling two specific rendering engines: the first focusing on display performances, the latter on aesthetics refinements. Gephi is freely available and can be downloaded on http://gephi.org. Installers and documentation are provided for 32- and 64-bit Windows, Mac and Linux. Future work on the visualization engine includes using GPU for rendering larger graphs. Performance could be still improved dramatically by using recent GPU technologies, but compatibility with deprecated hardware has to be kept. References [Ada06] A DAR E.: Guess: A language and interface for graph exploration. In CHI ’06: Proceedings of the SIGCHI conference on Human Factors in computing systems (2006). 1 [Aub03] AUBER D.: Tulip-a huge graphs visualization framework. In Graph Drawing Softwares, Mutzel P., Jünger M., (Eds.), Mathematics and Visualization. Springer-Verlag, 2003. 1 [AvHK06] A BELLO J., VAN H AM F., K RISHNAN N.: Askgraphview: A large scale graph visualization system. IEEE Transactions on Visualization and Computer Graphics (2006). 1 [FR]
F RY B., R EAS . C.: Processing. http://processing.org/. 2
[MCH∗ 09] M OSCOVICH T., C HEVALIER F., H ENRY N., P IETRIGA E., F EKETE J.-D.: Topology-aware navigation in large networks. In CHI ’09: Proceedings of the 27th international conference on Human factors in computing systems (2009). 2 [SNK∗ 03] S HARMA A., NAKANO A., K ALIA R. K., VASHISHTA P., KODIYALAM S., M ILLER P., Z HAO W., L IU X., C AMPBELL T. J., H AAS A.: Immersive and interactive exploration of billion-atom systems. Presence: Teleoperators and Virtual Environments (2003). 2 [TAS09] T OMINSKI C., A BELLO J., S CHUMANN H.: Cgv - an interactive graph visualization system. Computers & Graphics (2009). 1 [WB09] W YLIE B., BAUMES J.: A unifed toolkit for information and scientific visualization. Visualization and Data Analysis 2009 (2009). 1 c The Eurographics Association 2010.