Nov 5, 1990 - customers at all the queues are i.i.d. with a general distribution; the system starts out with k ..... 8 -. Section 4. For k ⤠5000 and n ⤠106, all observed normalized averages .... k ( 1 ) for m = 1 , 2 , 3 and 4 by estimating the mth.
USING DISTRIBUTED-EVENT PARALLEL SIMULATION TO STUDY DEPARTURES FROM MANY QUEUES IN SERIES by Albert Greenberg AT&T Bell Laboratories Murray Hill, NJ 07974-0636 Otmar Schlunk Coordinated Science Laboratory University of Illinois Urbana, IL 61801 and Ward Whitt AT&T Bell Laboratories Murray Hill, NJ 07974-0636
November 5, 1990 Revision: November 6, 1991
Abstract
Exciting new opportunities for efficient simulation of complex stochastic systems are emerging with the development of parallel computers with many processors. In this paper we describe an application of a new distributed-event approach for speeding up a single long simulation run to study the transient behavior of a large non-Markovian network of queues. In particular, we implemented the parallel-prefix-based algorithm of Greenberg, Lubachevsky and Mitrani (1991) on the 8192-processor CM-2 Connection machine to simulate the departure times D(k, n) of the k th customer from the n th queue in a long series of single-server queues. Each queue has unlimited waiting space and the first-in first-out discipline; the service times of all the customers at all the queues are i.i.d. with a general distribution; the system starts out with k customers in the first queue and all other queues empty. Glynn and Whitt (1991) established limit theorems for this model, but unfortunately very little could be said about the limits themselves. The simulation results here describe the limits and the quality of the approximations. For this model, speeding up a single long run is far superior to independent replications, because very long runs are required to obtain unbiased estimates of the desired quantities and the variance of the estimator at the end of the run is small. The achieved simulation rate was about thirty billion service completions per hour, which is a speedup by about a factor of 100 compared to simulation on a conventional single-processor machine.
AMS 1980 subject classifications. primary 60K25, 60F17; secondary 90B22, 60J60.
Keywords and phrases. simulation, parallel simulation, parallel processing, queues, queueing networks, tandem queues, departure process, transient behavior, reflected Brownian motion, limit theorems, hydrodynamic limit.
1. Introduction The motivation behind this paper is our desire to better understand the performance of complex stochastic systems such as the AT&T long distance network. This goal leads to the following three questions: 1. What models are appropriate? 2. What do we want to learn from these models? 3. How can we effectively exploit simulation for this purpose?
As always, the appropriate model depends on the features of the system we want to better understand. One important feature is the ‘‘network effect.’’ To capture the network effect, we are led to consider multidimensional models, but to be able to say anything about these multidimensional models, we must make them otherwise relatively simple; e.g., they might be symmetric. Classic examples of models of this sort are the loss networks in Kelly (1991) and Mitra, Gibbens and Huang (1991a,b). One class of interesting questions about these models concerns the transient behavior: How does the multidimensional structure influence the approach to equilibrium? A classic study of the transient behavior of a multidimensional stochastic system is the study of card shuffling in Aldous and Diaconis (1987). In this paper, following Glynn and Whitt (1991), we focus on the transient behavior of a multidimensional non-Markovian model. In particular, we consider a series of n single-server queues, each with unlimited waiting space and the first-in first-out (FIFO) service discipline. The service times of all the customers at all the queues are i.i.d. but with a general distribution. At time 0 the system is empty and k customers are placed in the first queue. We wish to describe the time D(k,n) required for all k customers to complete service from all n queues. In the scheduling literature, this time is often called the makespan.
-2-
This series network problem is of interest in its own right, but we believe it is also of interest as an illustration of the kind of multidimensional models we want to consider and the kinds of questions we want to ask. Hence, when we consider how to effectively apply simulation to analyze this particular problem, we believe that this has important implications for the way we can effectively exploit simulation more generally. As we detail in Section 3, Glynn and Whitt (1991) proved limit theorems describing the asymptotic behavior of D(k,n) as k → ∞ and/or n → ∞. Appropriate normalizations were found under which limits exist, but unfortunately very little could be said about the limits themselves. One purpose here is to apply simulation to describe the limits. Our first answer to the third question above is that simulation can be effectively exploited when used together with mathematical analysis. Together the two methods of analysis yield more than either alone. Another purpose here is to present a case for distributed-event parallel simulation. We contend that models like our series queueing network are natural candidates for applying parallel simulation. Moreover, as we detail in Section 2, we contend that the distributed-event approach is especially effective for these models. We support this claim by our implementation of the distributed-event parallel-prefix-based algorithm of Greenberg, Lubachevsky and Mitrani (1991) on the 8192-processor CM-2 Connection machine to simulate departures from this series network. The achieved simulation rate was about thirty billion service completions per hour, providing speedup by about a factor of 100 compared to simulation on a conventional single-processor machine. Here is how the rest of the paper is organized. In Section 2 we provide background on parallel simulation and in Section 3 we provide background on the limit theorems for the series network. In Section 4 we present our simulation results and in Section 5 we describe our simulation methodology in more detail.
-3-
2. Background on Parallel Simulation The approaches for using parallel processing to speed up simulations can be divided into two classes – those that use parallelism for speeding up a single run and those that do not. The methods that use parallelism to speed up a single run can be further classified as following either the distributed-subsystem approach or the distributed-event approach. We discuss each of these in turn. In evaluating the different approaches, we have in mind very large numbers of processors, including the thousands that are available today and even more that will be available in the future. In particular, the simulations reported here were performed on the 8192-processor CM-2 Connection machine. 2.1 Methods That Do Not Use Parallelism on a Single Run Parallelism sometimes can be effectively exploited by simply performing separate runs on each processor. The different runs may represent different scenarios or independent replications. With different scenarios, we typically use a common random number stream to facilitate comparisons. With independent replications, we typically use independent random number streams and average the results from all the runs to reduce variance. Independent replications also helps determine the statistical quality of the results. The great appeal of these approaches is their simplicity, but they do have drawbacks. First, it may be difficult to simultaneously execute a separate run on each processor. For example, the memory associated with each processor may not be sufficient for a complex system. Moreover, there may be inefficiencies because some scenarios may require much longer runs than others. Second, the ‘‘batch processing’’ nature of multiple scenarios thwarts rapid use of parallel processing for interactive simulation studies. In practice, one simulation suggests another. Determining which scenarios to simulate, and even how long to run the simulation of each
-4-
scenario, requires experimentation. Independent replications avoids some of the difficulties associated with multiple scenarios and indeed it seems to have great promise; see Heidelberger (1986a,b), Glynn and Heidelberger (1990a,b) and Heidelberger and Stone (1990). Many stochastic systems require large experiments in order to obtain reliable estimates; e.g., this is true of even a single queue with high traffic intensity; see Whitt (1989). Moreover, in many cases independent replications are as effective as one long run. However, there typically are difficulties with very large numbers of independent replications of very short runs; see Whitt (1991). Thus, independent replications may have difficulty exploiting the full power of very large numbers of processors. Moreover, we contend that multidimensional complex stochastic systems often exhibit two structural properties that make independent replications even less helpful: First Structural Property. To obtain a useful result from a single replication, the run often must be very long. Independent replications, by itself, thus offers no way to reduce the time required for a given replication. Second Structural Property. The variance of the desired result obtained from each independent replication often is not large. The variance may be such that ten replications may be needed to obtain reliable results, but not thousands. These two structural properties do not hold for the single-queue models discussed in Whitt (1989, 1991), but we contend that these properties often appear with more complex multidimensional stochastic models. Indeed, this is dramatically illustrated by the series queueing network model considered here. 2.2 The Distributed-Subsystem Approach Most parallel simulation methods that have been proposed take the following distributedsubsystem approach; see Fujimoto (1991) for a survey. The system to be simulated is partitioned into subsystems and a different processor is assigned to each subsystem. Applied to the simulation problem here, a different processor would be assigned to each queue or group of queues. A processor generates the sample path of its subsystem, taking care to coordinate with
-5-
other processors on events that couple their sample paths. Unfortunately, the degree of parallelism is limited to the number of subsystems, e.g., the number of queues. On parallel computers having thousands of processors, it may be difficult or impossible to fashion an efficient simulation by partitioning into thousands of subsystems. 2.3 The Distributed-Event Approach If E events with comparable running times are to be simulated on P processors, then the ideal running time would be O(E / P), as if the E events were distributed evenly among the P processors (without significant overhead). The distributed-event approach tries to attain this goal by exploiting parallel methods and by exploiting special properties of the system being simulated. Indeed, for the simulation problem here, we do use completely different methods, presented in Greenberg, Lubachevsky and Mitrani (1991), which exploit special properties of the recurrences describing job arrivals and departures in a series of queues. Our problem here is to simulate the passage of the first K jobs through a series of N queues, yielding O(KN) events. Our algorithm in Section 5 takes O(N( (K / P + log P) ) time using P processors. By duality, see Section 2 of Glynn and Whitt (1991), K and N are interchangeable, so that we may take K to be the larger than N. For large K, the time becomes O(NK / P), which is optimal. The method is simple and well suited for implementation on today’s massively parallel SIMD (single-instruction, multiple-data; i.e., each processor executes the same instruction at each cycle but applies the instruction to different data) computers. We implemented the algorithm on an 8192 processor CM-2 Connection machine.
3. Background on the Series Queueing Network Model The model we consider is a series of n single-server queues, each with unlimited waiting space and the FIFO discipline. The service times of all the customers at all the queues are i.i.d. with a general distribution having mean 1 and finite positive variance σ 2 . At time 0 the system is
-6-
empty and k customers are placed in the first queue. We wish to describe the distribution of the time D(k, n) required for all k customers to complete service from all n queues. In Glynn and Whitt (1991a), hereafter referred to as GW, limit theorems were proved which describe the asymptotic behavior of D(k, n) as k → ∞ and/or n → ∞. We complement GW by applying simulation to describe the limits. The simulation results suggest several interesting conjectures. In §2 of GW it is noted that there is a duality implying that D(k, n) is distributed the same as D(n, k) for each k and n. Hence, limits as n → ∞ have counterparts as k → ∞. As a consequence, a heavy-traffic limit theorem by Iglehart and Whitt (1970) for the case k → ∞ with fixed n implies that n − ⁄ [D(k, n) − n] ==> σDˆ k ( 1 ) 1
2
as n → ∞
for each k ,
(3.1)
where ==> denotes convergence in distribution and Dˆ k ( 1 ) is a functional of a standard kdimensional Brownian motion (BM) Bˆ ≡ (Bˆ 1 , . . . , Bˆ k ), which has independent one-dimensional standard (zero drift, unit variance) BMs B i ≡ {B i (t) : t ≥ 0 } as components; i.e., Dˆ 1 (t) = Bˆ 1 (t) and Dˆ k (t) =
sup D k − 1 (s) + B k (t) − B k (s) , t ≥ 0 . 0≤s≤t
(3.2)
We may also choose to focus on the interdeparture times, defined by ∆(k, n) = D(k + 1 , n) − D(k, n) , k ≥ 1 .
(3.3)
The corresponding limit is n − ⁄ ∆(k, n) ==> σ ∆ˆ k ( 1 ) as n → ∞ , 1
2
(3.4)
where ∆ˆ k = Dˆ k − Dˆ k − 1 with D k ≡ {D k (t) : t ≥ 0 }. The process (∆ˆ 1 , . . . , ∆ˆ k ) is a kdimensional reflected Brownian motion (RBM) as in Harrison (1978), Harrison and
-7-
Reiman (1981a,b), Reiman (1984) and Harrison and Williams (1987). The RBM is to be expected because ∆(k, n) is distributed the same as the sojourn time of customer n at queue k, S(n, k) = D(n, k) − D(n, k − 1 ), by virtue of the duality mentioned above. Given the convergence in (3.1) and (3.4), our main problem is to say something about the limits Dˆ k ( 1 ) and ∆ˆ k ( 1 ). It is significant that these limits do not depend on the underlying service-time distribution. Of course, the convergence in (3.1) and (3.4) depends on the first two moments of the service-time distribution, but only through elementary scaling. Hence, knowledge about Dˆ k ( 1 ) and ∆ˆ k ( 1 ) has quite wide applicability. We are interested in approximations for D(k, n) and ∆(k, n) not only when n is large but also when k is large. This suggests considering the asymptotic behavior of ∆ˆ k ( 1 ) and ∆ˆ k ( 1 ) as k → ∞. Theorem 7.1 of GW implies that k − ⁄ Dˆ k ( 1 ) ==> α as k → ∞ , 1
2
(3.5)
where α is deterministic. One of our primary goals is to estimate the limit α in (3.5). Hence, it is important to note that, for this purpose, our model possesses the two structural properties in §2.1. We need a long run to estimate k − 1/2 EDˆ k ( 1 ) for large k. At the same time, by (3.5), the variance Var [k − 1/2 Dˆ k ( 1 ) ] is going to zero. Indeed, based on our simulations, we conjecture that VarDˆ k ( 1 ) → 0 without normalization, so that the variance of k − 1/2 Dˆ k ( 1 ) is small indeed. Based on (3.5), we also conjecture that k ⁄ E[∆ˆ k ( 1 ) ] ==> α/2 as k → ∞ . 1
2
(3.6)
Indeed, if k ⁄ a k → a as k → ∞ for a deterministic sequence {a k : k ≥ 1 }, then necessarily 1
k−
⁄2
1
k
Σ aj j=1
2
→ 2a (e.g., see Lemma 4 of Glynn and Whitt (1992)).
The limits (3.5) and (3.6) suggest that we might profitably look at D(k, n) with the scaling [D(k, n) − n]/ √ kn for k ≤ n. The advantage of this perspective is apparent from Table 3 in
-8-
Section 4. For k ≤ 5000 and n ≤ 10 6 , all observed normalized averages fall in the interval [0.76, 3.00]. We have mentioned that one of our goals is to estimate the constant α appearing in (3.5) and (3.6). Our simulation evidence strongly indicates that 2 ≤ α ≤ 2. 63. In fact, we conjecture that α = 2. It should be apparent that the estimation presents a challenge for simulation because, by (3.6), α/2 is a limit of the k th coordinate of k-dimensional RBM as k → ∞. To obtain information about Dˆ k ( 1 ), ∆ˆ k ( 1 ) and α as well as D(k, n) and ∆(k, n), we simulated the series of queues for two service-time distributions having mean and variance one: exponential and Bernoulli. The Bernoulli random variables assume the values 0 and 2 each with probability 1/2. To obtain relatively reliable estimates, we performed multiple independent replications for n up to 10 6 and k up to 5000. (In fact, we actually switched the role of n and k.) In GW attention was not only focused on the iterative limit as first n → ∞ in (3.1) and then k → ∞ in (3.5), but also on the joint limit with k ≡ k n → ∞ as n → ∞. Indeed, in some sense it is shown that [D(k n , n) − n]/ √ nk n ==> α as n → ∞
(3.7)
with k n → ∞ satisfying k n ≤ n 1 − ε . However, a very different story exists for k n = n. Theorem 6.3 of GW shows that for service-time distributions having an exponential tail that n − 1 D(xn, n) → γ(x) as n → ∞ ,
(3.8)
where x is the integer part of x. In the case of exponential service-time distributions, it follows from Srinivasan (1989) that γ(x) = ( 1 + √ x ) 2 . In GW it is conjectured that γ( 1 ) in (3.8) depends on the service-time distribution beyond its first two moments. This is verified by simulation here. From the simulation results, it is clear that γ( 1 ) < 4 for the Bernoulli distribution.
-9-
For estimating the limit γ(x) in (3.8), it is also evident that we have the two structural properties in §2.1.
4. Simulation Results 4.1 The Simulation Cases Table 1 displays estimates of the first, second and fourth moments of ∆(k, n)/ √n for an exponential service time with mean 1 in the cases k = 1 , 2 , . . . , 10 and n = 10 j for j = 1 , 2 , . . . , 6. Table 2 contains the associated estimates of the squared coefficient of variation (SCV, variance divided by the square of the mean) of ∆(k, n)/ √n based on Table 1. These estimates are based on 1000 independent replications. In each replication, D(k, 10 j ) is obtained for each k and j, so that the results for different k and j are dependent. Obviously the dependence is greater as we change k for fixed j than when we change j for fixed k. Tables 3 and 4 display the mean, second moment and SCV of [D(k, n) − n]/ √ kn for the same cases, based on the same 1000 replications. The normalization is motivated by the limits (3.1), (3.5), (3.7) and (3.8). To obtain estimates of ∆(k, n), D(k, n), ∆ˆ k ( 1 ) and Dˆ k ( 1 ) for larger k, we performed 10 independent replications for k = 10 3 and n = 10 6 . These values appear in Tables 3, 5 and 7. We also performed a few runs for k = 5000 and n = 10 6 . In addition to the case of exponential service times, we also considered Bernoulli service times, which assume the values 0 or 2, each with probability 1/2. Results for the Bernoulli distribution appear in Tables 5-7. 4.2 Properties of Dˆ k ( 1 ) and ∆ˆ k ( 1 ) By (3.2), Dˆ k ( 1 ) is increasing in k and, by §5 of GW, ∆ˆ k ( 1 ) is stochastically decreasing in k. d
By Remark 3.3 of GW, ∆ˆ 1 = Bˆ 2 − Bˆ 1 = √2 Bˆ 1 . Hence, ∆ˆ 1 ( 1 ) has a positive normal distribution with E[∆ˆ 1 ( 1 ) ] = 2/ √π = 1. 128, E[∆ˆ ( 1 ) 2 ] = 2 and E[∆ˆ ( 1 ) 4 ] = 12. We now
- 10 -
describe additional properties deduced from the simulations. The numerical evidence strongly supports the conclusions that E[Dˆ k ( 1 ) ]/ √ k is increasing in k to the established limit α and that, remarkably, Var Dˆ k ( 1 ) → 0 as k → ∞; see Tables 3, 5 and 6. The numerical evidence also suggests that EDˆ k ( 1 ) − α √ k = o( √ k ) as k → ∞, so that Dˆ k ( 1 ) − α √ k ==> 0 as k → ∞ .
(4.1)
It is of course hard to pin down specific numbers precisely, but it appears that α = 2. 0. The numerical evidence appears stronger in the Bernoulli case in Table 6 than in the exponential case in Table 3, but both give quite strong support. In addition to the numerical evidence, we offer the following heuristic argument (developed after seeing the numerical results). For the exponential case, we know that n − 1 D(xn, n) → ( 1 + √ x ) 2 w.p.1 as n → ∞ for each fixed x by Theorem 6.1 of GW. We act as if this is true for x of the form x / n. Then n − 1 [D(x, n) − n] ∼ / n ) 2 − 1 = 2 √x /n + x/n ∼ ( 1 + √x
for large n
or n − ⁄ [D(x, n) − n] ∼ x + x / √n ∼ 2 √ 1
2
for large n .
(4.2)
Finally, we act as if the first term on the right of (4.2) is valid for all service-time distributions. As rough approximations for the mean and standard deviation of Dˆ k ( 1 ), we propose log k k − 1. 6 _____ EDˆ k ( 1 ) ∼ ∼ 2 √ √k
and
4 SD(Dˆ k ( 1 ) ) ∼ ∼ _______ ; 3 log k
(4.3)
e.g., see Tables 3, 5 and 6. It is quite difficult to determine the asymptotic form of SD(Dˆ k ( 1 ) ) from the simulation results; e.g., it might be of order k − 1/4 instead of ( log k) − 1 as in (4.3). For the three cases in Table 5 with k = 10 j for j = 1 , 2 , 3, (4.3) yields estimates for SD(Dˆ k ( 1 ) ) of 0.58, 0.29 and 0.19; whereas k −
⁄4
1
yields 0.56, 0.32 and 0.18.
As an extension of (4.1), we conjecture that
- 11 -
ˆ k ( 1 ) − 2 √k _D ____________ ==> L 1 as k → ∞ , SD(D k ( 1 ) )
(4.4)
where L 1 has mean 0 and variance 1. From (4.3)–(4.4), we obtain the approximation. log k 4 Dˆ k ( 1 ) ∼ k − 1. 6 _____ ± _______ , ∼ 2 √ 3 log k √k
(4.5)
where ± δ means that δ is the estimated standard deviation. Note that (4.5) implies that the approximation improves, in an absolute sense as well as a relative sense, as k increases. For example, by (4.5), Dˆ 10 ( 1 ) ∼ ∼ 6. 32 − 1. 18 ± 0. 58 ∼ ∼ 5. 14 ± 0. 58
(4.6)
Dˆ 1000 ( 1 ) ∼ ∼ 63. 25 − 0. 35 ± 0. 19 ∼ ∼ 62. 90 ± 0. 19 .
(4.7)
and
Turning to ∆ˆ k ( 1 ), we conjecture that
√k E∆ˆ k ( 1 ) → 1 as k → ∞ ,
(4.8)
by virtue of (3.6). Indeed, the limit in (4.8) seems to provide a remarkably good approximation for all k. We conjecture that
√k E∆ˆ k ( 1 ) ≥ 1
for all k
(4.9)
and k E∆ˆ k ( 1 ) − 1 ≤ 0. 10 √
for all k ≥ 2 .
(4.10)
We also estimate the m th moment of ∆ˆ k ( 1 ) for m = 1 , 2 , 3 and 4 by estimating the m th moment of ∆(k, n)/ √n for n = 10 6 using the following estimator
- 12 -
_1_ n
n
Σ
j=1
∆(k, j) _______ √j
m
.
(4.11)
The smoothing in (4.11) significantly decreases the variance, but it also introduces a bias, which is itself hard to estimate. We used (4.11) in 10 replications with n = 10 6 and k = 10 3 . The resulting 95% confidence intervals (based on a t-distribution with 9 degrees of freedom) were
√k E[∆ˆ k ( 1 ) ] = 1. 070 ± 0. 005 k E[∆ˆ k ( 1 ) 2 ] = 2. 237 ± 0. 023 k 2 E[∆ˆ k ( 1 ) 4 ] = 25. 8 ± 0. 76 .
(4.12)
If the bias in (4.11) is not significant, then (4.12) implies that γˆ ( 1 ) ∼ ∼ 2. 14 instead of 2.0. However, we suspect the discrepancy is due to the bias in (4.11). We also conjecture that the SCV of ∆ˆ k ( 1 ) is increasing in k from the exact value of 0.57 for k = 1 to an upper limit, which we conjecture is 1. (See Table 4. The estimates in (4.12) indicate that the upper limit should be about 0.954.) Hence, we further conjecture that
√k ∆ˆ k ( 1 ) ==> L 2 as k → ∞ ,
(4.13)
where E L 2 = Var L 2 = 1 and EL 42 ∼ ∼ 25. The limit (4.13) leads to the approximation 1 1 ∆ˆ k ( 1 ) ∼ ∼ ____ ± ____ . √k √k
(4.14)
As we should expect, (4.5) and (4.14) indicate that ∆ˆ k ( 1 ) is much more relatively variable than Dˆ k ( 1 ) and thus harder to predict. If the random variables ∆ˆ k ( 1 ) were uncorrelated, then we would have Var Dˆ k ( 1 ) ∼ ∼ log k, assuming that Var ∆ˆ k ( 1 ) ∼ ∼ 1. 8/( log k) 2 . ∼ 1/ k. However, from (4.3) we see that Var Dˆ k ( 1 ) ∼ The fact that
- 13 -
Var Dˆ k ( 1 )
1000. The asterisked value for k = 10 6 is estimated from the case k = n = 5000.
____________________________________________________________________________ k n = 10 1 n = 10 2 n = 10 3 n = 10 4 n = 10 5 n = 10 6 _______________________________________________________________ 2 1.15 1.05 0.96 0.96 1.00 1.03 1.74 1.55 1.41 1.40 1.42 1.45 3 2.20 1.95 1.77 1.74 1.75 1.76 4 5 2.66 2.26 2.02 2.00 2.00 1.99 second 6 3.08 2.47 2.22 2.17 2.18 2.22 moment 7 3.44 2.69 2.43 2.34 2.33 2.34 3.79 2.85 2.56 2.46 2.44 2.45 8 4.17 3.07 2.70 2.58 2.54 2.56 9 4.50 3.22 2.82 2.68 2.62 2.66 10 11 4.81 3.34 2.90 2.76 2.70 2.71 _ ___________________________________________________________________________ 1 2 3 4 5 6 _k______________________________________________________________ n = 10 n = 10 n = 10 n = 10 n = 10 n = 10 0.76 0.66 0.62 0.62 0.60 0.57 2 3 0.65 0.52 0.47 0.48 0.46 0.44 4 0.57 0.46 0.40 0.39 0.40 0.38 5 0.50 0.36 0.34 0.31 0.31 0.38 0.47 0.36 0.30 0.31 0.33 0.30 standard 6 0.45 0.36 0.24 0.24 0.28 0.24 deviation 7 8 0.42 0.31 0.25 0.24 0.26 0.28 9 0.50 0.42 0.21 0.23 0.21 0.25 10 0.46 0.30 0.25 0.30 0.30 0.32 0.43 0.25 0.28 0.27 0.27 0.29 ____________________________________________________________________________ 11 Table 4. Estimates of the second moment and standard deviation of [D(k, n) − n]/ √ kn in the case of exponential service times with mean 1 based on 1000 independent observations.
___________________________________________________ quantity estimated exponential Bernoulli ___________________________________________________ mean 5.112 5.065 std. dev. 0.648 0.627 k = 10 mean/√ k 1.617 1.602 ±0.0013 ±0.0012 95% conf. int. ___________________________________________________ 19.40 19.25 mean std. dev. 0.29 0.28 k = 100 mean/√ k 1.940 1.925 95% conf. int. ___________________________________________________ ±0.0066 ±0.0063 mean 63.763 62.821 std. dev. 0.177 0.208 k = 1000 mean/√ k 2.016 1.987 95% conf. int. ___________________________________________________ ±0.0013 ±0.0015
Table 5. Estimates of the mean and standard deviation of [D(k, n) − n]/ √n for n = 10 6 and k = 10 j for j = 1 , 2 , 3. The cases k = 100 and 1000 are based on 10 independent replications, while the case k = 10 is based on 1000 independent replications. The 95% confidence interval for the mean/√ k is given in each case based on the Student t distribution.
___________________________________________________________ ___________________________________________________________ service-time distribution exponential Bernoulli ___________________________________________________________ n = 10 n = 100 n = 1000 n = 10 n = 100 n = 1000 _______________________________________________________________________________ mean 30.8 380.8 29.9 356.8 3,951 3,619 _ ______________________________________________________________________________ standard deviation 4.26 7.21 25.8 2.90 5.00 9.3 _ ______________________________________________________________________________ variance 18.19 52.00 666.1 8.39 24.97 87.4 _ ______________________________________________________________________________ 1000 1000 _______________________________________________________________________________ sample size 10 10 10 10 variance/n 1.82 0.52 0.67 0.84 0.25 0.087 _______________________________________________________________________________ variance/n 3/4 3.23 1.64 3.74 1.49 0.79 0.49 _______________________________________________________________________________ 1/2 variance/n 5.75 5.20 21.1 2.65 2.50 2.76 _______________________________________________________________________________ Table 7. Estimates of the mean standard deviation and variance of D(n, n) for n = 10 j for j = 1 , 2 , 3 for the cases of exponential and Bernoulli service times.
To: marko Subject: info
In the new latgreen (verylatgreen?) there are some pictures included using
To get this to work for you you should strip the /usr/albert/Ward/DATA part, and in the troff command include -mpictures after your -mm.
If that doesn’t make sense, its fine to just comment out these pictures by bracketing them with
-- Albert %!PS-Adobe-2.0 EPSF-2.0 %%Title: S graphics %%Creator: albert %%CreationDate: Thu Jan 23 16:40:38 1992 %%Pages: (atend) %%BoundingBox: 20 11 591 781 %%EndComments % beginning of preamble 100 dict begin /bd {bind def} def % drawing commands /I {Coord SetPage 1 setlinecap 1 setlinejoin LineTypes {RastersPerPoint ScaleArray} forall /Helvetica findfont PointSize RastersPerPoint mul Cex mul scalefont setfont} bd /A {PageBegin} bd /B {newpath} bd /C {currentpoint stroke moveto} bd /E {stroke} bd /M {moveto} bd /L {lineto} bd /S {moveto lineto stroke} bd /F {closepath fill} bd /P {gsave moveto Pch-x Pch-y rmoveto Pch Show grestore} bd /T {/Adjust exch def gsave translate StringRot rotate 0 0 moveto dup stringwidth pop neg Adjust mul 0 rmoveto currentpoint translate TextShow grestore} bd /X {erasepage InPage {PageEnd} if} bd /Z {gsave showpage grestore PageEnd} bd /W {end} bd
% parameter setting commands /St {1 sub LineTypes dup 3 1 roll length Rem floor get 0 setdash} bd /Sw {abs 2 div RastersPerPoint mul setlinewidth SetClip} bd /Sc {dup dup 1 lt exch 0 ge and {1 exch sub setgray} {1 sub Colors dup 3 1 roll length Rem floor get
dup type /arraytype eq {aload pop
sethsbcolor} {setgray} ifelse} ifelse} bd /Sp {Pch exch 0 exch put SetPchSize} bd /Sx {dup Cex div /Ratio exch def /Cex exch def currentfont Ratio scalefont setfont /Pch-x Pch-x Ratio mul def /Pch-y Pch-y Ratio mul def /Text-y Text-y Ratio mul def} bd /So {4 1 roll exch 4 -1 roll Plot astore pop SetClip} bd /Sg {4 1 roll exch 4 -1 roll Figure astore pop SetClip} bd /Sr {/StringRot exch def} bd /Sh {/CharRot
exch def} bd /Sd {0 eq /ClipToPlot exch def SetClip} bd /Sf {dup 0 lt /Outline exch def abs 1 sub Fonts dup 3 1 roll length Rem floor get findfont PointSize Cex mul RastersPerPoint mul scalefont dup setfont dup /FontMatrix get /Matrix exch def /FontBBox get aload pop Matrix transform 4 2 roll Matrix transform exch pop add /Text-y exch def pop SetPchSize} bd
% other variable definitions /InPage false def /Clip 4 array def /Page 4 array def /Figure [0 0 1 1] def /Plot [0 0 1 1] def /ClipToPlot true def /Cex 1 def /Outline false def /Pch 1 string def /Pch-x 0 def /Pch-y 0 def /Text-y 0 def /LineTypes [ % in default units 2] 13]
[4 4] [6 5]
[8 4]
[13 3]
[16 2 2 2]
[]
[1
[8 2 2 2]
[1
[12 4] ] def
% other procedure definitions /Rem {2 copy div floor mul sub floor cvi} bd /RastersPerPoint {RastersPerInch 72 div} bd /ScaleArray {/Factor exch def /Array exch def length 1 sub
0 1 Array
{dup Array exch get Factor mul Array 3 1 roll put} for} bd /Coord
{Region aload pop /uy exch def /ux exch def /ly exch def /lx exch def Landscape {exch} if /Width exch def /Height exch def rotate 0 Height neg translate} if
uy ly sub ux lx sub
lx ly translate Landscape {90
1 RastersPerPoint div dup scale} bd /SetPchSize {gsave
newpath 0 0 moveto Pch false charpath flattenpath pathbbox add 2 div neg /Pch-y exch def
exch 3 1 roll
add 2 div neg /Pch-x exch def
grestore} bd /TextShow {CharRot StringRot sub dup 0 eq {pop SimpleShow} {FancyShow} ifelse} bd /SimpleShow {0 Text-y 2 div neg rmoveto Show} bd /FancyShow { exch def
/Cos RotDiff cos abs def ( ) dup 0 4 -1 roll put Cos 0 eq {
/Sin RotDiff sin abs def
/RotDiff {
dup stringwidth pop /CharWidth exch def Text-y Sin div
} {
Sin 0 eq { }
CharWidth Cos div
{
/H
Text-y
Sin
div
/W CharWidth Cos div def lt {H} {W} ifelse def
0
} ifelse 2 div /CharDist exch
translate
0
0
RotDiff rotate neg
HW
} ifelse CharDist
def
moveto
gsave
CharWidth 2 div neg Text-y 2 div
rmoveto
Outline grestore
{false
charpath
stroke}
{show}
CharDist 0 translate 0 0 moveto
ifelse
} forall } bd
/Show {Outline {false charpath stroke} {show} ifelse} bd /BoxClip {/CLW currentlinewidth def 2 {CLW add 4 1 roll} repeat
2 {CLW sub 4 1 roll} repeat
newpath 2 index exch 2 index exch dup 6 index exch
initclip
moveto 3 {lineto} repeat closepath
clip newpath} bd /Subregion {/A exch def /Uy exch def /Ux exch def /Ly exch def /Lx exch def Ux Lx sub A 0 get mul Lx add Lx sub A 2 get mul Lx add
Uy Ly sub A 1 get mul Ly add
Ux
Uy Ly sub A 3 get mul Ly add} bd /SetFigure {Page aload
pop Figure Subregion} bd /SetPlot {SetFigure Plot Subregion} bd /SetClip {ClipToPlot {SetPlot} {SetFigure} ifelse BoxClip} bd /SetPage {0 0 Width Height Page astore RastersPerPoint ScaleArray} bd /PageBegin {save /PageContext exch def /InPage true def} bd /PageEnd {PageContext restore /InPage false def} bd % end of preamble
% fixed controlling parameters /Landscape false def /Region [20.8788 11.802 590.881 780.438] def /RastersPerInch 300 def /PointSize 14 def /Fonts [ /Times-Roman BoldOblique
/Helvetica-Oblique /Courier-Oblique
/Times-Italic
/Times-Bold
/AvantGarde-Book /AvantGarde-DemiOblique
/Helvetica /Helvetica-Bold
/Courier-Bold
/Bookman-Demi
/Helvetica-
/Courier-BoldOblique
/Times-BoldItalic
/AvantGarde-BookOblique
/Courier
/Symbol /AvantGarde-Demi
/Bookman-DemiItalic
/Bookman-Light
/Bookman-LightItalic
/Helvetica-Narrow-Bold Narrow-Oblique
Roman
/Helvetica-Narrow-BoldOblique
/NewCenturySchlbk-Roman
/NewCenturySchlbk-Italic
0.3
0.9
0.4
/Helvetica-
/NewCenturySchlbk-Bold
/NewCenturySchlbk-BoldItalic
/Palatino-Bold /ZapfChancery-MediumItalic
/Helvetica-Narrow
/Palatino-Italic
/Palatino/Palatino-BoldItalic
/ZapfDingbats ] def /Colors [ 0.7
0.1
0.5
0 0.8
0.6 0.2 ]
def
% all initialization action here I
%%EndProlog
%%Page: 1 1 A 1 St 1 Sw 1 Sc 0 Sr 111 Sp 1 Sx 0.120842 0.938106 0.11147 0.910387 So 0 1 0 1 Sg 0 Sh 0 Sd 1 Sf 359 452 P 500 492 P 574 669 P 625 682 P 666 689 P 700 728 P 729 761 P 755 786 P 779 813 P 800 823 P 820 845 P 839 850 P 856 954 P 873 954 P 888 967 P 903 992 P 918 1012 P 931 1028 P 945 1035 P 958 1040 P 970 1067 P 982 1073 P 994 1080 P 1005 1080 P 1017 1103 P 1028 1114 P 1038 1121 P 1049 1164 P 1059 1182 P 1070 1198 P 1080 1209 P 1089 1209 P 1099 1220 P 1109 1286 P 1118 1304 P 1128 1320 P 1137 1329 P 1146 1336 P 1156 1340 P 1165 1345 P 1174 1365 P 1183 1370 P 1192 1388 P 1200 1388 P 1209 1397 P 1218 1401 P 1227 1403 P 1236 1440 P 1244 1442 P 1253 1465 P 1262 1476 P 1271 1507 P 1279 1507 P 1288 1512 P 1297 1517 P 1306 1519 P 1315 1532 P 1323 1539 P 1332 1557 P 1341 1573 P 1350 1578 P 1360 1596 P 1369 1618 P 1378 1621 P 1387 1623 P 1397 1657 P 1406 1666 P 1416 1679 P 1426 1697 P 1435 1713 P 1445 1738 P 1456 1743 P 1466 1761 P 1477 1774 P 1487 1790 P 1498 1799 P 1510 1801 P 1521 1826 P 1533 1842 P 1545 1844 P 1557 1853 P 1570 1860 P 1584 1874 P 1597 1890 P 1612 1908 P 1627 1910 P 1642 1923 P
1659 1978 P 1676 1987 P 1695 1996 P 1715 2039 P 1736 2082 P 1760 2122 P 1786 2156 P 1815 2274 P 1849 2387 P 1890 2473 P 1941 2489 P 2015 2755 P 2156 2821 P 1 Sd (Quantiles of Standard Normal) 1258 112 0.5 T 90 Sr 90 Sh (Sorted Data) 42 1636 0.5 T 0 Sr 0 Sh 560 357 560 318 S 909 357 909 318 S 1258 357 1258 318 S 1606 357 1606 318 S 1955 357 1955 318 S 560 357 1955 357 S (-2) 560 252 0.5 T (-1) 909 252 0.5 T (0) 1258 252 0.5 T (1) 1606 252 0.5 T (2) 1955 252 0.5 T 90 Sr 90 Sh 287 596 248 596 S 287 1162 248 1162 S 287 1727 248 1727 S 287 2292 248 2292 S 287 2857 248 2857 S 287 596 287 2857 S (1.85) 182 596 0.5 T (1.90) 182 1162 0.5 T (1.95) 182 1727 0.5 T (2.00) 182 2292 0.5 T (2.05) 182 2857 0.5 T 0 Sr 0 Sh 0 Sd B 287 2916 M 287 357 L 2228 357 L 2228 2916 L 287 2916 L E Z
%%Trailer W %%Pages: 1 %!PS-Adobe-2.0 EPSF-2.0 %%Title: S graphics %%Creator: albert %%CreationDate: Thu Jan 23 16:40:41 1992 %%Pages: (atend) %%BoundingBox: 20 11 591 781 %%EndComments % beginning of preamble 100 dict begin /bd {bind def} def % drawing commands /I {Coord SetPage 1 setlinecap 1 setlinejoin LineTypes {RastersPerPoint ScaleArray} forall /Helvetica findfont PointSize RastersPerPoint mul Cex mul scalefont setfont} bd /A {PageBegin} bd /B {newpath} bd /C {currentpoint stroke moveto} bd /E {stroke} bd /M {moveto} bd /L {lineto} bd /S {moveto lineto stroke} bd /F {closepath fill} bd /P {gsave moveto Pch-x Pch-y rmoveto Pch Show grestore} bd /T {/Adjust exch def gsave translate StringRot rotate 0 0 moveto dup stringwidth pop neg Adjust mul 0 rmoveto currentpoint translate TextShow grestore} bd /X {erasepage InPage {PageEnd} if} bd /Z {gsave showpage grestore PageEnd} bd /W {end} bd
% parameter setting commands /St {1 sub LineTypes dup 3 1 roll length Rem floor get 0 setdash} bd /Sw {abs 2 div RastersPerPoint mul setlinewidth SetClip} bd /Sc {dup dup 1 lt exch 0 ge and
{1 exch sub setgray} {1 sub Colors dup 3 1 roll length Rem floor get
dup type /arraytype eq {aload pop
sethsbcolor} {setgray} ifelse} ifelse} bd /Sp {Pch exch 0 exch put SetPchSize} bd /Sx {dup Cex div /Ratio exch def /Cex exch def currentfont Ratio scalefont setfont /Pch-x Pch-x Ratio mul def /Pch-y Pch-y Ratio mul def /Text-y Text-y Ratio mul def} bd /So {4 1 roll exch 4 -1 roll Plot astore pop SetClip} bd /Sg {4 1 roll exch 4 -1 roll Figure astore pop SetClip} bd /Sr {/StringRot exch def} bd /Sh {/CharRot exch def} bd /Sd {0 eq /ClipToPlot exch def SetClip} bd /Sf {dup 0 lt /Outline exch def abs 1 sub Fonts dup 3 1 roll length Rem floor get findfont PointSize Cex mul RastersPerPoint mul scalefont dup setfont dup /FontMatrix get /Matrix exch def /FontBBox get aload pop Matrix transform 4 2 roll Matrix transform exch pop add /Text-y exch def pop SetPchSize} bd
% other variable definitions /InPage false def /Clip 4 array def /Page 4 array def /Figure [0 0 1 1] def /Plot [0 0 1 1] def /ClipToPlot true def /Cex 1 def /Outline false def /Pch 1 string def /Pch-x 0 def /Pch-y 0 def /Text-y 0 def /LineTypes [ % in default units 2] 13]
[4 4] [6 5]
[8 4]
[13 3]
[16 2 2 2]
[] [8 2 2 2]
[1 [1
[12 4] ] def
% other procedure definitions /Rem {2 copy div floor mul sub floor cvi} bd /RastersPerPoint {RastersPerInch 72 div} bd /ScaleArray {/Factor exch def /Array exch def length 1 sub
0 1 Array
{dup Array exch get Factor mul Array 3 1 roll put} for} bd /Coord
{Region aload pop /uy exch def /ux exch def /ly exch def /lx exch def Landscape {exch} if /Width exch def /Height exch def rotate 0 Height neg translate} if
uy ly sub ux lx sub
lx ly translate Landscape {90
1 RastersPerPoint div dup scale} bd /SetPchSize {gsave
newpath 0 0 moveto Pch false charpath flattenpath pathbbox add 2 div neg /Pch-y exch def
exch 3 1 roll
add 2 div neg /Pch-x exch def
grestore} bd /TextShow {CharRot StringRot sub dup 0 eq {pop SimpleShow} {FancyShow} ifelse} bd /SimpleShow {0 Text-y 2 div neg rmoveto Show} bd /FancyShow { exch def
/Cos RotDiff cos abs def
/Sin RotDiff sin abs def
( ) dup 0 4 -1 roll put
{
dup stringwidth pop /CharWidth exch def
Cos 0 eq {
Text-y Sin div
Sin 0 eq { }
/RotDiff
} {
CharWidth Cos div
{
/H
Text-y
Sin
div
/W CharWidth Cos div def lt {H} {W} ifelse def
} ifelse CharDist
0
HW } ifelse 2 div /CharDist exch
translate
0
RotDiff rotate neg
def
0
moveto
gsave
CharWidth 2 div neg Text-y 2 div
rmoveto
Outline grestore
{false
charpath
stroke}
{show}
CharDist 0 translate 0 0 moveto
ifelse
} forall } bd
/Show {Outline {false charpath stroke} {show} ifelse} bd /BoxClip {/CLW currentlinewidth def 2 {CLW add 4 1 roll} repeat
2 {CLW sub 4 1 roll} repeat
newpath 2 index exch 2 index exch dup 6 index exch
initclip
moveto 3 {lineto} repeat closepath
clip newpath} bd /Subregion {/A exch def /Uy exch def /Ux exch def /Ly exch def /Lx exch def Ux Lx sub A 0 get mul Lx add Lx sub A 2 get mul Lx add
Uy Ly sub A 1 get mul Ly add
Ux
Uy Ly sub A 3 get mul Ly add} bd /SetFigure {Page aload
pop Figure Subregion} bd /SetPlot {SetFigure Plot Subregion} bd /SetClip {ClipToPlot
{SetPlot} {SetFigure} ifelse BoxClip} bd /SetPage {0 0 Width Height Page astore RastersPerPoint ScaleArray} bd /PageBegin {save /PageContext exch def /InPage true def} bd /PageEnd {PageContext restore /InPage false def} bd % end of preamble
% fixed controlling parameters /Landscape false def /Region [20.8788 11.802 590.881 780.438] def /RastersPerInch 300 def /PointSize 14 def /Fonts [ /Times-Roman BoldOblique
/Helvetica-Oblique /Courier-Oblique
/Times-Italic
/Bookman-Light
Narrow-Oblique
/Times-BoldItalic
0.3
/Bookman-DemiItalic
0.9
0.4
/Helvetica-Narrow
/Helvetica-Narrow-BoldOblique
/Helvetica-
/NewCenturySchlbk-Bold
/NewCenturySchlbk-BoldItalic
/Palatino-Bold /ZapfChancery-MediumItalic
/Symbol /AvantGarde-Demi
/Bookman-Demi
/NewCenturySchlbk-Roman
/NewCenturySchlbk-Italic
/Helvetica-
/Courier-BoldOblique
/Bookman-LightItalic
/Helvetica-Narrow-Bold
Roman
/Courier-Bold
/AvantGarde-BookOblique
/AvantGarde-DemiOblique
/Courier
/Helvetica-Bold
/Times-Bold
/AvantGarde-Book
/Helvetica
/Palatino-Italic
/Palatino/Palatino-BoldItalic
/ZapfDingbats ] def /Colors [ 0.7
0.1
0.5
0 0.8
0.6 0.2 ]
def
% all initialization action here I
%%EndProlog
%%Page: 1 1 A 1 St 1 Sw 1 Sc 0 Sr 111 Sp 1 Sx 0.120842 0.938106 0.11147 0.910387 So 0 1 0 1 Sg 0 Sh 0 Sd 1 Sf 359 452 P 517 452 P 622 743 P 701 743 P 764 914 P 817 914 P 862 1035 P 902 1129 P 938 1129 P 970 1206 P 1000 1206 P 1027 1376 P 1052 1376 P 1076 1376 P 1098
1420 P 1119 1420 P 1139 1420 P 1158 1497 P 1176 1497 P 1193 1531 P 1210 1531 P 1225 1531 P 1241 1562 P 1255 1591 P 1270 1618 P 1283 1668 P 1297 1668 P 1310 1668 P 1322 1691 P 1335 1712 P 1347 1733 P 1358 1733 P 1370 1752 P 1381 1771 P 1392 1789 P 1403 1789 P 1413 1806 P 1423 1806 P 1434 1822 P 1444 1838 P 1454 1854 P 1463 1883 P 1473 1935 P 1482 1935 P 1492 1948 P 1501 1959 P 1510 1959 P 1519 1971 P 1528 1971 P 1537 1993 P 1545 2004 P 1554 2024 P 1563 2024 P 1571 2034 P 1580 2053 P 1588 2063 P 1597 2072 P 1605 2072 P 1614 2089 P 1622 2089 P 1630 2114 P 1639 2145 P 1647 2145 P 1655 2145 P 1664 2167 P 1672 2174 P 1681 2174 P 1689 2181 P 1697 2181 P 1706 2208 P 1714 2227 P 1723 2233 P 1732 2251 P 1740 2263 P 1749 2279 P 1758 2279 P 1767 2290 P 1777 2331 P 1786 2345 P 1795 2350 P 1805 2402 P 1815 2418 P 1825 2422 P 1836 2425 P 1847 2452 P 1858 2459 P 1869 2459 P 1881 2476 P 1894 2483 P 1907 2483 P 1921 2534 P 1937 2554 P 1953 2582 P 1971 2605 P 1992 2615 P 2016 2740 P 2045 2801 P 2085 2807 P 2156 2821 P 1 Sd (Quantiles of Exponential Mean 1) 1258 112 0.5 T 90 Sr 90 Sh (Sorted Data) 42 1636 0.5 T 0 Sr 0 Sh 726 357 726 318 S 938 357 938 318 S 1432 357 1432 318 S 1645 357 1645 318 S 2138 357 2138 318 S 726 357 2138 357 S (0.05) 726 252 0.5 T (0.10) 938 252 0.5 T (0.50) 1432 252 0.5 T (1.00) 1645 252 0.5 T (5.00) 2138 252 0.5 T 90 Sr 90 Sh 287 837 248 837 S 287 1129 248 1129 S 287 1806 248 1806 S 287 2098 248 2098 S 287 2775 248 2775 S 287 837 287 2775 S (0.005) 182 837 0.5 T (0.010) 182 1129 0.5 T (0.050) 182 1806 0.5 T (0.100) 182 2098 0.5 T (0.500) 182 2775 0.5 T 0 Sr 0 Sh 0 Sd B 287 2916 M 287 357 L 2228 357 L 2228 2916 L 287 2916 L E Z
%%Trailer W %%Pages: 1
USING DISTRIBUTED-EVENT PARALLEL SIMULATION TO STUDY DEPARTURES FROM MANY QUEUES IN SERIES by
Albert G. Greenberg AT&T Bell Laboratories Murray Hill, NJ 07974-0636
Otmar Schlunk Coordinated Science Laboratory University of Illinois Urbana, IL 61801
and
Ward Whitt AT&T Bell Laboratories Murray Hill, NJ 07974-0636
February 5, 1992
Abstract
Exciting new opportunities for efficient simulation of complex stochastic systems are emerging with the development of parallel computers with many processors. In this paper we describe an application of a new distributed-event approach for speeding up a single long simulation run to study the transient behavior of a large non-Markovian network of queues. In particular, we implemented the parallel-prefix-based algorithm of Greenberg, Lubachevsky and Mitrani (1990, 1991) on the 8,192-processor CM-2 Connection machine and the 16,384-processor MasPar computer to simulate the departure times D(k, n) of the k th customer from the n th queue in a long series of single-server queues. Each queue has unlimited waiting space and the first-in first-out discipline; the service times of all the customers at all the queues are i.i.d. with a general distribution; the system starts out with k customers in the first queue and all other queues empty. Glynn and Whitt (1991) established limit theorems for this model, but very little could be said about the limits themselves. The simulation results here describe the limits and the quality of the approximations resulting from using the limits for finite k and n. Indeed, the simulations suggest some very interesting conjectures. For this model, speeding up a single long run is far superior to independent replications, because very long runs are required to obtain unbiased estimates of the desired quantities and the variance of the estimator at the end of the run is small. The achieved simulation rate was about seventeen billion service completions per hour, which is a speedup by about a factor of 100 compared to simulation on a conventional single-processor machine. This speedup contributed greatly to performing the desired experiments. AMS 1980 subject classifications. primary 60K25, 60F17; secondary 90B22, 60J60. Keywords and phrases. simulation, parallel simulation, parallel processing, queues, queueing networks, tandem queues, departure process, transient behavior, reflected Brownian motion, limit theorems, hydrodynamic limit.
6. Introduction The motivation behind this paper is our desire to better understand the performance of complex stochastic systems such as the AT&T long distance network. This goal leads to the following three questions: 1. What models are appropriate? 2. What do we want to learn from these models? 3. How can we effectively exploit simulation for this purpose?
As always, the appropriate model depends on the features of the system we want to better understand. One important feature is the ‘‘network effect.’’ To capture the network effect, we are led to consider multidimensional models, but to be able to say anything interesting about these multidimensional models, we must make them otherwise relatively simple; e.g., they might be symmetric. Classic examples of models of this sort are the loss networks in Kelly (1991) and Mitra, Gibbens and Huang (1991a,b). One class of interesting questions about these models concerns the transient behavior. For example, how does the multidimensional structure influence the approach to equilibrium? A classic study of the transient behavior of a multidimensional stochastic system is the study of card shuffling in Aldous and Diaconis (1987). In this paper, following Glynn and Whitt (1991), we focus on the transient behavior of a multidimensional non-Markovian model, for which there is no nondegenerate equilibrium. In particular, we consider a series of n single-server queues, each with unlimited waiting space and the first-in first-out (FIFO) service discipline. The service times of all the customers at all the queues are i.i.d. but with a general distribution. At time 0 the system is empty and k customers
-2-
are placed in the first queue. We wish to describe the time D(k,n) required for all k customers to complete service from all n queues. (In the long run, all queues are empty.) In the scheduling literature, the time D(k,n) is often called the makespan. This series network problem is of interest in its own right, but we believe it is also of interest as an illustration of the kind of multidimensional models we want to consider and the kinds of questions we want to ask. Hence, when we consider how to effectively apply simulation to analyze this particular problem, we believe that this has important implications for the way we can effectively exploit simulation more generally. As we detail in Section 3, Glynn and Whitt (1991) proved limit theorems describing the asymptotic behavior of D(k,n) as k → ∞ and/or n → ∞. Appropriate normalizations were found under which limits exist, but unfortunately very little could be said about the limits themselves. One purpose here is to apply simulation to describe the limits. (This paper is a revision of our 1990 paper cited in Glynn and Whitt (1991).) Our first answer to the third question above is that simulation can be effectively exploited when used together with mathematical analysis. Together the two methods of analysis yield more than either alone. The limit theorems assist further analysis by indicating appropriate ways to scale the variables D(k,n) as functions of k and n. This is important for both having an effective algorithm (see Section 5) and interpreting the simulation results (see Section 4). Moreover, since some of the limits involve invariance principles (see Section 3), we see that simulation of the model for one service-time distribution yields useful results for all service-time distributions. Another purpose of this paper is to present a case for distributed-event parallel simulation (described below). We contend that models like our series queueing network are natural candidates for applying parallel simulation. Moreover, as we detail in Section 2, we contend that the distributed-event approach is especially effective for these models. We support this claim by
-3-
our implementation of the distributed-event parallel-prefix-based algorithm of Greenberg et al. (1990,1991) on the 8,192-processor CM-2 Connection machine and the 16,384-processor MasPar computer. (We performed our first experiments on the Connection machine in 1990; we started using the MasPar in 1991.) The achieved simulation rate was about seventeen billion service completions per hour, providing speedup by about a factor of 100 compared to simulation on a conventional single-processor high-speed workstation. Here is how the rest of the paper is organized. In Section 2 we provide background on parallel simulation and in Section 3 we provide background on the limit theorems for the series network. In Section 4 we present our simulation results and in Section 5 we describe our simulation methodology in more detail. We conclude in Section 6 with a theorem that provides additional support for one of the principal conjectures.
7. Background on Parallel Simulation The approaches for using parallel processing to speed up simulations can be divided into two classes – those that use parallelism for speeding up a single run and those that do not. The methods that use parallelism to speed up a single run can be further classified as following either a distributed-subsystem approach or a distributed-event approach. We discuss each of these in turn. In evaluating the different approaches, we have in mind very large numbers of processors, including the thousands that are available today and even more that will be available in the future. In particular, the simulations reported here were performed on the 8,192-processor CM-2 Connection machine built by Thinking Machines (1990) and the 16,384-processor MasPar computer; see Blank (1990). Both are SIMD (single-instruction multiple-data) machines; i.e., each processor executes the same instruction at each cycle but applies the instruction to different data.
-4-
7.1 Methods That Do Not Use Parallelism on a Single Run Parallelism sometimes can be effectively exploited by simply performing separate runs on each processor. The different runs may represent different scenarios or independent replications. With different scenarios, we typically use a common random number stream to facilitate comparisons. With independent replications, we typically use independent random number streams and average the results from all the runs to reduce variance. Independent replications also helps determine the statistical quality of the results. The great appeal of these approaches is their simplicity, but they do have drawbacks. First, it may be difficult to simultaneously execute a separate run on each processor. For example, the memory associated with each processor may not be sufficient for a complex system. Moreover, there may be inefficiencies because some scenarios may require much longer runs than others. Second, the ‘‘batch processing’’ nature of multiple scenarios thwarts rapid use of parallel processing for interactive simulation studies. In practice, one simulation suggests another. Determining which scenarios to simulate, and even how long to run the simulation of each scenario, requires experimentation. Independent replications avoids some of the difficulties associated with multiple scenarios and indeed it seems to have great promise; see Heidelberger (1986a,b) and Glynn and Heidelberger (1990a,b). Many stochastic systems require large experiments in order to obtain reliable estimates; e.g., this is true of even a single queue with high traffic intensity; see Whitt (1989). Moreover, in many cases independent replications are as effective as one long run. However, there typically are difficulties with very large numbers of independent replications of very short runs; see Whitt (1991). Thus, independent replications may have difficulty exploiting the full power of very large numbers of processors. Moreover, we contend that multidimensional complex stochastic systems often exhibit two
-5-
structural properties that make independent replications even less helpful: First Structural Property. To obtain a useful result from a single replication, the run often must be very long. Independent replications, by itself, thus offers no way to reduce the time required for a given replication. Second Structural Property. The variance of the desired result obtained from each independent replication often is not large. The variance may be such that ten replications may be needed to obtain reliable results, but not thousands. These two structural properties do not hold for the single-queue models discussed in Whitt (1989, 1991), but we contend that these properties often appear with more complex multidimensional stochastic models. Indeed, this is dramatically illustrated by the series queueing network model considered here. 7.2 Methods that Do Use Parallelism on a Single Run The Distributed-Subsystem Approach Most simulation methods that have been proposed to use parallelism to speed up a single run take the following distributed-subsystem approach; see Fujimoto (1991) for a survey. The system to be simulated is partitioned into subsystems and a different processor is assigned to each subsystem. Applied to the simulation problem here, a different processor would be assigned to each queue or group of queues. A processor generates the sample path of its subsystem, taking care to coordinate with other processors on events that couple their sample paths. Unfortunately, the degree of parallelism is limited to the number of subsystems, e.g., the number of queues. On parallel computers having thousands of processors, it may be difficult or impossible to fashion an efficient simulation by partitioning into thousands of subsystems. The Distributed-Event Approach If E events with comparable running times are to be simulated on P processors, then the ideal running time would be O(E / P), as if the E events were distributed evenly among the P processors (without significant overhead). The distributed-event approach tries to attain this goal
-6-
by exploiting parallel methods and by exploiting special properties of the system being simulated. Indeed, for the simulation problem here, we do use methods that are completely different from their serial counterparts, which exploit special properties of the recurrences describing job arrivals and departures in a series of queues. This approach is quite new. Thus far, distributed-event methods have appeared for simulations of networks of queues and related systems in Greenberg et al. (1990,1991) and Baccelli and Canales (1991), trace-driven cache simulations in Heidelberger and Stone (1990) and Nicol et al. (1991), and simulations of multiserver queues without waiting rooms in Feder et al. (1992). Indeed, the present study seems to be the first implementation of the distributed-event approach to simulate a stochastic system on a massively parallel computer. As indicated above, we used both the 8,192-processor CM-2 Connection machine and the 16,384-processor MasPar computer. The examples in Greenberg et al. (1990,1991) were preformed on the 16-processor Sequent machine. Reports of subsequent implementations on the MasPar computer appear in Nicol et al. (1991) and Feder et al. (1992). Our problem here is to simulate the passage of the first K jobs through a series of N queues, yielding O(KN) events. Our algorithm in Section 5 takes O(N( (K / P + log P) ) time using P processors. By duality, see Section 2 of Glynn and Whitt (1991), K and N are interchangeable, so that we may take K to be larger than N. For large K, the time becomes O(NK / P), which is optimal. The method is simple and well suited for implementation on today’s massively parallel SIMD computers.
8. Background on the Series Queueing Network Model The model we consider is a series of n single-server queues, each with unlimited waiting space and the FIFO discipline. The service times of all the customers at all the queues are i.i.d. with a general distribution having mean 1 and finite positive variance σ 2 . At time 0 the system is
-7-
empty and k customers are placed in the first queue. We wish to describe the distribution of the time D(k, n) required for all k customers to complete service from all n queues. As noted in Section 2 of Glynn and Whitt (1991), hereafter referred to as GW, this problem also has an abstract formulation. Let V(i, j) be i.i.d. random variables (the service times) for 1 ≤ i ≤ k and 1 ≤ j ≤ n. Let Π(k,n) be the set of all rectilinear nondecreasing paths (of length k + n − 1 ) from (1,1) to (k,n) in the set of ordered pairs (i, j) with 1 ≤ i ≤ k and 1 ≤ j ≤ n. Then D(k,n) is distributed as the maximum over all paths in Π(k,n) of the sum of the k + n − 1 service times on the path. In GW, limit theorems were proved which describe the asymptotic behavior of D(k, n) as k → ∞ and/or n → ∞. In §2 of GW it is noted that there is a duality implying that D(k, n) is distributed the same as D(n, k) for each k and n. Hence, limits as n → ∞ have counterparts as k → ∞. As a consequence, a heavy-traffic limit theorem by Iglehart and Whitt (1970) for the case k → ∞ with fixed n implies that [D(k, n) − n]/ √n ==> σDˆ k ( 1 )
as n → ∞
for each k ,
(3.1)
where ==> denotes convergence in distribution and Dˆ k ( 1 ) is a functional of a standard kdimensional Brownian motion (BM) Bˆ ≡ (Bˆ 1 , . . . , Bˆ k ), which has independent one-dimensional standard (zero drift, unit variance) BMs B i ≡ {B i (t) : t ≥ 0 } as components; i.e., Dˆ 1 (t) = Bˆ 1 (t) and Dˆ k (t) =
sup D k − 1 (s) + B k (t) − B k (s) , t ≥ 0 . 0≤s≤t
(3.2)
We may also choose to focus on the interdeparture times, defined by ∆(k, n) = D(k + 1 , n) − D(k, n) , k ≥ 1 .
(3.3)
-8-
The corresponding limit is ∆(k, n)/ √n ==> σ ∆ˆ k ( 1 ) as n → ∞ ,
(3.4)
where ∆ˆ k = Dˆ k − Dˆ k − 1 with D k ≡ {D k (t) : t ≥ 0 }. The process (∆ˆ 1 , . . . , ∆ˆ k ) is a kdimensional reflected Brownian motion (RBM) as in Harrison (1978), Harrison and Reiman (1981a,b), Reiman (1984) and Harrison and Williams (1987), but note that this RBM does not have a proper limiting distribution as t → ∞. The RBM is to be expected because ∆(k, n) is distributed the same as the sojourn time of customer n at queue k, S(n, k) = D(n, k) − D(n, k − 1 ), by virtue of the duality mentioned above. Given the convergence in (3.1) and (3.4), our main problem is to say something about the limits Dˆ k ( 1 ) and ∆ˆ k ( 1 ). It is significant that these limits are invariance principles; i.e., they do not depend on the underlying service-time distribution beyond its first two moments. Of course, the convergence in (3.1) and (3.4) depends on the first two moments of the service-time distribution, but only through elementary scaling. Hence, knowledge about Dˆ k ( 1 ) and ∆ˆ k ( 1 ) has quite wide applicability. We are interested in approximations for D(k, n) and ∆(k, n) not only when n is large but also when k is large. This suggests considering the asymptotic behavior of Dˆ k ( 1 ) and ∆ˆ k ( 1 ) as k → ∞. Theorem 7.1 of GW implies that k ==> α as k → ∞ , Dˆ k ( 1 )/ √
(3.5)
where α is deterministic, but the theorem does not determine the numerical value of α in (3.5). One of our primary goals is to estimate α. Hence, it is important to note that, for this purpose, our model possesses the two structural properties in §2.1. We need a long run to estimate k for large k. (We need k and n both large to have (3.1) and (3.5). Moreover, as we EDˆ k ( 1 )/ √ discuss below, we actually need n large compared to k.) At the same time, by (3.5), the variance
-9-
Var [Dˆ k ( 1 )/ √ k ] is going to zero. Indeed, remarkably, based on our simulations we conjecture that Var [Dˆ k ( 1 ) ] is decreasing without normalization, so that the variance of Dˆ k ( 1 )/ √ k is small indeed. In GW attention was not only focused on the iterated limit as first n → ∞ in (3.1) and then k → ∞ in (3.5), but also on the joint limit with k ≡ k n → ∞ as n → ∞. Indeed, in some sense it is shown that 2 [D(k n , n) − n]/ √ σ nk n ==> α as n → ∞
(3.6)
with k n → ∞ satisfying k n ≤ n 1 − ε for fixed ε with 0 < ε < 1. However, a very different story applies for k n = n. Theorem 6.3 of GW shows that for service-time distributions having an exponential tail that D( xn , n)/ n → γ(x) as n → ∞ ,
(3.7)
where x is the integer part of x. In the case of exponential service-time distributions, it follows from Srinivasan (1992) that γ(x) = ( 1 + √ x ) 2 , so that γ( 1 ) = 4. In GW it is conjectured that γ( 1 ) in (3.7) depends on the service-time distribution beyond its first two moments. For estimating the limit γ(x) in (3.7), it is also evident that we have the two structural properties in §2.1.
9. Simulation Results 9.1 The Simulation Cases To obtain information about Dˆ k ( 1 ), ∆ˆ k ( 1 ), α and γ( 1 ), as well as D(k, n) and ∆(k, n), we simulated the series of queues for two service-time distributions having mean and variance one: exponential and Bernoulli. The Bernoulli random variables assume the values 0 and 2 each with probability 1/2. (By the invariance property, the limits except for γ( 1 ) are the same for these two
- 10 -
distributions.) To obtain relatively reliable estimates, we performed multiple independent replications for n up to 10 6 and k up to 5000. Table 1 displays estimates of the first, second and fourth moments of ∆(k, n)/ √n for an exponential service time with mean 1 in the cases k = 1 , 2 , . . . , 10 and n = 10 j for j = 1 , 2 , . . . , 6. Table 2 contains the associated estimates of the squared coefficient of variation (SCV, variance divided by the square of the mean) of ∆(k, n)/ √n based on Table 1. These estimates are based on 1000 independent replications. In each replication, D(k, 10 j ) is obtained for each k and j, so that the results for different k and j are dependent. The dependence is greater as we change k for fixed j than when we change j for fixed k. Tables 3 and 4 display the estimated mean, second moment and standard deviation of [D(k, n) − n]/ √ kn for the same exponential cases, based on the same 1000 replications. (Simulation results for other cases are also displayed in Table 3.) The normalization is motivated by the limits (3.1), (3.5), (3.6) and (3.7). (Note that the normalization in (3.6) and (3.7) are consistent since k = n in (3.7).) The advantage of this perspective is dramatically demonstrated by Table 3. For k ≤ 5000 and n ≤ 10 6 , all observed normalized averages fall in the interval [0.76, 3.00]. This shows that much of the behavior of D(k,n) is captured by the scaling. This also helps us to focus on the remaining effects. To obtain estimates of ∆(k, n), D(k, n), ∆ˆ k ( 1 ) and Dˆ k ( 1 ) for larger k, we performed 100 replications for k = 100 and n = 10 6 and 20 independent replications for k = 5000 and n = 10 6 . These values appear in Tables 3, 5, 6 and 7. 9.2 Properties of Dˆ k ( 1 ) We first discuss the limiting Brownian motion functional Dˆ k ( 1 ) in (3.2). This is the limit as n → ∞ in (3.1). By (3.2), Dˆ k ( 1 ) is increasing in k. We now describe additional properties deduced from the simulations.
- 11 -
We infer properties about Dˆ k ( 1 ) by simulating [D(k,n) − n]/ √n for large n, which is justified by (3.1). (Here σ = 1.) Hence, we regard the last n = 10 6 column of Tables 3 and 6 as estimates of Dˆ k ( 1 )/ √ k . By (3.5), Dˆ k ( 1 )/ √ k approaches α as k → ∞. However, for larger values of k, we begin to see the effect of the different limit in (3.7). Thus in Tables 3 and 6 the values evidently go above α for each n when k gets sufficiently large. Conjectures 4.1. We make the following conjectures about the limit variables Dˆ k ( 1 ) in (3.1), (3.2) and (3.5): (i)
E[Dˆ k ( 1 ) ]/ √ k is increasing in k;
(ii)
The limit in (3.5) is α = 2;
(iii)
Var [D k ( 1 ) ] is decreasing in k;
(iv)
Var [D k ( 1 ) ] → β as k → ∞, where 0 < √β < 0. 25;
(v)
E[Dˆ k ( 1 ) ] − α √ k → 0 as k → ∞;
(vi)
Dˆ k ( 1 ) − α √ k ==> L 1 as k → ∞, where E[L 21 ] < ∞;
(vii)
[Dˆ k ( 1 ) − α √ k ]/ √ Var [Dˆ k ( 1 ) ] ==> N( 0 , 1 ) as k → ∞, where N( 0 , 1 ) is a standard normal random variable.
Discussion. (i) The monotonicity of E[Dˆ k ( 1 ) ]/ √ k is strongly supported by the final columns in Tables 3 and 6. Indeed, it appears that E[D(k,n) − n]/ √ kn is increasing in k for each n, at least for these two distributions. (ii) It is of course hard to pin down specific numbers precisely, but it appears that α = 2. 0. The numerical evidence appears stronger in the Bernoulli case in Table 6 than in the exponential case in Table 3, but both give quite strong support. Our uncertainty is primarily due to the effect of the diagonal limit in (3.7) rather than the variability of the estimator. The half-width of 95% confidence intervals for E[D(k,n) − n]/ √ kn for k = 5000 and n = 10 6 was 0.0014 for both the
- 12 -
exponential and Bernoulli distributions with 20 replications, as can be seen from Table 5. (A 95% confidence interval using the Student-t distribution is obtained by dividing the standard deviation in Table 5 by √ 20k and multiplying by 2.09.) In addition to the numerical evidence, we offer the following heuristic argument (developed after
seeing
the
numerical
results).
For
the
exponential
case,
we
know
that
n − 1 D( xn , n) → ( 1 + √ x ) 2 w.p.1 as n → ∞ for each fixed x by Theorem 6.1 of GW. We act as if this is true for x of the form y / n. Then n − 1 [D( xn , n) − n] ∼ / n ) 2 − 1 = 2 √y /n + y/n ∼ ( 1 + √y
for large n
or n − ⁄ [D( y , n) − n] ∼ y + y / √n ∼ 2 √ 1
2
for large n .
(4.1)
Finally, we act as if the first term on the right of (4.1) is valid for all service-time distributions. Stronger evidence (although not a proof) is provided by a new limit theorem in Section 6. (iii) – (iv) Remarkably, Var [Dˆ k ( 1 ) ] seems to be decreasing in k, without normalization, as can be seen from Table 5. While this monotonicity is quite evident, it is not clear whether the limit β is zero (as claimed in Remark 7.1 of GW). Since the observed values decrease so slowly, we now conjecture that β > 0, but the evidence is not strong. If actually β = 0, then it appears that the rate of decrease of Var [D k ( 1 ) ] is quite slow. For example, we might have 4 as k → ∞ . Var[Dˆ k ( 1 ) ] ∼ ________ ( log k) 2
(4.2)
(v) – (vi) From Tables 3 and 5 it appears that 1 k (1)] _E[D ________ − α = o ____ as k → ∞ , k √k √
(4.3)
- 13 -
which is equivalent to (v). A rough approximation based on our data is log k E[Dˆ k ( 1 ) ] ∼ k − 1. 6 _____ . ∼ 2 √ √k
(4.4)
Conjectures (iii)–(v) naturally suggest (vi). (vii) Looking at the data for 100 ≤ k ≤ 5000 and n = 10 6 (e.g., via Q-Q plot, see an unpublished appendix) supports the conclusion that Dˆ k ( 1 ) is approximately normally distributed for large k. Since Dˆ k ( 1 ) is the k-fold partial sum of ∆ˆ j ( 1 ), 1 ≤ j ≤ k, this is to be anticipated. However, the property is not immediate because the random variables ∆ˆ j ( 1 ) are neither independent nor identically distributed. 9.3 Properties of ∆ˆ k ( 1 ) We now turn to the variables ∆ˆ k ( 1 ) ≡ Dˆ k + 1 ( 1 ) − Dˆ k ( 1 ). By §5 of GW, ∆ k ( 1 ) is d
stochastically decreasing in k. By Remark 3.3 of GW, ∆ˆ 1 = Bˆ 2 − Bˆ 1 = √2 Bˆ 1 . Hence, ∆ˆ 1 ( 1 ) has a positive normal distribution with E[∆ˆ 1 ( 1 ) ] = 2/ √π = 1. 128, E[∆ˆ ( 1 ) 2 ] = 2 and E[∆ˆ ( 1 ) 4 ] = 12. Conjectures 4.2. We make the following conjectures about the limit variables ∆ˆ k ( 1 ) in (3.4): (i)
√k E[∆ˆ k ( 1 ) ] → α/2 = 1 as k → ∞;
(ii)
k E[∆ k ( 1 ) ] − 1 ≤ 0. 1 for all k ≥ 2; √
(iii)
√k E[∆ˆ k ( 1 ) ] ≥ 1. 0 for all k;
(iv)
SCV(∆ˆ k ( 1 ) ) is increasing in k;
(v)
SCV(∆ˆ k ( 1 ) ) → 1 as k → ∞;
(vi)
√k ∆ˆ k ( 1 ) ==> L 2 as k → ∞; where L 2 has an exponential distribution with mean 1.
- 14 -
Discussion. (i)–(v) The mean and SCV formulas are consistent with Tables 1 and 2. (In Table 1 the values should be multiplied by √ k to see the effect.) We also estimated the m th moment of ∆ˆ k ( 1 ) for m = 1 , 2 , 3 and 4 by estimating the m th moment of ∆(k, n)/ √n for n = 10 6 using the following estimator _1_ n
n
Σ
j=1
∆(k, j) _______ √j
m
.
(4.5)
The smoothing in (4.5) significantly decreases the variance, but it also introduces a bias, which is itself hard to estimate. We used (4.5) in 10 replications with n = 10 6 and k = 10 3 . The resulting 95% confidence intervals (based on a t-distribution with 9 degrees of freedom) were
√k E[∆ˆ k ( 1 ) ] = 1. 070 ± 0. 005 k E[∆ˆ k ( 1 ) 2 ] = 2. 237 ± 0. 023
(4.6)
k 2 E[∆ˆ k ( 1 ) 4 ] = 25. 8 ± 0. 76 .
If the bias in (4.5) is not significant, then (4.6) implies that α ∼ ∼ 2. 14 instead of 2.0. However, we believe that the discrepancy is due to the bias in (4.5). Conjecture 4.2(i) is also related to Conjecture 4.1(v), because for any sequence of real numbers {a k : k ≥ 1 } if √ k a k → a as k → ∞, then
k
Σ
j=1
a j / √ k → 2a; e.g., see Lemma 4 of
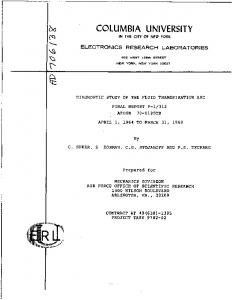
Glynn and Whitt (1992). In other words, Conjecture 4.2(i) implies Conjecture 4.1(i). (vi) Note that (4.6) is consistent with an exponential distribution with mean 1, because its first four moments are 1, 2, 6 and 24. Moreover, the 100-point data set for k = 100 and n = 10 6 looks like it is from an exponential distribution, as can be seen from the Q − Q plot in Figure 1.
- 15 -
We remark that for estimating α, i.e., the limiting behavior of Dˆ k ( 1 )/ √ k , both structural properties in Section 2.1 hold, but for estimating the limiting behavior of [Dˆ k ( 1 ) − α √ k ] and
√k ∆ˆ k ( 1 ) as k → ∞, the second structural property does not hold. To pin down these refined limits, we would want many replications as well as having k large with n large compared to k. If the random variables ∆ˆ k ( 1 ) were uncorrelated, then Conjecture 4.2(v) implies that we
ˆ k (1)] ∼ would have Var [D ∼ log k. However, Conjecture 4.1 (iii) implies that Var [Dˆ k ( 1 ) ] does not grow with k. This indicates that there is considerable negative correlation among the variables ∆ˆ k ( 1 ). 9.4 The Hydrodynamic Limit We now turn to the hydrodynamic limit in (3.7). Recall that, unlike (3.1), this limit is not an invariance principle, so that γ(x) depends on the service-time distribution in a yet-to-bedetermined way. Some of the conjectures are motivated by stochastic comparisons that can be made for D(k,n); we discuss these first. As noted in Remark 2.1 of GW, the function mapping the service times into the departure times D(k,n) is increasing and convex. This allows us to deduce how D(k,n) depends on the service time distribution. We say that one real-valued random variable Y 1 is less than or equal to another Y 2 in the convex (increasing convex) stochastic order, and write Y 1 ≤ c Y 2 (Y 1 ≤ ic Y 2 ), if Ef (Y 1 ) ≤ Ef (Y 2 ) for all convex (increasing convex) real-valued functions f for which the expectations are well defined; e.g., see Stoyan (1983). Proposition 4.1. If V 1 ≤ c V 2 , where V 1 and V 2 are two candidate service-time distributions, then D 1 (k,n) ≤ ic D 2 (k,n) for all k and n, so that E[D 1 (k,n) m ] ≤ E[D 2 (k,n) m ] for all k,n and M. Proof. Note that any increasing convex function of D(k,n) is an increasing convex function of the service times because the composition of increasing convex functions is increasing and
- 16 -
convex. Conjectures 4.3. We make the following conjectures concerning the hydrodynamic limit (3.8): (i) The limit γ(x) depends on the service-time distribution; (ii) If V 1 and V 2 are two candidate service distributions with V 1 ≤ c V 2 , then γ 1 (x) ≤ γ 2 (x) for all x; (iii) For the Bernoulli case, the limit in (3.7) satisfies 3. 60 ≤ γ( 1 ) ≤ 3. 70, so that the proportion of 2’s on the maximum path in Π(n,n) is asymptotically 0. 90 < γ( 1 )/4 < 0. 925. (iv) The rate that var[D(n,n) ] grows with n depends on the distribution; (v) For the Bernoulli case, n − 1/2 Var [D(n,n) ] → ξ > 0 as n → ∞; (vi) For any service-time distribution with finite first two moments, γ(x) = 1 + 2 √ x + o(x) as x → 0 .
(4.7)
Discussion. (i) Ten independent replications of n − 1 D(n, n) for n = 1000 were simulated for the exponential and Bernoulli distributions. The ten exponential values fell in the interval [3.902, 3.999], while the ten Bernoulli values fell in the interval [3.604, 3.630]; see Table 7. For n = 1000, we can statistically conclude that the two distributions of n − 1 D(n, n) have different means. Moreover, the exponential variables had mean 3.951 which is within 0.049 of the known limit as n → ∞. (ii) This conjecture would follow from Proposition 4.1 if ED( xn ,n)/ n → γ(x), which in turn is true if {D( xn ,n)/ n:n≥1 } is uniformly integrable. However, these properties remain to be established. (iii) The observations in (i) above, support the numerical estimate. In the Bernoulli case we have the w.p.1 bound D(n, n) ≤ 4n − 2. This upper bound corresponds to a path from (1,1) to
- 17 -
(n, n) in the n × n array of service times discussed in §3 containing all 2’s. Hence, the maximum path contains about 91% 2’s asymptotically as n → ∞. (iv) – (v) >From (3.7) we know that n − 2 Var D(n, n) → 0 as n → ∞. Assuming that n − β Var D(n, n) converges to a proper limit as n → ∞, from Table 7 it appears that the exponent β, as well as the limit, depends on the distribution. For the Bernoulli case, we estimate β = 1/2; for the exponential case, we estimate that 3/4 ≤ β ≤ 1. (vi) Even though the limit γ(x) in (3.7) evidently depends on the service-time distribution, the heuristic argument supporting (4.2) leads us to conjecture (4.7). 9.5 The Approximations The simulations also reveal how well D(k, n) and ∆(k, n) are approximated by the limits in (3.1) and (3.4)–(3.7), at least in the cases considered of exponential and Bernoulli random variables. Conjectures 4.4. We make the following conjectures about the way D(k,n) and ∆(k,n) are approximated by the limits in (3.1) and (3.4)–(3.7) for the two distributions under consideration: (i) E[∆(k,n) m ]/ √n is decreasing in n for all k and m; (ii) E[ (D(k,n) − n) m ]/ √n is decreasing in n for all k and m; (iii) For a given n, E[∆ˆ k ( 1 ) m ] and E[Dˆ k ( 1 ) m ] improve as approximations for E[ (∆(k,n)/ √n ) m ] and E[ (D(k,n) − n]/ √n ) m ], respectively, as k decreases; (iv) E[D(n,n)/ n] is increasing in n; (v) γ( 1 ) − E[D(n,n)/ n] is O( √n ). Discussion. (i)–(v) The monotonicity is strongly supported by the tables. >From Table 7, the rate of convergence of ED(n, n)/ n to γ( 1 ) appears to be about O( 1/ √n ). A rough approximation in the exponential case is
- 18 -
ED(n, n) ∼ ∼ 4n − 2 √n .
(4.8)
For fixed k, Tables 3 and 6 suggest that the rate of convergence of [ED(k, n) − n]/ √n to EDˆ k ( 1 ) also seems to be about O( 1/ √n ), but the limit is clearly a better approximation for smaller n when k is smaller. The rate of convergence also seems to be faster for the Bernoulli service-time distribution. We conclude by briefly discussing approximations for D(k,n) when k 0 and to (n,k − 1 ) by an edge of weight − V(n,k) if k > 0. Then − D(n,k) is the sum of − V( 1 , 1 ) and the weight of the least weight path from (n,k) to ( 1 , 1 ). The problem of parallel computation of the shortest paths in such graphs has received extensive study in the Computer Science literature in the context of string editing and related problems; cf. Wagner and Fischer (1973). Adapted to our problem, the asymptotically most efficient solution is a clever divide-and-conquer algorithm of Apostolico et al. (1990). This algorithm produces the D(k,n)’s in time O( logNlogK) using O(KN /logN)
- 26 -
processors, assuming a model of parallel computation that allows different processors to concurrently read common locations in memory in unit time. It may be possible to adapt their algorithm to obtain one with running time O(NK / P + logP) using P processors. However, the algorithm is complicated, and the implicit constant in the running time bound is likely to be large. For large K, which is natural for our application, the simpler parallel-prefix based algorithm given above has running time O(NK / P), and has the advantage of simplicity and favorable implicit constants.
11. A New Supporting Limit Theorem In this section we establish a new limit theorem (developed after the rest of the work was done) that provides strong support for Conjecture 4.1 (ii), i.e., that the limit α in (3.5) and (3.6) is two. Indeed, we establish a modification of limit (3.6) where the service-time distributions change with n. In this new theorem we can conclude that the numerical value of the limit is indeed two, but since the service-time distributions change with n, we cannot yet conclude that α = 2 in (3.5) and (3.6). (By the invariance principle associated with (3.6), we can restrict attention to any single convenient service-time distribution, but (3.6) has not yet been established for service-time distributions depending on n.) In particular, we now consider a family of queueing network models indexed by n. As in (3.6), model n has n queues with k n customers initially in queue 1, where k n → ∞ as n → ∞. As before the service times of all the customers at all the queues are i.i.d. with finite variance. However, now the service-time distribution is allowed to depend on n. In model n, the nk n service times of the k n customers at the n queues are i.i.d. with the distribution of V n , where V n has the two-point distribution P(V n = 1 +
√nkn )
σ = 1 − P(V n = 1 ) = ____ , nk n
(6.1)
- 27 -
where σ is a positive constant with σ < nk n for all n ≥ n 0 for some n 0 . >From (6.1), since nk n → ∞ as n → ∞, it is easy to see that V n ==> 1, E[V n ] → 1 and Var [V n ] → σ 2 , but E[V 2n + δ ] → ∞ for all δ > 0 as n → ∞. Moreover, it is evident that, for all n, V n = 1 + X n where X n has the two-point distribution P(X n =
√nkn )
σ = 1 − P(X n = 0 ) = ____ . nk n
(6.2)
Let D n (i, j) and D ′n (i, j) be the departure time of customer i from queue j in model n with service times V n and X n , respectively. >From above, it is clear that D n (k n ,n) − (n + k − 1 ) = D n′ (k n ,n) ,
(6.3)
where D ′n (k n ,n) should be relatively easy to analyze as there are relatively few positive entries. For this purpose, we apply previous results on the length of the longest increasing subsequence in a random permutation; see Frieze (1991) and references cited there. Let {U n : n ≥ 1 } be a sequence of i.i.d. random variables uniformly distributed on [ 0 , 1 ]. Let M n be the length of the longest increasing subsequence among the first n variables U 1 , . . . , U n . (Note that L n has the distribution of the length of the longest increasing subsequence in a random partition of the vector of integers ( 1 , . . . , n).) It is known that L n / √n → 2 w. p. 1 as n → ∞ .
(6.4)
Let Π(λ) be a Poisson random variable with mean λ that is independent of {L n : n ≥ 1 } and let L(λ) = L Π(λ) ;
(6.5)
i.e., L(λ) is the length of the longest increasing subsequence among the Poisson random number
- 28 -
of uniform random variables. By the strong law of large numbers, Π(λ)/λ → 1 w. p. 1 as λ → ∞ .
(6.6)
L(λ)/ √λ → 2 w. p. 1 as λ → ∞ .
(6.7)
Then (6.4)–(6.6) imply that
Theorem 6.1. Let the service times be as in (6.1). (a) If k n → ∞ as n → ∞, then [D(k n ,n) − (n + k n − 1 ) ]/ √ nk n ==> L(σ 2 ) as n → ∞ .
(6.8)
(b) If k n / n → 0 as n → ∞, then 2 [D(k n ,n) − n]/ √ σ nk n ==> 2
(6.9)
as first n → ∞ and then σ 2 → ∞. (c) As first n → ∞ and then σ 2 → ∞, D(n,n)/σn ==> 2 .
(6.10)
Proof. First, (6.9)–(6.10) follow directly from (6.7) and (6.8), so we focus on (6.8). By (6.3), it nk suffices to prove that D n′ (k n ,n)/ √ n ==> L(σ 2 ) as n → ∞. Let X n (i, j) be the service time of customer i at queue j in model n, distributed as in (6.2). For each n, put service time X n (i, j) at the point (i / k n , j / n) in the unit square [ 0 , 1 ] 2 for 1 ≤ i ≤ k n and 1 ≤ j ≤ n. Let N n be a counting process on [ 0 , 1 ] 2 , with N n (A) counting the number of points (i / k n , j / n) in the measurable subset A such that X n (i, j) > 0. It is easy to see that N n ==> M σ 2 as n → ∞ ,
(6.10)
where M λ is a Poisson random measure with intensity measure v(A) = λ µ(A), with µ being
- 29 -
Lebesgue measure on [ 0 , 1 ] 2 ; e.g., see Whitt (1972) or Daley and Vere-Jones (1988). Next, for a finite point process on [ 0 , 1 ] 2 , the maximum number of points on a nondecreasing path from ( 0 , 0 ) to ( 1 , 1 ) is a measurable function which is continuous almost surely with respect to the limiting Poisson random measure. (We can use the usual topology of weak convergence for both the underlying space of finite measures on [ 0 , 1 ] 2 and the space of probability measures on this space; see Appendix 2 of Daley and Vere-Jones (1988).) Hence, by the continuous mapping theorem, D ′ (k n ,n)/ √ nk n ==> L(σ 2 ) as n → ∞ ,
(6.12)
which completes the proof. Remarks. Part (b) suggests, but does not imply, that α = 2 in (3.6). Part (c) suggests that γ( 1 ) in (3.7) can assume any value greater than or equal to the obvious lower bound 2 for service-time distributions with mean 1. Finally, our Conjecture 4.1 (iii) suggests that the distribution of the longest increasing subsequence in a random permutation may concentrate much more closely about its mean than indicated by the bound in Frieze (1991). Acknowledgment. We thank Andrew Odlyzko and Larry Shepp for pointing out the paper by Frieze (1991).
References
Akl, S. G. (1989). The Design and Analysis of Parallel Algorithms, Prentice Hall, Englewood Cliffs, NJ. Aldous, D. and Diaconis, P. (1987). Shuffling cards and stopping times. Amer. Math. Monthly 93, 333-348. Apostolico, A., Atallah, M. J., Larmore, L. L. and McFaddin, H. S. (1988). Efficient parallel algorithms for string editing and related problems. University of California, Irvine. The Society for Computer Simulation, 53-57. Baccelli, F. and Canales, M. (1991) Parallel simulation of stochastic petri nets using recursive equations. INRIA Rapport de Recherche 1520. Blank, T. (1990). The MasPar MP-1 Architecture. Compcon, Spring 1990, IEEE Computer Society Press, San Francisco, CA, 20-24. Daley, D. J. and Vere-Jones, D. (1988). An Introduction to the Theory of Point Processes, Springer-Verlag, New York. Feder, T., Greenberg, A.G., Ramachandran, V., Rausch, M., and Wang, L-C. (1992). The telephone connect problem, to appear. Frieze, A. (1991). On the length of the longest monotone subsequence in a random permutation. Ann. Appl. Prob. 1, 301-305. Fujimoto, R. M. (1991). Parallel discrete event simulation. Commun. ACM 33, 31-53. Glynn, P. W. and Heidelberger, P. (1990a). Analysis of parallel, replicated simulations under a completion time constraint. IBM Research Report RC 15466 (#68774). Glynn, P. W. and Heidelberger, P. (1990b). Experiments with initial transient deletion for parallel, replicated steady-state simulations. IBM Research Report RC 15700 (#70118). Glynn, P. W. and Whitt, W. (1991). Departures from many queues in series. Ann. Appl. Prob. 1, 546-572. Glynn, P. W. and Whitt, W. (1992). The asymptotic efficiency of simulation estimators. Oper. Res., to appear. Greenberg, A. G., Lubachevsky, B. D. and Mitrani, I. (1990). Unboundedly parallel simulations via recurrence relations. 1990 ACM Sigmetrics Conference on Measurement and Modeling of Computer Systems, 1-12. Greenberg, A. G., Lubachevsky, B. D. and Mitrani, I. (1991). Algorithms for unboundedly parallel simulations. ACM Trans. Computer Systems, 9, 3, 201-221.
- R-2 -
Harrison, J. M. (1978). The diffusion approximation for tandem queues in heavy traffic. Adv. Appl. Prob. 10, 886-905. Harrison, J. M. and Reiman, M. I. (1981a). Reflected Brownian motion on an orthant. Ann. Prob. 9, 302-308. Harrison, J. M. and Reiman, M. I. (1981b). On the distribution of multidimensional reflected Brownian motion. SIAM J. Appl. Math 41, 345-361. Harrison, J. M. and Williams, R. J., (1987). Brownian models of open queueing networks with homogeneous customer populations. Stochastics 22, 77-115. Heidelberger, P. (1986a). Discrete event simulations and parallel processing: statistical properties. SIAM J. Sci. Statist. Comput. 9, 1114-1132. Heidelberger, P. (1986b). Statistical analysis of parallel simulations. 1986 Winter Simulation Conf. Proc., J. Wilson and J. Henriksen (eds.), IEEE Press, 290-295. Heidelberger, P. and Stone, H. (1990). Parallel trace-driven cache simulation by time partitioning. Proceedings 1990 Winter Simulation Conference, IEEE, New Orleans, 734-737. Iglehart, D. L. and Whitt, W. (1970). Multiple channel queues in heavy traffic. II: sequences, networks and batches. Adv. Appl. Prob. 2, 355-369. Kelly, F. P. (1991). Loss networks. Ann. Appl. Prob. 1, 319-378. Kruskal, C. P., Rudolph, L. and Snir, M. (1985). The power of parallel prefix. IEEE Trans. Computers C-34, 10, 965-968. Ladner, R. E. and Fischer, M. J. (1980). Parallel prefix computation. J. ACM 27, 831-838. Leighton, F. T. (1992). Introduction to Parallel Algorithms and Architectures: Arrays, Trees, Hypercubes, Morgan Kaufman, San Mateo, CA. Mitra, D., Gibbens, R. J. and Huang, B. D. (1991a). State dependent routing on symmetric loss networks with trunk reservations, I. IEEE Trans. Commun., to appear. Mitra, D., Gibbens, R. J. and Huang, B. D. (1991b). State dependent routing on symmetric loss networks with trunk reservations, II: asymptotics, optimal design. Annals. Oper. Res., to appear. Nicol, D., Greenberg, A. G. and Lubachevsky, B. D. (1991). Massively parallel algorithms for trace-driven cache simulations, to appear. Reiman, M. I. (1984). Open queueing networks in heavy traffic. Math. Oper. Res. 9, 441-458. Proc. IEEE 77, 99-113. Srinivasan, R. (1992). Queues in series via interacting particle systems. Math. Oper. Res., to appear. Stoyan, D. (1983). Comparison Methods for Queues and Other Stochastic Models. Wiley,
- R-3 -
Chichester. Suresh, S. and Whitt, W. (1990). The heavy-traffic bottleneck phenomenon in open queueing networks. Oper. Res. Letters 9, 335-362. Thinking Machines. (1990). Connection Machine Model CM-2 Technical Summary. Thinking Machines Corp., Cambridge, MA. Wagner, R.A. and Fischer, M.J. (1973). The string to string editing problem. Journal of the ACM. 21, 1, 168-173. Whitt, W. (1972). On the quality of Poisson approximations. Z. Wahrscheinlichkeitstheorie und verw. Gebiete 28, 23-36. Whitt, W. (1989). Planning queueing simulations. Management Sci. 35, 1341-1366. Whitt, W. (1991). The efficiency of one long run versus independent replications in steady-state simulation. Management Sci. 37, 645-666.
m = 1
k
n = 10 1
n = 10 2
n = 10 3
n = 10 4
n = 10 5
n = 10 6
1
1.113
1.144
1.137
1.123
1.131
1.190
2
0.922
0.850
0.816
0.801
0.783
0.745
3
0.741
0.697
0.650
0.645
0.614
0.612
4
0.717
0.597
0.545
0.545
0.543
0.497
5
0.689
0.499
0.492
0.458
0.473
0.524
6
0.624
0.493
0.481
0.464
0.435
0.418
7
0.613
0.450
0.420
0.391
0.396
0.386
8
0.621
0.487
0.410
0.383
0.369
0.377
9
0.589
0.427
0.379
0.369
0.342
0.357
10
0.562
0.393
0.345
0.341
0.339
0.309
_________________________________________________________________ k
n = 10 1
n = 10 2
n = 10 3
n = 10 4
n = 10 5
n = 10 6
1
2.05
2.06
1.95
2.03
1.99
2.14
2
1.44
1.22
1.12
1.04
1.00
0.93
3
1.000
0.816
0.721
0.697
0.634
0.647
m = 2
4
0.890
0.636
0.529
0.505
0.496
0.433
5
0.873
0.456
0.422
0.388
0.400
0.488
6
0.693
0.453
0.417
0.408
0.339
0.315
7
0.711
0.391
0.325
0.272
0.282
0.283
8
0.706
0.443
0.313
0.271
0.231
0.255
9
0.636
0.343
0.264
0.241
0.226
0.236
10
0.596
0.283
0.222
0.209
0.206
0.185
_________________________________________________________________
m = 4
k
n = 10 1
n = 10 2
n = 10 3
n = 10 4
n = 10 5
n = 10 6
1
14.9
13.0
10.4
12.7
11.0
13.2
2
7.7
4.9
4.1
3.6
3.2
2.8
3
4.4
2.4
2.0
1.7
1.4
1.6
4
3.23
1.72
1.18
0.95
0.87
0.80
5
3.07
0.83
0.65
0.66
0.62
1.01
6
2.45
0.97
0.76
0.83
0.49
0.41
7
2.29
0.83
0.50
0.29
0.34
0.44
8
2.11
0.88
0.47
0.36
0.21
0.28
9
1.73
0.56
0.29
0.23
0.29
0.30
10
1.81
0.35
0.26
0.18
0.18
0.19
Table 1. Estimates of E[ (∆(k, n)/ √n ) m ] in the case of exponential service times with mean 1 for m = 1 , 2 , 4, k = 1 , . . . , 10 and n = 10 j for j = 1 , . . . , 6. These estimates are based on 1000 independent replications. For the case m = 1 (m = 2 ), the width of 95% confidence intervals are about 6% (10-15%) of the given values, approximately uniformly over all cases.
k n = 10 1 n = 10 2 n = 10 3 n = 10 4 n = 10 5 n = 10 6 average 1 0.65 0.57 0.52 0.61 0.56 0.51 0.57 2 0.69 0.69 0.68 0.62 0.63 0.68 0.67 3 0.82 0.68 0.71 0.68 0.68 0.72 0.72 4 0.73 0.78 0.78 0.70 0.68 0.75 0.74 5 0.84 0.83 0.74 0.85 0.79 0.78 0.81 6 0.78 0.86 0.80 0.90 0.52 0.80 0.78 7 0.89 0.93 0.84 0.78 0.80 0.90 0.86 8 0.83 0.87 0.86 0.85 0.70 0.79 0.82 9 0.83 0.88 0.84 0.77 0.93 0.85 0.85 10 0.88 0.83 0.87 0.80 0.79 0.94 0.85 ___________________________________________________________________ avg.
0.79
0.79
0.76
0.76
0.71
0.77
0.77
Table 2. Estimates of SCV(∆(k, n)/ √n ) ≡ Var (∆(k, n)/(E[∆(k, n) ] ) 2 using the estimates from Table 1. (The exact limiting value as n → ∞ for k = 1 is 0.571.)
k 2 3 4 5 6 7 8 9 10 11 20 50 100 200 500 1000 2000 4000 5000 10 6
n = 10 1 0.76 1.15 1.37 1.55 1.69 1.80 1.90 1.98 2.07 2.15
n = 10 2 0.78 1.13 1.32 1.46 1.53 1.60 1.66 1.70 1.77 1.81 2.04 2.43 2.81
n = 10 3 0.76 1.09 1.27 1.38 1.46 1.54 1.58 1.63 1.66 1.68 1.74 2.01 2.20 2.37 2.65 2.95
n = 10 4 0.76 1.08 1.26 1.38 1.44 1.51 1.55 1.59 1.61 1.64 1.81 1.93 2.02 2.06 2.19 2.30 2.43 2.62 2.70
n = 10 5 0.80 1.10 1.26 1.38 1.44 1.50 1.54 1.58 1.59 1.62 1.74 1.87 1.98 1.99 2.04 2.07 2.14 2.20 2.22
n = 10 6 0.84 1.12 1.27 1.36 1.46 1.51 1.54 1.58 1.60 1.62 1.80 1.82 1.95 1.97 2.009 2.023 2.043 2.067 2.075 3.00*
Table 3. Estimates of E[D(k, n) − n]/ √ kn in the case of exponential service times with mean 1. For k ≤ 11, the estimates are based on 1000 independent replications. For k ≤ 11, the 95% confidence intervals are about ±0. 04, as can be seen from Table 4. The other estimates are based on 20 independent replications. For k ≥ 1000, the 95% confidence intervals are less than ±0. 01. (The exact limiting value as n → ∞ for k = 2 is 0.798. The asterisked value for k = 10 6 is the exact limiting value as n → ∞ for k = n.)
k n = 10 1 n = 10 2 n = 10 3 n = 10 4 n = 10 5 n = 10 6 2 1.15 1.05 0.96 0.96 1.00 1.03 3 1.74 1.55 1.41 1.40 1.42 1.45 4 2.20 1.95 1.77 1.74 1.75 1.76 5 2.66 2.26 2.02 2.00 2.00 1.99 second 6 3.08 2.47 2.22 2.17 2.18 2.22 moment 7 3.44 2.69 2.43 2.34 2.33 2.34 8 3.79 2.85 2.56 2.46 2.44 2.45 9 4.17 3.07 2.70 2.58 2.54 2.56 10 4.50 3.22 2.82 2.68 2.62 2.66 11 4.81 3.34 2.90 2.76 2.70 2.71 __________________________________________________________________
standard deviation
k 2 3 4 5 6 7 8 9 10 11
n = 10 1 0.76 0.65 0.57 0.50 0.47 0.45 0.42 0.50 0.46 0.43
n = 10 2 0.66 0.52 0.46 0.36 0.36 0.36 0.31 0.42 0.30 0.25
n = 10 3 0.62 0.47 0.40 0.34 0.30 0.24 0.25 0.21 0.25 0.28
n = 10 4 0.62 0.48 0.39 0.31 0.31 0.24 0.24 0.23 0.30 0.27
n = 10 5 0.60 0.46 0.40 0.31 0.33 0.28 0.26 0.21 0.30 0.27
n = 10 6 0.57 0.44 0.38 0.38 0.30 0.24 0.28 0.25 0.32 0.29
Table 4. Estimates of the second moment and standard deviation of [D(k, n) − n]/ √ kn in the case of exponential service times with mean 1 based on 1000 independent observations. k 10 100 200 500 1000 2000 4000 5000
exponential mean std. dev. 5.11 0.65 19.52 0.45 27.91 0.42 44.92 0.35 63.97 0.26 91.38 0.33 130.73 0.28 146.72 0.22
Bernoulli {0,2} mean std. dev. 5.07 0.63 19.27 0.42 27.63 0.38 44.12 0.25 62.80 0.32 89.00 0.24 126.11 0.21 141.17 0.22
Table 5. Estimates of the mean and standard deviation of [D(k,n) − n]/ √n for n = 10 6 . The number of independent replications was 1000 for k = 10, with 100 for k = 100 and 20 in all other cases.
k 50 100 200 500 1000 2000 4000 5000 10 6
n = 10 3 1.85 2.03 2.11 2.35 2.62
n = 10 4 1.88 1.93 1.96 2.04 2.06 2.15 2.29 2.36
n = 10 5 1.87 1.90 1.99 2.00 2.01 2.01 2.03 2.04
n = 10 6 1.87 1.93 1.95 1.97 1.986 1.990 1.994 1.996 2.63*
Table 6. Estimates of E[D(k, n) − n]/ √ kn in the case of Bernoulli − { 0 , 2 } service times. The estimates are based on 20 independent replications for n = 10 6 . The asterisked value for k = 10 6 is estimated from the case k = n = 5000.
mean standard deviation variance sample size variance/n variance/n 3/4 variance/n 1/2
n = 10 30.8 4.26 18.19 1000 1.82 3.23 5.75
service-time distribution exponential Bernoulli n = 100 n = 1000 n = 10 n = 100 380.8 3951 356.8 29.9 2.90 7.21 25.8 5.00 52.00 666.1 24.97 8.39 1000 10 10 10 0.52 0.67 0.25 0.84 1.49 1.64 3.74 0.79 5.20 21.1 2.50 2.65
n = 1000 3619 9.3 87.4 10 0.087 0.49 2.76
Table 7. Estimates of the mean standard deviation and variance of D(n, n) for n = 10 j for j = 1 , 2 , 3 for the cases of exponential and Bernoulli service times.
# jobs simulated 2 13 2 14 2 15 2 16 2 17 2 18 2 19 2 20 2 21
running time (secs) .01 .02 .02 .03 .06 .12 .21 .42 .80
Table 8. Time to simulate a single M/M/1 queue.
# queues 10 100 1000
running time (secs) 4.87 45.11 446.03
Table 9. Time to simulate 2 21 = 2 , 097 , 152 jobs through a series of M/M/1 queues.
0.500
oo o o
0.050
oo oo
0.010
Sorted Data
0.100
o oo oo oo oooo oooo ooo o o o o ooo ooo o o o ooo ooo o o o oooo oo o o o o ooo o o o ooo ooo o ooo oooo o oo ooo oo ooo ooo
o
0.005
oo o o
o
o
0.05
0.10
0.50
1.00
5.00
Quantiles of Exponential Mean 1
Figure 1. Q-Q plot with the exponential mean 1 distribution of estimates of ∆(k, n)/ √n , for n = 10 6 and k = 100, and the Bernoulli {0,2} service times. There are 100 estimates from 100 independent replications. The scale is log-log.
APPENDIX
In this appendix we provide some of the data obtained from the simulations. Tables A1 and A2 display 20 independent replications of estimates of [D(k,n) − n]/ √ kn for n = 10 6 and various values of k, for the exponential and Bernoulli distributions, respectively. Tables A3-A6 display 100 independent replications of estimates of [D(k,n) − n]/ √ kn and ∆(k − 1 ,n)/ √n for k = 100 and n = 10 6 , for the exponential and Bernoulli distributions, respectively. Tables A7 and A8 display 20 independent replications of estimates of [D(k,n) − n]/ √ kn for n = 10 j with j = 4 , 5 and 6 and various k, for the exponential and Bernoulli distribution, respectively. Figure A1 displays the Q − Q plot, for k = 100, n = 10 6 , and Bernoulli {0,2} service times, comparing the sample distribution of [D(k,n) − n]/ √ kn with the normal distribution.
- A-2 -
k 200 500 1000 2000 4000 5000 _100 ____________________________________________________________________________ 1.998753 2.007075 2.007203 2.031406 2.047681 2.056927 2.075226 1.976843 2.001208 2.002918 2.030268 2.046753 2.061122 2.079361 1.986527 2.050240 2.042037 2.019230 2.037350 2.068164 2.078118 1.987959 1.977029 2.018986 2.024594 2.048730 2.075183 2.076821 2.034640 1.969923 1.994518 2.037267 2.036755 2.067429 2.072372 2.012347 1.948945 2.011910 2.018378 2.058709 2.071884 2.070145 1.974565 1.958451 2.004516 2.025490 2.051376 2.072193 2.076544 1.943724 1.973839 2.000796 2.014577 2.036499 2.066570 2.079022 2.043871 1.989753 2.015234 2.011691 2.035696 2.066313 2.075178 1.972256 1.955060 1.984847 2.027526 2.042803 2.067340 2.072258 1.869204 1.975322 2.003858 2.027604 2.038704 2.068214 2.078987 2.027284 1.955040 2.002342 2.020948 2.040203 2.061393 2.070942 1.906604 1.985931 1.988228 2.037999 2.040915 2.068830 2.077133 1.928227 1.935804 2.013405 2.009276 2.035517 2.070393 2.077745 1.986888 1.985068 1.994496 2.018189 2.045798 2.063246 2.071285 1.946783 1.982769 1.996152 2.013738 2.042711 2.067094 2.072692 2.012421 2.010218 2.043726 2.024400 2.060917 2.073584 2.075952 2.034717 1.929336 2.006183 2.018344 2.042848 2.066962 2.071069 1.942283 1.946502 2.029564 2.022015 2.035932 2.066467 2.076104 1.899810 1.935085 2.015304 2.035475 2.041577 2.067276 2.072136 _____________________________________________________________________________ mean 1.974285 1.973630 2.008811 2.023421 2.043374 2.067329 2.074954 _____________________________________________________________________________ std. dev. 0.048644 0.029811 0.015781 0.008319 0.007316 0.004350 0.003061 Table A1. Estimates of [D(k,n) − n]/ √ kn for n = 1 , 000 , 000 and the exponential distribution. Each row was obtained from an independent replication.
- A-3 -
k 200 500 1000 2000 4000 5000 _100 ____________________________________________________________________________ 1.872000 1.975515 1.980888 1.993816 1.993097 1.999730 1.995880 1.966000 1.933654 1.968276 1.965925 1.991755 1.993089 1.999245 1.894800 1.954726 1.980530 1.984772 1.984197 1.992836 1.998171 1.857600 1.916259 1.974359 1.988630 1.985941 1.997706 1.996417 1.918000 2.008466 1.980530 1.968708 1.986031 1.992614 1.995172 1.915800 1.964484 1.982408 1.985721 1.985986 1.993658 1.993249 1.961200 1.970707 1.963357 1.984519 1.995691 1.996188 1.997096 1.901800 1.911734 1.966309 1.984835 2.001683 1.991128 1.997520 2.016000 1.967312 1.973106 1.996283 1.995378 1.989262 1.998680 1.958800 1.947513 1.990727 1.997927 1.992068 1.997231 1.999698 1.931400 1.906077 1.968813 1.984203 1.985673 1.996662 1.999585 1.904200 1.940160 1.977310 2.001595 1.999179 1.995144 1.993560 1.866800 1.970282 1.973375 2.005706 1.989161 1.995650 2.004167 1.943800 1.979475 1.949494 1.977309 1.981469 1.995144 1.992287 1.915400 1.971555 1.951908 1.986416 1.985539 1.986922 1.992966 1.840800 1.969151 1.960763 1.988693 1.988848 1.991761 1.991411 1.924600 1.950483 1.968008 1.977941 1.993320 1.991761 1.995766 1.914000 1.919653 1.982230 1.979396 1.987686 1.997358 1.998991 1.951400 1.980040 1.982230 1.982685 1.986925 1.989262 1.994946 1.895800 1.949211 1.988938 1.980724 1.997032 1.992108 1.993985 _____________________________________________________________________________ mean 1.917510 1.954323 1.973178 1.985790 1.990333 1.993761 1.996440 _____________________________________________________________________________ std. dev. 0.041862 0.026650 0.011174 0.009967 0.005465 0.003288 0.003145 Table A2. Estimates of [D(k,n) − n]/ √ kn for n = 1 , 000 , 000 and the Bernoulli {0,2} distribution. Each row was obtained from an independent replication.
- A-4 -
1.998753 1.976843 1.986527 1.987959 2.034640 2.012347 1.974565 1.943724 2.043871 1.972256 1.869204 2.027284 1.906604 1.928227 1.986888 1.946783 2.012421 2.034717 1.942283 1.899810
1.884486 1.962321 1.954882 1.918168 1.984230 1.904058 1.933798 1.951138 1.958494 1.908429 1.993156 1.990247 1.938573 1.993936 2.042476 1.886498 1.965053 1.970512 2.004230 1.923275
2.051369 1.987444 1.945446 1.951275 1.944113 1.931673 1.924885 1.898996 1.965789 1.926922 2.001987 1.997272 1.965913 1.886619 2.005352 2.026569 1.917412 1.930136 1.951696 1.964350
1.945816 1.942332 1.921279 2.003974 1.886833 1.928797 1.998161 1.945314 1.934996 1.955010 1.912617 1.982567 1.940519 2.019505 1.879795 2.011599 1.871708 1.924784 2.077775 1.835061
2.032164 1.888333 1.876464 1.883310 1.888263 1.904042 1.951595 1.905318 1.896280 1.973538 2.006016 1.890728 1.949533 1.878644 1.965861 1.952757 1.916336 1.882780 1.991115 1.937521
Table A3. Estimates of [D(k,n) − n]/ √ kn for k = 100 and n = 1 , 000 , 000 and the exponential distribution, obtained from 100 independent replications.
- A-5 -
0.448648 0.015053 0.174293 0.068300 0.320909 0.052584 0.001111 0.246465 0.097930 0.008814 0.005709 0.305782 0.269576 0.024160 0.185136 0.034370 0.230678 0.150577 0.209885 0.074992
0.004102 0.177213 0.051265 0.050820 0.043732 0.019559 0.031887 0.072769 0.323079 0.077401 0.028984 0.130846 0.033901 0.052000 0.119467 0.015145 0.037956 0.053305 0.155704 0.113133
0.094761 0.039410 0.151085 0.003599 0.087121 0.072102 0.004153 0.054707 0.168386 0.071538 0.134063 0.188327 0.174868 0.149231 0.059679 0.609672 0.002193 0.075133 0.136935 0.117586
0.046664 0.010173 0.013240 0.060794 0.049883 0.035841 0.023370 0.001075 0.009408 0.091485 0.000623 0.029730 0.335035 0.001472 0.048147 0.101209 0.087990 0.001480 0.072014 0.055853
0.068307 0.017860 0.048200 0.126213 0.047264 0.028961 0.028723 0.178570 0.098068 0.049663 0.183980 0.112284 0.585732 0.112852 0.143017 0.149134 0.028077 0.032307 0.538689 0.282955
Table A4. Estimates of ∆(k − 1 ,n)/ √n for k = 100 and n = 1 , 000 , 000 and the exponential distribution, obtained from 100 independent replications.
- A-6 -
1.872000 1.966000 1.894800 1.857600 1.918000 1.915800 1.961200 1.901800 2.016000 1.958800 1.931400 1.904200 1.866800 1.943800 1.915400 1.840800 1.924600 1.914000 1.951400 1.895800
1.886800 1.947400 1.948800 1.856400 1.940400 2.046800 1.972200 1.940600 1.956600 1.981400 1.921400 1.936800 1.911000 1.892800 1.920000 1.892200 1.881600 1.955600 1.891600 2.017400
1.914800 1.964400 1.936400 1.921200 1.985000 1.940800 1.930600 1.924800 1.931600 2.008400 1.920800 1.881600 1.903200 1.912600 1.888200 2.041000 1.858200 1.938400 1.916200 1.918400
1.988000 1.933400 1.944600 1.926800 1.872400 1.869200 1.904200 1.870000 1.837200 1.861600 1.864600 1.998400 1.920000 1.892800 1.960200 1.900200 1.889200 1.977600 1.945800 1.888800
1.930600 1.896400 1.927800 1.932800 1.973800 1.935000 1.882800 1.973000 1.966200 1.956400 1.931000 1.961800 1.967400 1.953000 1.905200 1.951000 1.963000 1.960400 1.885000 1.954200
Table A5. Estimates of [D(k,n) − n]/ √ kn for k = 100 and n = 1 , 000 , 000 and the Bernoulli {0,2} distribution, obtained from 100 independent replications.
- A-7 -
0.112000 0.130000 0.074000 0.006000 0.296000 0.104000 0.010000 0.070000 0.182000 0.558000 0.048000 0.112000 0.218000 0.050000 0.002000 0.036000 0.008000 0.250000 0.000000 0.042000
0.026000 0.074000 0.122000 0.080000 0.044000 0.232000 0.052000 0.112000 0.206000 0.236000 0.010000 0.158000 0.094000 0.012000 0.214000 0.024000 0.054000 0.090000 0.030000 0.098000
0.078000 0.026000 0.120000 0.154000 0.036000 0.460000 0.334000 0.012000 0.024000 0.038000 0.040000 0.136000 0.138000 0.540000 0.316000 0.032000 0.018000 0.144000 0.094000 0.026000
0.092000 0.250000 0.004000 0.060000 0.072000 0.084000 0.006000 0.036000 0.118000 0.056000 0.018000 0.050000 0.086000 0.246000 0.018000 0.122000 0.004000 0.002000 0.020000 0.154000
0.020000 0.042000 0.282000 0.532000 0.174000 0.020000 0.148000 0.068000 0.028000 0.236000 0.098000 0.048000 0.084000 0.068000 0.216000 0.180000 0.072000 0.046000 0.342000 0.120000
Table A6. Estimates of ∆(k − 1 ,n)/ √n for k = 100 and n = 1 , 000 , 000 and the Bernoulli {0,2} distribution, obtained from 100 independent replications.
n 10 10 10 10 10 5 10 5 10 6 10 6 10 6 __________________________________________________________________________ k 2000 4000 5000 2000 4000 5000 2000 4000 5000 __________________________________________________________________________ 2.4243 2.6177 2.6930 2.1358 2.2139 2.2253 2.0461 2.0615 2.0720 2.4371 2.6354 2.6948 2.1444 2.2011 2.2309 2.0391 2.0686 2.0771 2.4413 2.6269 2.7025 2.1379 2.2013 2.2237 2.0308 2.0717 2.0770 2.4299 2.6192 2.7066 2.1436 2.1972 2.2213 2.0526 2.0662 2.0718 2.4403 2.6210 2.6933 2.1450 2.1958 2.2196 2.0548 2.0649 2.0685 2.4324 2.6138 2.6835 2.1295 2.1992 2.2272 2.0412 2.0625 2.0845 2.4466 2.6111 2.6954 2.1353 2.2097 2.2184 2.0550 2.0689 2.0735 2.4245 2.6190 2.7007 2.1370 2.1987 2.2242 2.0440 2.0682 2.0808 2.4196 2.6221 2.6963 2.1372 2.2055 2.2232 2.0459 2.0645 2.0742 2.6205 2.6860 2.1369 2.2075 2.2240 2.0455 2.0674 2.0759 _2.4240 _________________________________________________________________________ mean 2.6207 2.6952 2.1383 2.2030 2.2238 2.0455 2.0664 2.0755 _2.4320 _________________________________________________________________________ std. deviation 0.0090 0.0067 0.0070 0.0048 0.0059 0.0036 0.0075 0.0031 0.0047 4
4
4
5
Table A7. Estimates of [D(k,n) − n]/ √ kn for the exponential distribution. Each row was obtained from an independent replication.
- A-8 -
n 10 4 10 4 10 4 10 5 10 5 10 5 10 6 10 6 10 6 __________________________________________________________________________ k 2000 4000 5000 2000 4000 5000 2000 4000 5000 __________________________________________________________________________ 2.1471 2.2977 2.3569 1.9972 2.0252 2.0377 1.9854 2.0023 1.9945 2.1493 2.2920 2.3535 2.0055 2.0288 2.0370 1.9923 2.0046 1.9980 2.1515 2.2930 2.3538 2.0069 2.0297 2.0324 1.9911 1.9946 1.9920 2.1480 2.2876 2.3612 2.0134 2.0256 2.0406 1.9886 1.9978 1.9934 2.1475 2.2860 2.3524 2.0090 2.0310 2.0373 1.9991 1.9938 1.9910 2.1511 2.2927 2.3561 2.0131 2.0259 2.0329 1.9945 1.9984 1.9961 2.1560 2.2945 2.3513 2.0045 2.0297 2.0333 1.9888 1.9994 1.9992 2.1632 2.2968 2.3600 2.0116 2.0260 2.0327 1.9881 1.9929 1.9933 2.1524 2.2917 2.3569 2.0157 2.0286 2.0418 1.9948 1.9910 1.9944 2.2885 2.3589 2.0042 2.0275 2.0363 1.9873 1.9979 1.9933 _2.1547 _________________________________________________________________________ mean 2.2920 2.3561 2.0081 2.0278 2.0362 1.9910 1.9973 1.9945 _2.1521 _________________________________________________________________________ std. deviation 0.0049 0.0038 0.0033 0.0056 0.0020 0.0034 0.0042 0.0043 0.0026 Table A8. Estimates of [D(k,n) − n]/ √ kn for the Bernoulli {0,2} distribution. Each row was obtained from an independent replication.
2.05
- A-9 -
o o
oo o
1.95
o o o o ooo ooo oo oooo o oooo oo o oo ooo o ooo ooo o o ooooo o ooo oo oooo oooo o o oo o ooo oo o o o oooo ooo o o ooo
1.90
Sorted Data
2.00
o
1.85
o oo
o
oo oo oo o
o
-2
-1
0
1
2
Quantiles of Standard Normal
Figure A1. Q-Q plot with the standard normal distribution of estimates of [D(k, n) − n]/ √ kn , for n = 10 6 and k = 100, and the Bernoulli {0,2} service times. There are 100 estimates from 100 independent replications.