Using Hartstone Uniprocessor Benchmark in a Real-Time Systems Course Frank Golatowski Dirk Timmermann Department of Electrical Engineering and Information Technology University of Rostock, Germany Email:
[email protected] Abstract In this paper we demonstrate the usability of the application oriented Hartstone Uniprocessor Benchmark to support teaching in fixed priority scheduling analysis. Our implementation of the benchmark in C runs on different real-time operating systems (e.g. LynxOS) and also on standard desktop systems (Windows-NT). We have created some helpful tools around the hartstone program that may be used for a performance evaluation and a rapid analysis of real-time applications. They give the possibility to understand the real-time responsiveness of applications using both real-time and standard operating systems in an uncomplicated way. We distinguish three different methods to compare performance and to check theoretical results of scheduling analysis. The first is based on finding breakdown utilization points of process sets. The second method inspects the special overload behavior beyond the breakdown utilization point. This observation reveals very interesting behavior of the system under overload conditions. Finally we evaluate performance based on a simulation of real-world real-time application.
1 Introduction Teaching real-time systems is of general interest and plays an important role for later successful and efficient use in real projects. Themes in real-time computing are growing up because real-time systems will be more and more complex. The technology of real-time systems moves into new areas [Sta97]. Recent results in computer science like Real-Time JAVA, Real-Time CORBA, OLE for Process Control (OPC) will increasingly influence development of next generation systems towards open, object-oriented and distributed systems. These technologies have big impact on the scalability of applications ranging from small embedded systems like smartcards up to large industrial applications with heterogeneous networks. Industry demands to use general purpose operating systems like Windows-NT for time-dependant or time-critical tasks is increasing. Standard operating systems were primarily designed to maximize the throughput of a system rather than to
provide minimal response time to external events, deterministic program execution, predictable scheduling decisions or resource sharing. Therefore it is necessary to understand the limitations in designing those systems. Scheduling analysis is of great interest for real-time system design [1, 7]. In industry now growing up interest in scheduling analysis as a possibility to give guaranties for time-constrained execution of real-time applications. It is necessary to teach scheduling analysis in a practical manner in combination with real-world systems to bridge the gap between theory and practice. In this paper we show the usability of our implementation of the Hartstone Uniprocessor Benchmark (HUB) in a real-time system course. The benchmark is supported by helpful tools and is integrated in a framework called EVASCAN (Evaluation and Scheduling Analysis). EVASCAN consists of an extendable scheduling analyzer which includes a specification editor, a help system, an interface to a standard database, and the hartstone program. Based on the specification scheduling analysis and visualization of process behavior will be done. The specification for general scheduling analysis may be transformed into one that will be understood by the hartstone program. Results of the benchmark are collected in output files for further analysis. While the above mentioned parts of the frameworks run on Windows-NT the hartstone module is also ported for the real-time operating systems LynxOS and Unix System V variant SORIX. Combining the benchmark with graphical tools it is possible to visualize the background of scheduling analysis. Reasons and arguments may be given for using servers for aperiodics like deferrable or sporadic server. The execution of the benchmark on Windows-NT shows restrictions if real-time systems have to be designed and developed based on this general purpose operating system. Here we employ the hartstone benchmark for the following reasons: − understanding the real-time responsiveness of applications using both real-time and general purpose operating systems − visualizing the behavior of periodic, sporadic and
− − − −
aperiodic processes offering an easy way to execute those kinds of processes using synthetic workload showing differences between results coming from scheduling analysis, execution of a scheduling analyzer and measured results introduction of schedulability performance metrics illustrate real-time behavior of real-time operating systems
2 The model of the Hartstone Uniprocessor Benchmark The benchmark model [10, 3] focuses on typical applications for real-time systems. The benchmark has five different test series consisting of several experiments. Each series consists of different processes: periodic, aperiodic and synchronization processes. Periodics have hard deadlines determined by their period, aperiodics may have hard or soft deadlines. Aperiodic processes with soft deadlines run as background processes. Missing a hard deadline in a real system means that the consequences may be catastrophic. The system may tolerate the missing of soft deadlines. Experiments start with a baseline process set. A process set is characterized by a number of processes, their priority, their synthetic load, process period, starting time and interarrival time. The workload of the baseline process set is increased and the system is observed whether the deadlines are met. The results given from the benchmark may be used for a closer view of real-time scheduling theory and show advantages if the appropriate technique is used in practice.
− − −
results may be compared with well-known Whetstone benchmark the synthetic workload is scalable with increasing performance of general purpose microprocessors the granularity of the SmallWhetstone load increases as the execution time of whetstone instructions gets shorter.
The different series of an experiment represent an increasing workload. Increase of workload is achieved by increasing the frequency of one process, of all processes, the amount of the executed synthetic workload and additional processes that have to be executed. For a further detailed description and the derivation of the benchmark definition see [10] and for implementation issues and some further results see [5].
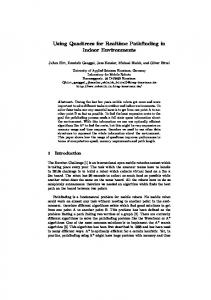
3 Interaction between scheduling analysis and HUB Visualization of process sets First we start with the visualization of parallel execution of processes. Applying a special hartstone “debug” version special events are recorded. This is a combination of HUB with Timescan. (Timescan is a commercial tool that belongs to POSIX-Works of LynxOS).
Synthetic Small-Whetstone workload- Benefits A baseline process set consists of at least five processes. Each process executes a definite workload. The synthetic workload consists of small portions of the well-known Whetstone-Benchmark called SmallWhetstone. Each process executes this synthetic load in a loop according to a parameter within a test description file. The workload derived from the Whetstone benchmark is measured in Kilo-Whetstone Instructions (KWI), because this synthetic load consists of approximately thousand instructions of the Whetstone benchmark. The load executed is measured in Kilo-Whetstone Instructions per Period (KWIPP) and the load per second is measured in Kilo-Whetstone Instructions per Second (KWIPS). The smallest workload portion which may be executed is 1 KWI. The benefits of this synthetic load are: − granularity of the Small-Whetstone load is much finer than the Whetstone instructions in their whole
PID-No. process types
51 periodic5
52 53 55 54 periodic 4 periodic 3 peridic 2 periodic1
Figure 1: A baseline process set of the PH-series
Events are generated at the beginning and at the end of every hartstone process and collected. Later (offline) the collected data can be read by Timescan illustrating the behavior of the application in the examined interval. Based on this visualized execution of the process set a further treatment is possible. Such a treatment reveals differences between worst-case scheduling analysis in combination with simulation (generate with a scheduling analyzer) and method based on real measurements. In Figure 1 and Figure 2 two different process sets a carried
out. It can be shown that each low priority process includes the execution times of the high priority processes. It is not possible to recognize the influence of operating systems, e.g. timer or preempting kernel functions, with tools like Timescan. Furthermore it is difficult to detect whether or not deadlines were missed. Counting the activation is feasible but not practical in high frequency system. Therefore further events and observer algorithms have to be added to the code.
Process i WCET period Ti ratio Ci Ci/Ti 1 6 50 0.120 2 36 250 0.144 3 x 1000 x/1000 4
100
1200
0.083
5
120
1500
0.080
utilization (1...N) 0.120 0.264 0.264+ x/1000 0.347+ x/1000 0.427+ x/1000
utilization bound 1.000 0.828 0.779
frequency fi [Hz] 20 4 1 0.833 0.667
priority (LynxOS) 25 24 23 22 21
0.756 0.743
Table 1: A set of 5 periodic processes Process i 1 2 3 4 5
worst- case execution time Ci [KWIPS] 29 175 2502 485 582
Table 2: The normalized process set
PID-No. process types
50 - 54 periodics
55 sporadic
56 aperiodic
57 server
Figure 2: A baseline process set of the SA-series
4 Two Exercises Finding longest-possible execution time In [11] an example is given which may be used in an exercise. The example clarifies the task of calculating the longest-possible execution time of a process which belongs to a set of five processes. Four processes of the set have a fixed period but one process gets a period in rate monotonic priority assignment because there is a need of executing this process as the third important process of the set. Now there the exercise is to find the longest-possible execution times. The technique to use this is based on identifying the breakdown utilization. The rules and algorithms are given in [11]. The result is x=516. This means all processes of the whole process set will meet their deadlines up to an execution time of 516. Now we want to prove the theoretical result on a real system using hartstone program. Therefore it is necessary to norm the execution times in KWI. Instead of periods frequencies are used. A raw performance value 4850 KWIPS was measured on a 486-Processor (33 MHz, operating system: LynxOS, Compiler: GCC 2.3). This is the maximum value.
Based on the raw performance the process set shown in Table 1 is normalized to the synthetic workload shown in Table 2. The second table shows the computed result the real-time computer system would reach if there were no overhead. Therefore the real system will reach smaller values. The appropriate experiment starts with a baseline process set. Thereby the workload of process T1, T2, T4 and T5 are fixed (s. Table 2 ) while the workload of process T3 is continuously increased starting with a value of 2000 KWIPS. As a result the highest value without loosing any deadline is 2482 KWIPP. This value corresponds to a value of x=512 and deviates from the theoretical value (x=516) by 1% only. This difference is tolerable and is due to the overhead of the system. The influences are: − RTOS overhead (timer, queue operation) − context switch of all processes − overhead of the used additional driver software Note the overhead resulting from context switches is of minor impact as the frequencies in the set are low.
Mine pump controller The second example is the mine pump controller [2, 4] to demonstrate the execution of synthetic applications characterized by a known process set. This application is characterized by hard real-time requirements that have to be met. It is different to the first example as not only periodic but also an aperiodic and a sporadic process exist. The priority assignment is done according to deadline monotonic order. From these timing requirements the following characteristics of the appropriate process set presented in [2] result.
Table 3: process set for the mine pump process
type of process
arrival times [sec]
CH4 sensor CO sensor water flow sensor airflow sensor
P
5
1
0.30
1504
25
P P
60 60
1 3
0.15 0.20
752 1002
24 22
P
60
2
0.20
1002
23
S A
100
20
0.01 0.20
50 1002
26 21
HLW handler
dead- WCET workload prioline (i486) rity [sec] [sec] [KWIPS] LYNX
After transforming this process set into a hartstone process set it can be executed using hartstone. During execution of the set all deadlines are recorded. In this example deadlines are smaller than process periods. Following the deadline monotonic approach the represented priorities correspond to their deadline. The water flow sensors communicate with the system via interrupts. To emulate interrupts we use a sporadic process characterized by a minimal arrival time and an exponential distribution. The corresponding process set is executed on the real-time computer system. With this process set the given requirements are met. No deadlines are missed. Using the same process set on the system with better performance results in a performance index which can be used to compare the systems on base of the application.
operating systems and have a general preemptive priority-based scheduling algorithm may be identified. In several experiments different kinds of workload are increased step by step. If deadlines are missed for the first time the breakdown utilization point is reached. But we can observe the system beyond the breakdown utilization point. Each experiment of a test series (Table 1) starts with a baseline process set. This baseline process set is equal in all series but in the various tests of an experiment one parameter of a series is changed while keeping the others constant. The process set is specified in a test description file. At the beginning of each experiment the raw performance executed within one process is measured. Thereafter the test description file is interpreted. It starts with the specification of the baseline process set. According to the specification processes are created and started. In one test file all experiments of a test series are described. (Note test files are automatically created by a test file editor). Experiments of a test series are ordered in the test file by increasing workload. This is the nominal workload the system has to execute. An experiment terminates after a definite amount of time or a definite number of missed deadlines. Table 5: Definition of baseline process set for PH-series on the reference Pentium system
Table 4: Series of the Hartstone Uniprocessor Benchmark PH-series 1-4 PN-series 1-4 AH-series 1-6
SH-series 1-5
SA-series 1-4
independent periodic processes with harmonic frequencies and hard deadlines independent periodic processes with nonharmonic frequencies and hard deadlines independent periodic processes with harmonic frequencies , one independent aperiodic process with soft deadline, one independent sporadic process with hard deadline periodic processes with harmonic frequencies, one synchronization process, the periodic processes have to synchronize one time in each period periodic processes with harmonic frequencies, one independent aperiodic process with soft deadline, one independent sporadic process with hard deadline, synchronization process of the SHseries
5 Execution of HUB-experiments In this section we present benchmark results. Typical behavior of real-time application which run on real-time
P1 P2 P3 P4 P5 Σ
start time
duration
priority
freq.
[sec.]
[sec.]
LYNX
[Hz]
5 5 5 5 5 5
10 10 10 10 10 10
21 22 23 24 25
32.00 64.00 128.00 256.00 512.00 992.00
workload workload per per sec. period [KWIPP] [KWIPS] 64 32 16 8 4
2048 2048 2048 2048 2048 10240
Experiments are executed beyond the breakdown utilization point. The main method works as follows. Given that a deadline can not be met the next will be omitted. Using this policy the system can serve at least the following requests. According to the method used the system behavior under overload can be described.
Experiments on Lynx-OS The benchmark has been executed on a 90 MHz Pentium Processor, with 512 KB secondary cache and 32 MB of main memory. The used compiler is GCC V2.4. The raw performance measured at the beginning of each experiment is 33470 KWIPS. The diagrams (Figure 3- Figure 5) depict the measured utilization (right y-axis), the missed deadlines (left y-
90
90%
80
80%
70
70%
60
60%
50
50%
40
40%
30
30%
120.13
116.46
112.80
109.13
105.47
98.14
101.80
94.47
90.81
87.14
0 83.48
0% 79.81
10 76.15
10% 72.48
20
68.82
20%
65.15
missed and skipped deadlines
100%
measured utilization [%]
set is different in that also process frequencies are possible which are greater than that described in [10] because the hartstone implementation is independent of the run-time system of the operating system. The measured breakdown utilization point of the PH-1 experiment shown in (Figure 3) is 81%. Note that in this experiment only the frequency of the fifth process is increased and at the BU point its frequency reaches 1152 Hz. In PH-3 (Figure 4) experiments the breakdown utilization point has the highest value (88%) of all series. In an ideal system without context switching time the theoretical maximum utilization would be 100%. So in this experiment the influence of system overhead can be seen as the number of activation remains constant. Only the computation time is increased. So here the maximum utilization of all experiments is possible.
axis), and the nominal workload on x-axis. The measured utilization is based upon the raw performance measured when only one process executes the synthetic load. The nominal workload is the ratio between raw performance and theoretical workload the system has to execute. The nominal workload results from the test description. The measured utilization is the ratio between measured workload and raw performance. All values are given in percent. The utilization is equal to the nominal workload up to the breakdown utilization point. Beyond that point the measured utilization is smaller than the nominal workload because missed deadlines result in omitted requests. (See the utilization curve in the diagrams.) Based on the baseline process set in figure 1 the next results will be described. Note that the baseline process
nominal workload [%] periodic 1
periodic 2
periodic 3
periodic 4
periodic 5
utilization
p e rio dnom ic 1 inal
w orkload [%2 ] p e rio d ic
p e rio d ic 4
Figure 4: PH-3 Test (LynxOS )
p e rio d ic 5
100 90 80 70 60 50 40 30 20 10 0
p e rio d ic 3 u tiliza tio n
periodic 1 periodic 4 utilization
nominal workload [%] periodic 2 periodic 5
Figure 5: AH-2 Test (LynxOS)
periodic 3 sporadic
measured utilization [%]
100% 90% 80% 70% 60% 50% 40% 30% 20% 10% 0% 44 ,8 52 5 ,3 59 2 67 ,8 ,2 74 7 ,7 82 4 ,2 89 2 ,6 97 9 10 ,17 4 11 ,64 2 11 ,12 9 12 ,59 7 13 ,07 4 14 ,54 2 14 ,02 9, 49
missed and skipped deadlines
100 90 80 70 60 50 40 30 20 10 0
measured utilization[%]
100% 90% 80% 70% 60% 50% 40% 30% 20% 10% 0%
63 ,1 4 75 ,3 7 87 ,6 1 99 ,8 11 4 2, 0 12 8 4, 3 13 1 6, 5 14 4 8, 7 16 8 1, 0 17 1 3, 2 18 4 5, 48
missed and skipped deadlines
Figure 3: PH-1 Test (LynxOS)
nominal workload [%] periodic 1 periodic 4
periodic 2 periodic 5
frequency workload workload per per Windows period second [sec.] [sec.] NT (Hz) [KWIPP] [KWIPS] P1 P2 P3 P4 P5 Σ
5 5 5 5 5 5
10 10 10 10 10 10
22 23 24 25 26
2.00 4.00 8.00 16.00 22.00 62.00
1024 512 256 128 64
2048 2048 2048 2048 2048 10240
Table 6: Definition of baseline process set for PH-series on the reference Pentium system
5% 5% 4% 4% 3% 3% 2% 2% 1% 1% 0%
100 90 80 70 60 50 40 30 20 10 0 9,78 22 34,2 46,5 58,7 70,9 83,2 95,4 108 120 132
100 90 80 70 60 50 40 30 20 10 0
measured utilization [%]
90% 80% 70% 60% 50% 40% 30% 20% 10% 0% 9, 7 20 8 ,7 31 9 ,7 9 42 ,8 53 64 ,8 ,8 75 1 ,8 86 1 ,8 97 2 , 10 82 8 11 ,83 9 13 ,83 0, 84
missed and skipped deadlines
In the next experiments the behavior of Windows-NT is shown when processes with hard real-time constraints (deadlines) are executed. The baseline process set is different to that used on Lynx-OS. Frequencies of the process set may not be so high (Table 6) due to the required runtime support.
priority
measured utilization [%]
Experiments on Windows-NT
start duratime tion
missed and skipped deadlines
The demonstrated behavior matches our theoretical assumptions: achieved utilization of harmonic processes is greater than that of non-harmonics (Results of PNexperiment are not shown here). Processes miss their deadlines in the sequence of their priority: at first the lowest prioritized process misses all its deadlines. The next prioritized process misses its deadlines after that. The experiment AH-2 is interesting because of the behavior of the sporadic (hard aperiodic real-time process). The arrivals of the sporadic processes are random numbers. Those random arrivals can influence the whole system. Because of the random events and although it has the highest priority the sporadic process misses deadlines before the process with the lowest priority. The influence of the sporadic process is great, all the other processes miss deadlines too.
periodic 3 utilization
Figure 6: Utilization of PH-3 Test (Windows-NT)
Based on the chosen baseline process set we evaluate Windows-NT here. In the experiment the measured breakdown utilization point is 28 % because process P3 misses deadlines. But this point may be reached earlier in another experiment. The highest priority process meets all of its deadlines without one exception at 93 % is one runaway (s. Figure 7). (Note: process sets can be found where no deadline is missed up to an utilization of 100% for this process.)
nominal workload [%] periodic 5
utilization
Figure 7: Utilization of PH-3 Test (Windows-NT), highest priority process.
All the other processes are loosing deadlines in an uncoordinated manner (s. Figure 6). The reason is that some Windows-NT system processes are on the same real-time priority level. There is an insufficient number of real-time priorities for a design allowing ratemonotonic priority assignment.
6 Integration of an extendable Scheduling Analyzer On Windows-NT the hartstone program is combined with an extendable scheduling analyzer. This is described next. The scheduling analyzer includes well known scheduling analysis algorithms (dynamic and fixed priority) for uniprocessor systems and resource protocols and runs on Windows-NT (Figure 11). Until now the following scheduling algorithms and appropriate scheduling analysis are integrated (Figure 8): preemptive
priority based (PRIO), rate-monotonic (RMS), deadlinemonotonic (DMS), earliest deadline first (EDF), earliest deadline late (EDL), preemptive and non-preemptive least-laxity first scheduling (LL). The scheduling analyzer is extendable with user defined (USER) scheduling analysis by writing a new Windows-DLL (dynamic link library). This DLL consists of an interface and the appropriate empty wrapper functions. Scheduling Analyzer
static PRIO
RMS
Periodics
DMS
BG PL DS SS
Figure 9: Process Set Specification
Scheduling Algortihms dynamic
FIFO
Non-Periodics aperiodics
User Interface
Visualization
Feasibility
USER
EDF
IPC
Periodics
LL1
LL2
Non-Periodics
PI PCP IPCP SRP
IPC
sporadics
aperiodics
sporadics
EDL
DBG DDS DSS TBS VBS
SRP DCP
Figure 8: Components of an extendable Schedulinganalyzer
The specification is done according to [6] by process and resource tables. Both periodic and non-periodic processes (sporadics, aperiodics) are treated. The usage of servers like (background (BG), polling (PL), deferrable (DS), sporadic (SS) for static priority systems and the dynamic server variants (dynamic background (DBG), deadline deferrable (DDS), dynamic sporadic (DSS) ) or total bandwidth servers (TBS, VBS) for dynamic priority systems to handle non-regular events is possible. Also interprocess communication protocols like priority inversion (PI), priority ceiling protocol (PCP), instant priority ceiling protocol (IPCP), stack resource protocol (SRP) and dynamic ceiling protocol (DCP) may be used. As an example we have integrated analysis as described in [9] in an own USER-DLL. The scheduling analyzer is an interactive tool with a powerful window based frontend, specification editor and integrated help system. Also factors affecting the real behavior like jitter, different priority levels, scheduling overhead, system timer can be taken into account. Figure 9 and Figure10 show a process set specification and a result window of the scheduling analyzer. The scheduling analyzer supports a database interface. This database contains real values measured in real systems for example execution times of system calls, fine-grained system times and information of the system (used RTOS and platform). The database has a standard interface (ODBC, SQL) and can also be integrated into an intranet.
Figure10:Visualization of process execution.
Real-Time Systems static
periodic
aperiodic
dynamic shared Ressources
periodic
aperiodic
shared Ressources
Background
Priority inheritance
DPS Dynamic Polling Server
DPCP...Dynamic priority ceiling protocol
Polling
Priority ceiling protocol immidate ceiling protocol Stack resource policy ceiling semaphore protocol
DDS, DSS, DES
SRP...Stack resource policy
bandwidth preserving Priority Exchange
DPE, DSS, TBS total bandwidth server
Deferrable Server
Constant Utilization Server
Sporadic Server
Total Bandwidth Server
Slack Stealer
DDS...Deadline Deferable Server DSS...Deadline Sporadic Server DES...Dynamic Exchange Server
DPE...Dynamic Priority Exchange DSS...Dynamic Sporadic Server TBS...Total Bandwidth Server
Figure 11: Overview of important research issues on real-time system
In the context of lectures the scheduling analyzer may be used for − comparing results of scheduling analysis (as done in the scheduling analyzer) with those stemming from Hartstone Benchmark. − explaining and illustrating different scheduling algorithms − design support for real-time systems − simplifying scheduling analysis
[3]
Donohoe P., Shapiro R., Weidermann N., "Hartstone Benchmark User´s guide", Technical Report CMUSEI-90-TR-1, Software Engineering Institute, Carnegie Mellon University, May 1990
[4]
Joseph M. (Ed.), "Real-Time Systems - Specification, Verification and Analysis," Prentice Hall, 1996
[5]
Golatowski F., Timmermann D., "Application Oriented Performance Evaluation of Real-Time Systems Based on Modern Microprocessor Architectures," EMSYS '96, OMI 6th Annual Conf., Berlin, In: Müller-Schloer et al. (Eds.) Embedded Microprocessor Systems, IOS Press, Amsterdam, 1996, pp. 354-360
[6]
Klein M.H. et al., "A Practitioner’s Handbook for Real-Time Analysis," Carnegie Mellon University, Software Engineering Institute, Kluwer Academic Publishers, Boston, Dordrecht, London, 1993
[7]
Liu C.L., Layland J.W, "Scheduling Algorithms for Hard Real-Time Environments," Journal of the ACM, Vol. 20, No. 1, 1973, pp. 46-61
[8]
Stankovic J. A., "Real-Time and Embedded Systems," In: Allen B. Tucker (Ed.), CRC Computer Science and Engineering Handbook, CRC Press, 1997, pp. 1709-1724
We would like to thank Prof. Janusz Zalewski for some helpful comments on an earlier version of this article.
[9]
Tindell K. "An Extendible Approach for Analyzing Fixed Priority Hard Real-Time Tasks," Technical Report YCS-91-189, Department of CS, University of York, 1994
References
[10]
Weidermann N.H., Kamenoff N.I., "Hartstone Uniprocessor Benchmark: Definitions and experiments for real-time systems," Real-Time Systems Journal, Vol. 4, No. 4, 1992, pp. 353-383
[11]
Zalewski J., "What Every Engineer Needs to Know About Rate-Monotonic Scheduling: A Tutorial," Real-Time Magazine, No.1, 1995, pp. 6-24
7 Summary and conclusions In this paper we demonstrated an implementation of the hartstone benchmark and how this benchmark can be used for supporting a student course on real-time systems. The hartstone program is accompanied by some helpful tools and is integrated in a general framework. By execution the benchmark on a real-time operating system it is possible to show typical behavior of real-time operating systems. Using the benchmark on standard desktop operating systems which have not been designed for real-time systems but are in widespread use (including timedependant applications) may be helpful to understand the impact of the underlying scheduler. We have shown some selected results for Lynx-OSreal-time operating system and for Windows-NT. Based on the results and an extensive evaluation it is possible to explain the function of the NT-scheduler and point out the inadequate design of NT scheduler for the design of real-time systems.
Acknowledgments
[1]
[2]
Audsley N. et al., "Fixed Priority Pre-emptive Scheduling: An Historical Perspective," Real-Time Systems Journal, Vol. 8, 1995, pp. 173-198 Burns A., Wellings A.J., "HRT-HOOD a structured design method for hard real-time systems," Real-Time Systems Journal, Vol. 6, No.1, 1994, pp. 73-114