The auto-correlation structure for the time- series data was .... Values are medians within rainfall classes (amounts). Rain amount 17 ..... The authors are grateful to Peter Downey, technician at results in water ... Part 4. SSSA Book Ser. 5. SSSA ...
Using High-Resolution Soil Moisture Data to Assess Soil Water Dynamics in the Vadose Zone James L. Starr* and Dennis J. Timlin
Reproduced from Vadose Zone Journal. Published by Soil Science Society of America. All copyrights reserved.
ABSTRACT
ditions and soil management practices can be enhanced by monitoring volumetric soil water content in nearcontinuous real time. Time domain reflectometers and capacitance probes are two instrumental methods being used to monitor soil water dynamics that meet this requirement. (For brief reviews see Ferre´ and Topp [2002] and Starr and Paltineanu [2002].) Several field studies have been performed with these soil water monitoring instruments (e.g., van Wesenbeeck and Kachanoski, 1988; Parkin et al., 1995; Fares and Alva, 2000; Paltineanu and Starr, 2000; Timlin et al., 2001; Mahmood-ul-Hassan and Gregory, 2002), including studies around selected storm events (Paltineanu and Starr, 2000), and nontraffic interrow dynamics during a single growing season (Starr and Paltineanu, 1998). However, year-round multiyear studies of soil water dynamics at specific crop row and interrow positions have not been published; such research might reveal the relative importance of the major contributing factors to soil water dynamics as a function of climatic seasons. The objectives of this paper were to assess (i) the impact of soil water dynamics in the vadose zone from realtime and near-continuous measurements of soil water content and (ii) the interactive effects of tillage, position, and season on water infiltration, storage, drainage, and crop uptake.
Infiltration and water flow in soils are highly transient processes, but may be estimated from high frequency measurements of soil water content. The objectives of our study were to assess the impact of vadose zone soil water dynamics from real-time and near-continuous soil water content measurements and to assess the interactive effects of tillage, row position, and season on water infiltration, storage, drainage, and crop water uptake. Multisensor capacitance probes were installed at row and interrow positions at four soil depths in plow tillage (PT) and no tillage (NT) corn (Zea mays L.) plots, with volumetric water contents values recorded every 10 min for a 30-mo period. Three water parameters (cumulative water storage, net water storage, and drainage below 55 cm) were grouped for statistical analysis by rainfall amounts and “seasons” of primary periods of groundwater recharge and evapotranspiration. Crop water uptake amounts during extended dry-down periods were also quantified. We found more significant differences between tillage and row position treatments for high rainfalls (⬎17 mm) than for low rainfalls. When significant differences in the three water parameters existed between positions, these were due either to greater values in the row position or smaller values at the traffic interrow position. In general, more water uptake took place under PT than under NT and from row more than interrow or traffic interrow positions. These results show both the value and limitation of near-continuous real-time soil water data for quantifying soil water dynamics in varying management and weather conditions.
S
oil water is highly dynamic in both space and time, especially near the soil surface (Or and Wraith, 2002), resulting in direct environmental and management implications. Many factors contribute to soil water dynamics, including spatial and temporal variation in soil properties, tillage, type and stage of plant growth, position relative to corn planter rows and wheel traffic, and water inputs. Tillage affects the relatively larger pores of a soil matrix to a greater extent than smaller pores (Or et al., 2000; Snyder et al., 2000). The impact of these factors on soil water dynamics and soil water flux is likely to be greatest when water input rates at the soil surface are at or near the soil’s infiltration capacity. Under temporally varying water input conditions, significant changes in volumetric soil water content can take place during short time periods. Furthermore, tillage can have a strong effect on soil properties that are related to water flow and storage in soils (Snyder et al., 2000). Assessing the fate of soil water under such varying con-
MATERIALS AND METHODS Meteorological Data
J.L. Starr, USDA-ARS Environmental Quality Lab., Bldg. 007, 10300 Baltimore Ave., BARC-W, Beltsville, MD 20705; D. Timlin, USDAARS Alternate Crops and Systems Lab., Bldg. 001, Rm. 342, 10300 Baltimore Ave., BARC-W, Beltsville, MD 20705. Received 21 Jan. 2004. Original Research Paper. *Corresponding author (starrj@ba. ars.usda.gov).
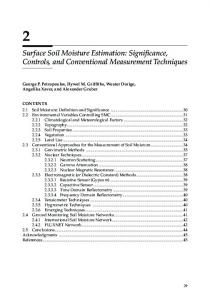
Rainfall and other meteorological data were recorded at 5-min intervals with Campbell Scientific weather stations (Campbell Scientific, Inc., Logan, UT) near the field site. The rainfall data were subdivided into rainfall events (rainfall groups), with each event separated by time periods ⬎24 h without rainfall. All the rainfall events were screened to eliminate trace rainfall events with ⬍0.5 mm in 30 min. The rainfall and soil water data were grouped into two “seasons” in relation to primary periods of groundwater recharge and evaporative demand. The time periods for the two seasons were Recharge Season: 8 Sept. 1995 through 30 Apr. 1996, 8 Sept. 1996 through 30. Apr. 1997, and 10 Oct. 1997 through 31 Dec. 1997 High Evapotranspiration (ET) Season: 1 May through 7 Sept. 1995, 1 May through 7 Sept. 1996, and 1 May through 10 Oct. 1997. Frequency distributions of rainfall amounts and intensities for these two seasonal groups for the 2.5 yr of this study are shown in Fig. 1. Rainfall frequencies in the recharge season were double those in the high ET season (i.e., averaging 10.4 d for the recharge season vs. 20.5d for the high ET season). The seasonal distribution shapes and medians of the rainfall amounts are quite similar (Fig. 1a), in contrast to the shapes
Published in Vadose Zone Journal 3:926–935 (2004). Soil Science Society of America 677 S. Segoe Rd., Madison, WI 53711 USA
Abbreviations: DOY, day of year; ET, evapotranspiration; MCP, multisensor capacitance probe; NT, no tillage; PT, plow tillage.
926
927
Reproduced from Vadose Zone Journal. Published by Soil Science Society of America. All copyrights reserved.
www.vadosezonejournal.org
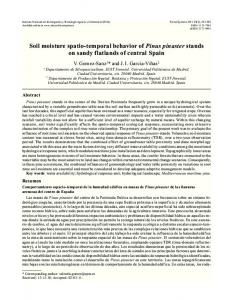
Fig. 2. Schematic of the multisensor capacitance probe showing three of four sensors.
Fig. 1. (A) Cumulative rainfall amount and (B) intensity distribution frequencies for the recharge and high evapotranspiration (ET) seasons during this 2.5-yr study.
and medians of the rainfall intensities (Fig. 1b). Median rainfall amounts within the two rainfall groups were similar for the two seasons (Table 1), but there was a large difference in total rainfall amounts between the two rainfall groups. Not only were the rainfall intensities greater during the high ET season, but they were 60 to 75% greater for the high rainfall group than for the low rainfall group. Lower intensity rainfalls during the recharge season would likely enhance groundwater recharge even though the initial soil water contents are expected to be consistently quite high. The higher rainfall intensities during the high ET season reflect the common occurrence of summer thunderstorms in the mid-Atlantic region.
(MCPs). Up to eight capacitance sensors can be placed on each MCP, at user-determined depth intervals of 10 cm or more. For this research, each MCP had four capacitance sensors, centered at soil depths of 10, 20, 30, and 50 cm (Fig. 2), giving soil water sensing depth intervals of 5 to 15, 15 to 25, 25 to 35, and 45 to 55 cm. Soil water contents were recorded at 10-min intervals. Instrument characterization, sensor calibrations, and probe installation are presented by Starr and Paltineanu (2002). Briefly, the MCP sensors were tested in the laboratory on a carefully compacted silt loam soil (finesilty, mixed, active, mesic Aquic Hapludult) collected from this field site (Paltineanu and Starr, 1997). They obtained a highly significant (r2 ⫽ 0.992 for n ⫽ 15, and RMSE ⫽ 0.009 cm3 cm⫺3 water), nonlinear (v ⫽ 0.490 SF2.1674) relationship between the soil volumetric water content (v, cm3 cm⫺3) and the scaled frequency [SF ⫽ (Fa ⫺ Fs)/(Fa ⫺ Fw)]. The SF represents the ratio of each capacitance sensor frequency (inside a 50-mm-o.d. PVC access pipe) in soil (Fs), in nonsaline water (Fw), and in air (Fa). Each sensor’s zone of primary influence represents a soil cylinder approximately 10 cm along the axis of the probe, with a 10-cm-diameter ring around its PVC access pipe. Thus, the water content at each sensor may be expressed as either a volumetric percentage or a depth of water in a 10-cm soil depth (mm/10 cm).
Soil Water Measurement
Site Conditions
Near-continuous real-time soil water measurements were recorded with two EnviroSCAN (Sentek PTY, Ltd., Kent Town, South Australia) soil water monitoring systems, with 16 semipermanently installed multisensor capacitance probes
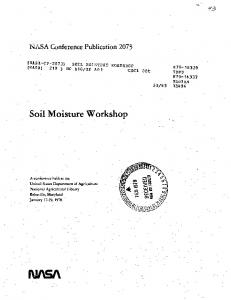
Field experiments were conducted on a Mattapex silt loam soil at the Beltsville Agricultural Research Center, Beltsville, MD. The Ap horizon has about 35% sand, 56% silt, and 9% clay. The average slope at the 0.5-ha field site was about 4%. The field site has been under continuous maize production since 1992. One-half of the field plots used in this report were changed from moldboard plow tillage (PT) to no tillage (NT) in 1994. The paired PT–NT plots were separated by a central alley, with the plots laid out on the contour and separated by a 3.0-m-wide berm and drainage ditch to prevent surface runoff from one plot to the next (Fig. 3). Both tillage treatments were planted with a six-row no-till planter in 76.2-cm rows, with wheel-compaction between rows two and three and between rows four and five. Further details of the experimental site, treatment, and installation are given by Starr and Paltineanu (1998).
Table 1. Median rainfall by season and rainfall amount category. Rainfall group Amounts Season†
ⱕ17 mm
Intensities
⬎17 mm
ⱕ17 mm
mm Recharge High ET
6.9 4.8
mm 27.9 31.8
2.0 3.2
⬎17 mm h⫺1 3.2 5.7
† Recharge season: 8 Sept. 1995–30 Apr. 1996, 8 Sept. 1996–30 Apr. 1997, 10 Oct. 1997–31 Dec. 1997; high evapotranspiration (ET) season: 1 May– 7 Sept. 1995, 1 May–7 Sept. 1996, 1 May–10 Oct. 1997.
Reproduced from Vadose Zone Journal. Published by Soil Science Society of America. All copyrights reserved.
928
VADOSE ZONE J., VOL. 3, AUGUST 2004
Fig. 3. Schematic of site layout with location of multisensor capacitance probes (MCP) in eight no tillage (NT) and plow tillage (PT) plots. The enlarged area shows the MCP placement positions in the two intensively instrumented plots.
The MCPs relative field placement are shown in Fig. 3, with the intensively instrumented Plots 4 and 6 being the major source of data for this paper. The two intensively instrumented plots each had five MCPs, with two probes placed in corn rows, two probes in traffic interrows, and one probe in the nontraffic interrow. The EnviroSCAN system was set to record soil water content (as frequency counts) at 10-min intervals. Soil water content was continuously monitored in this experimental design from June 1995 through April 1998, except for short breaks for tillage and planting operations each spring when the probes and access pipes were removed, the holes backfilled, and the probes reinstalled at a nearby location after planting corn. (A lightning strike in June 1997 resulted in an additional 5-wk absence of soil water monitoring.)
Cumulative Storage (mm) as the summation of all increases in water storage (5–55 cm) during a rainfall. Values were calculated for each rain event by differencing the total amount of water in the profile (5–55 cm) measured at 10-min intervals (Fig. 4) and summing the positive differences (increases in water content).
Apparent Water Uptake Rates by Corn For each year, a representative summer period was chosen when there was a 2- to 3-wk dry-down period. We chose soil drying periods after rainfalls of at least 20 mm. The data for the three chosen periods were averaged over years, divided into beginning and ending periods of approximately 5 d each, and analyzed to test if the regression line slopes of water content vs. time relationships varied between the two periods as a function of the tillage and positional groupings.
Analytical Methods Soil profile water content analysis in this paper (5–55 cm) accentuates tillage effects that are most evident in the soil profile close to the soil surface. Since the water contents were recorded as millimeters of water per 10 cm of depth, the summation and differencing of water contents by soil layers gave the water-depth estimate (mm) that had been received or removed from the soil area around the soil moisture sensors. For these calculations, water storage at the 35- to 45-cm depth was interpolated from the readings at the 30- and 50-cm depths. The soil water data were processed to calculate the following three variables that would best describe soil water dynamics at the site:
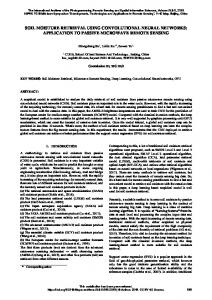
Fig. 4. Soil water dynamics around an irrigation event at four sensor depths under plow tillage and no tillage corn, at a row position. Total water added was 41 mm.
929
Reproduced from Vadose Zone Journal. Published by Soil Science Society of America. All copyrights reserved.
www.vadosezonejournal.org
Fig. 5. Dynamics of soil water storage (5–55 cm) in side-by-side plow tillage (PT) and no tillage (NT) plots, at the nontraffic interrow position, in this 2.5-yr study. The horizontal lines in 1995 represent the approximate water holding capacities for NT and PT.
Net Storage (mm) as the difference between the final soil water storage (5–55 cm) 24 h after a rainfall ended and the initial soil water storage immediately preceding the rainfall. Drainage (mm) below 55 cm, as the summation of negative changes in soil profile water storage at the four sensors (10, 20, 30, and 50 cm) during a rainfall event. Water Uptake Rates (mm d⫺1) quantified for several extended time periods between rainfall events during the summer months. The soil water content data were processed to remove outliers and ensure that all locations had the same number of observations. Occasionally, data values were not available for one or more sensors, in which case the data from all the sensors for this time period were deleted from the database. Short periods of missing data, however, were interpolated using Proc Expand in SAS (SAS Institute, 1999) when there were no infiltration events or other rapid changes in water content. These periods were not more than 6 h (36 data points at 10min intervals). Periods of freezing soil conditions were identified from time series plots of water contents, and the water contents for these rainfall periods were deleted from the database. These freezing periods had strong winter decreases in water contents (e.g., two 1997 periods shown in Fig. 5). Differences in water storage between two time periods could be due to drainage or ET. The data indicated that there was little change during the night after 48 h, suggesting little drainage after this point (data not shown). To minimize ET contributions, drainage periods were generally ⬍2 d, and drainage was only accumulated during time periods in which rainfall accumulation was ⬎0.5 mm within the preceding 24 h. Total ET during the initial 24 h is generally small, especially relative to the calculated drainage amounts. To minimize errors due to unknown ET during time periods longer than 24 h, drainage calculations were discontinued when soil water storage in the 25- to 35-cm layer (30-cm sensors) reached a set amount. This amount was determined by ranking in descending order the water storage values at the end of a rainfall
period for all rainfall events for a particular sensor. The value for which 33% of the water storage values were larger was chosen as the drained water storage value of the profile. We assumed this drained water amount corresponded to the amount of water in the soil when changes in water content became small, usually within 24 h after a rainfall event. Water fluxes that occurred when the soil water content was high and near steady state were difficult to detect using differences in water content because the fluxes into a soil layer are balanced by fluxes out. This condition can occur during and shortly after rainfall. Visual inspection of the water content data showed that for the sensors in the upper 30 cm of soil, the water contents were highly dynamic and responsive to water inputs to the surface. There were no plateaus of water content during rainfall events that would indicate significant steady-state fluxes of water at constant high water content.
Statistical Analysis This paper focuses on the fate of rainfall associated with (i) tillage (PT vs. NT), (ii) row position (in corn rows vs. interrows), and (iii) wheel traffic interrows vs. nontraffic interrows. Specific water parameters for comparison were cumulative storage, net storage, drainage, and water uptake. Data were grouped for comparison into two time groups (recharge and high ET), tillage (NT and PT), position (nontraffic interrow, row, and traffic interrow), and rainfall amounts (low and high, breaking at the approximate median of 17 mm). Statistical analyses were performed using SAS software (SAS Institute, 1999). Proc GLM was used to test differences in cumulative storage, net storage, and drainage among the groupings. Since these variables were not normally distributed, the data were ranked and the ranks used in Proc GLM. Note that nonparametric statistical methods that use ranks are not sensitive to ordinal differences between two numbers, making it difficult to interpret differences among ranks. Medians were calculated for the purpose of facilitating algebraic comparisons
930
VADOSE ZONE J., VOL. 3, AUGUST 2004
Table 2. Means and standard errors of initial soil water contents (5–55 cm soil) before rainfalls. Season†
Tillage
Mean
no tillage plow tillage no tillage plow tillage
174.4 156.7 159.4 134.7
SE mm
Recharge
Reproduced from Vadose Zone Journal. Published by Soil Science Society of America. All copyrights reserved.
High ET
1.3 2.0 2.0 2.4
† Recharge season: 8 Sept. 1995–30 Apr. 1996, 8 Sept. 1996–30 Apr. 1997, 10 Oct. 1997–31 Dec. 1997; high evapotranspiration (ET) season: 1 May– 7 Sept. 1995, 1 May–7 Sept. 1996, 1 May–10 Oct. 1997.
among the groupings for presentation purposes. Proc MIXED was used to test the differences in regression lines for water uptake rate analysis (i.e., dry-down periods). The data were treated as a repeated analysis over time to account for autocorrelation in time. In both cases, contrasts were used to test specific differences. The auto-correlation structure for the timeseries data was treated as a first-order autoregressive process in Proc MIXED.
RESULTS The near-continuous real-time soil water measures reported here represent the most evident soil and crop management effects on the fate of rainfall in terms of cumulative storage (infiltration), net storage, drainage, and crop uptake. Sample observations of soil profile water dynamics around a 41-mm sprinkler irrigation event under full corn canopy, are shown in Fig. 4 for the two tillage treatments (PT and NT) at an in-row position (MCP positions in Fig. 3). The initial soil water content was commonly lower under PT than NT, as observed here. In this sample, infiltrating water penetrated to the third sensor depth more quickly under NT than PT, with a total cumulative storage (infiltration) across the top three sensor depths (5–35 cm) of 29.6 mm for PT and 38.2 mm for NT. A view of tillage impacts on soil water dynamics across seasons at a nontraffic interrow position is shown in Fig. 5. The apparent field capacity was estimated by drawing a horizontal line at soil water contents shortly after spring rainfalls, near the apparent end of gravitational water flow and when the corn plants were small. The range of readily available water for plant uptake is the difference between the apparent field capacity and the transition from rapid to slow rates of decreasing water content (Starr and Paltineanu, 1998). Although it is somewhat difficult to see at this plotting scale, the transition zone occurs near the region of the rectangular box drawn at Day of Year (DOY) 233 in 1995 (Fig. 5). Even though NT had the greater apparent field capacity, probably due to higher soil density (Starr et al., 1995), this figure suggests that PT had a greater reservoir of plant-available water. The means of initial water storage before rain events were significantly greater for NT than for PT for both seasons (Table 2). Differences between tillage means increased from 17.7 mm for the Recharge Season to 24.7 mm for the high ET season. This progression, also apparent in Fig. 5, reflects the increasing ET as the seasons progressed from the recharge season through the high ET season. When the soil was quite dry, there
Fig. 6. Cumulative soil water storage vs. rainfall, by (a) no tillage (NT) vs. plow tillage (PT) and (b) recharge vs. high evapotranspiration (ET) season.
was often a smaller response to rainfall events under PT than NT; compare for example the water accumulation under PT and NT in response to the rain event on DOY 241 in 1995 (Fig. 5). Variability in the calculated water parameters was quite high, as illustrated by the cumulative water storage distributions in relation to cumulative rainfall by tillage (Fig. 6a) and by season (Fig. 6b). Data distributions about the 1:1 line appear very similar for the two data displays. All linear regression lines fell below the 1:1 line, although PT (Fig. 6a) and the high ET season (Fig. 6b) regression lines approached the 1:1 line at the higher rainfall amounts. A tillage effect on cumulative storage is more apparent in the plot of tillage differences shown in Fig. 7. Each value in this figure represents a difference between mean cumulative storage values, NT minus PT. The variability in tillage differences increased with increasing rainfall (Fig. 7a) up to the median rainfall, and then remained quite large across the high rainfall group (⬎17 mm). Some of the change in the NT ⫺ PT values with increasing rainfall may be associated with summer rainfalls when thunderstorms were prevalent and their tendency for higher rainfall intensity (Fig. 7b). Note that all the rainfall intensities ⬎8 mm h⫺1 occurred in the high ET season. Compare this with Fig. 1b, which shows only four recharge season rainfalls had rainfall intensities greater than the median high ET season intensity.
931
Reproduced from Vadose Zone Journal. Published by Soil Science Society of America. All copyrights reserved.
www.vadosezonejournal.org
Fig. 7. Tillage differences in cumulative storage [no tillage (NT) ⫺ plow tillage (PT)] vs. (a) rainfall amount and (b) rainfall intensity. Each value in the plot represents a difference between mean cumulative storage values for a tillage treatment.
Main Tillage Effects Main tillage effects on cumulative water storage (infiltration), net water storage, and drainage below 55 cm are shown in Table 3. Rank differences were used to assess statistical differences on these nonnormally distributed data. Since it is difficult to interpret differences Table 3. Median cumulative water storage (infiltration), net storage, and drainage in shallow soil profile (5–55 cm) for a rain event in relation to season, rain amount, and tillage from June 1995 through December 1997.
Water† Cumulative storage Net storage Drainage
Season‡ recharge high ET recharge high ET recharge high ET
Rain amount ⱕ17 mm
Rain amount ⬎17 mm
PT§
PT
NT
23.9a 31.3 10.9a 9.1 10.6a 16.9a
12.9b 23.4b 7.4b 8.0b 5.6b 12.0b
6.1a¶ 1.5a 2.8a ⫺0.9 2.6a 3.3
NT mm 3.8b 2.0b 1.7b ⫺0.4 1.9b 3.3
† Water accounts: cumulative storage (summation of all increases in water content during a rainfall), net storage (difference between the final soil water content 24 h after rainfall ceases and initial soil water content), Drainage below 55 cm (summation of negative changes in soil profile water storage [mm] at the top four sensors). ‡ Recharge season: 8 Sept. 1995–30 Apr. 1996, 8 Sept. 1996–30 Apr. 1997, 10 Oct. 1997–31 Dec. 1997; high evapotranspiration (ET) season: 1 May– 7 Sept. 1995, 1 May–7 Sept. 1996, 1 May–10 Oct. 1997. § Tillage: NT ⫽ no tillage; PT ⫽ plow tillage. ¶ Values followed by the same lowercase letter within a row indicate significant differences between tillage treatments within a rainfall class (p ⫽ 0.05).
among ranks, medians were used to facilitate algebraic comparisons among the groupings for presentation purposes. Tillage effects were quite consistent for all three water parameters, with PT values being greater than NT for seven of the eight significantly different comparisons. The one exception was for the high ET low rainfall case, where the cumulative storage for PT was less than NT. This reflects the smaller response to rainfall events under PT, as noted above. All the differences for the recharge season were significant, but only one-third of the high ET comparisons were significantly different. Net storage, a measure of the water that remains in the soil profile (5–55 cm) 24 h after a rainfall event, was smaller than the cumulative storage due to drainage below 55 cm and/or to losses by ET (e.g., the day losses near DOY 242.5 in Fig. 4). These data (Table 3) indicate that the primary loss mechanism for the high rainfall group was by drainage below 55 cm. That is, cumulative storage minus net storage values were close to the drainage values, giving rise to the consistently greater net storage and drainage values for PT than for NT. Calculations for net storage are not very sensitive to steadystate effects since it was calculated as a simple difference between initial and final (after 24 h) soil water contents. The differences between tillage treatments for net storage are consistent with relative differences in water contents shown in Fig. 5. The infiltrated water (quantified as cumulative storage) should be about the same for both NT and PT (runoff was rarely observed at this site). If this assumption is correct, then the cumulative storage for NT may have been closer to 24 mm during the recharge season for high rainfall, a difference of about 11 mm (Table 3). Since the NT net storage was 7.4 mm, this suggests that the actual drainage from the NT plots was about 17 mm, which is higher than for the PT plots.
Position Effects under Low Rainfall Row position effects in relation to tillage and season, as shown in Table 4, provide additional information regarding causes for the patterns observed in Table 3 and Fig. 6 and 7. Many of the overall tillage differences were not significantly different at the position subgroup level, especially for the low rainfall group when averaged across positions (Table 3). When there were significant tillage effects in this low rainfall group (Table 4, uppercase letters), the differences occurred at one or two of the three positions within a season. For example, in the high ET season for the low rainfall group, cumulative storage and drainage had a significant tillage effect (NT ⬎ PT) at the row position (Table 4), but were not different at the two interrow positions. In both water parameter cases, the within tillage analysis (lowercase letters) showed the NT row position to be significantly greater than either interrow position, but for PT the three positions were statistically the same.
Position Effects under High Rainfall Plow tillage had significantly greater water parameter values than NT at all three row and interrow positions
932
VADOSE ZONE J., VOL. 3, AUGUST 2004
Table 4. Median cumulative water storage (infiltration), net storage, and drainage in shallow soil profile (5–55 cm) in relation to cumulative rainfall, tillage, and row position from June 1995 through December 1997. Values are medians within rainfall classes (amounts). Rain amount ⱕ17 mm Water†
Season‡
Tillage§
Interrow
Row
Rain amount ⬎17 mm
Traffic interrow
Interrow
Row
Traffic interrow
12.9abA¶ 25.3aB 22.8a 35.4 7.5abA 12.7B 5.3 9.6 6.0aA 12.6aB 10.3a 19.4
16.3bA# 26.5aB 33.0a 26.9 8.4aA 11.2B 10.8 7.6 7.1aA 13.1aB 16.7b 15.6
12.2aA 18.3bB 15.6bA 32.2B 5.7bA 9.3B 5.8 9.3 3.1bA 7.5bB 9.1aA 16.8B
mm
Reproduced from Vadose Zone Journal. Published by Soil Science Society of America. All copyrights reserved.
Cumulative storage
recharge high ET
Net storage
recharge high ET
Drainage
recharge high ET
NT PT NT PT NT PT NT PT NT PT NT PT
3.6 5.3 1.5a 1.2 2.0 3.6 ⫺0.9 ⫺1.5 1.6A 3.8aB 2.9a 3.3
4.6 5.9 4.4bA 1.4B 1.5 2.8 0.0 ⫺0.8 2.1 2.1b 5.1bA 2.9B
3.5 6.3 1.5a 1.7 1.7 2.5 ⫺0.4 ⫺1.0 1.9A 2.8aB 3.0a 4.2
† Water accounts: cumulative storage (summation of all increases in water content during a rainfall), net storage (difference between the final soil water content 24 hours after rainfall ceases and initial soil water content), drainage below 55 cm (summation of negative changes in soil profile water storage (mm) at the top four sensors). ‡ Recharge season: 8 Sept. 1995–30 Apr. 1996, 8 Sept. 1996–30 Apr. 1997, 10 Oct. 1997–31 Dec. 1997; high evapotranspiration (ET) season: 1 May– 7 Sept. 1995, 1 May–7 Sept. 1996, 1 May–10 Oct. 1997. § Tillage: NT ⫽ no tillage; PT ⫽ plow tillage. ¶ Values followed by the same lowercase letter within a row indicate significant differences for comparisons among row positions within a tillage treatment and rainfall class (p ⫽ 0.05). # Values followed by the same uppercase letter within a column indicate significant differences for comparisons between tillage treatments within season, rainfall class, and row position (p ⫽ 0.05).
during the recharge season under high rainfall (Table 4, uppercase letters). In contrast, in the high ET season for this rainfall group, the only significant tillage by position effect was found at the traffic interrow position, where the cumulative storage and drainage for PT were both greater than the NT values. Five of six recharge season water parameter values were significantly smaller (lowercase letters) at the traffic interrow position than at either the row or non traffic interrow positions for both tillage treatments. Similar NT results are shown for the high ET season for cumulative storage and drainage.
slopes. At the beginning of the high uptake rate stage, the soil profile (5–55 cm) water content averaged 30 mm for NT and 38 mm for PT greater than at the transition to the low uptake rate stage. The water uptake rates at the beginning of the high uptake stage were ⫺3.37 mm d⫺1 for NT and ⫺4.32 for PT. Toward the end of the high uptake-rate stage, as water content decreased, water uptake rates also decreased, and water uptake transitioned to a low uptake stage. The water uptake rates for this stage were ⫺2.39 mm d⫺1 for NT and ⫺2.91 for PT. Differences between initial (high) and final (low) water uptake rates were not significant across all positions for both tillage treatments, but the differences were much greater for PT than NT (i.e., ⫺1.41 vs. ⫺0.98 mm d⫺1). In this example the initial uptake rate for NT was 0.98 mm d⫺1 greater during the first 5 d of the drying period than at the end of the drying period. The signs of the differences between high and low uptake rates varied by position. The differences between the slopes were negative for the row and traffic interrow positions but positive for the interrow position. The positive differences were not significantly different from zero, which suggests that the interrow position continued to supply water to the plants at about the same rate for both periods in both NT and PT treatments. The water uptake rates in the row positions significantly decreased in both row
Water Uptake Management effects on water uptake varied with available water content. Previous graphical analysis of dry-down events from this site showed distinct transitions between time periods of relatively high water uptake rates and lower water uptake rates (Starr and Paltineanu, 1998). The two water uptake rates can be seen in Fig. 5, just before and after DOY 233 (1995). Timlin et al. (2001) observed similar behavior in soybean [Glycine max (L.) Merr.]. Differences in water uptake rates (initial minus final slopes) as a function of management practice are shown in Table 5. Note that the negative sign results from taking the difference of two negative
Table 5. Difference in water uptake rates between the beginning and end of summer dry-down periods between rainfall events. NT† Comparison
PT
Row position
Mean
SEM‡
Probability level
all row positions row interrow traffic interrow
⫺0.98 ⫺2.29 1.48 ⫺2.12
0.526 0.792 1.130 0.792
0.063 0.004 0.184 0.007
Mean
SEM
Probability level
⫺1.41 ⫺4.44 1.29 ⫺1.07
0.526 0.792 1.130 0.792
0.007 0.000 0.24 0.177
mm d⫺1 Initial slope minus final slope
† Tillage: NT ⫽ no tillage; PT ⫽ plow tillage. ‡ Standard error of the mean.
933
www.vadosezonejournal.org
Table 6. Difference in water uptake rates between tillage treatments and row positions near the start and the end of soil dry-down periods between rainfall events in the summer. Initial Comparison
Final
Tillage†
Mean
SEM‡
Probability level
NT NT NT PT PT PT
0.95 ⫺1.81 ⫺0.98 0.83 ⫺3.02 ⫺1.46 1.56
0.504 0.926 0.759 0.926 0.926 0.759 0.926
0.060 0.0511 0.1990 0.3686 0.0011 0.0541 0.0922
Mean
SEM
Probability level
0.52 1.96 ⫺0.80 ⫺2.77 2.72 1.91 ⫺0.80
0.541 1.004 0.823 1.004 1.004 0.823 1.004
0.340 0.0509 0.3300 0.0060 0.0070 0.0203 0.4247
Reproduced from Vadose Zone Journal. Published by Soil Science Society of America. All copyrights reserved.
mm d⫺1 Difference (NT ⫺ PT) Row–interrow Row–traffic interrow Interrow–traffic interrow Row–interrow Row–traffic interrow Interrow–traffic interrow
† Tillage: NT ⫽ no tillage; PT ⫽ plow tillage. ‡ Standard error of the mean.
positions, indicating a smaller contribution to water uptake from the row positions in the later stages of soil drying. The differences for the traffic interrow position were only significant in the NT treatment. The differences were more negative for PT than for NT, indicating a larger decline in soil water uptake rates over the drying cycle for PT than for NT. These data suggest that as soil water content decreased, water uptake fell off more rapidly in the row position than in the interrow positions, especially for PT. The initial water uptake rates in the row position were approximately ⫺4.1 mm d⫺1 for NT and ⫺5.8 for PT. The later uptake rates were ⫺2.0 mm d⫺1 for NT and ⫺1.4 for PT. The larger difference for PT contributed to the higher significance level for the difference between the initial and final slopes. Changes in the water uptake rates during initial (fast) and final (slow) stages for various tillage and position combinations are shown in Table 6. Across all positions, the water uptake rate in PT was barely significantly greater than in NT (by 0.95 mm d⫺1, p ⫽ 0.060) during the initial uptake stage when available water was high. In contrast, during the final (slow) stage, uptake from PT was still greater than NT (by 0.37 mm d⫺1), but the difference was not significant. Water uptake rates for the row position in both tillage treatments were significantly greater than uptake for interrow position during the initial high rate stage (probability level varied from p ⫽ 0.051 to p ⬍ 0.01, Table 6). But, at the end of the draw-down period, during the second stage, the uptake rates from the interrow positions were significantly higher than from the row positions for both tillage treatments (probability level varies from p ⫽ 0.051 to p ⬍ 0.01). In fact, the uptake rates from the interrow positions may have increased slightly in the second stage of draw-down, but the increase is not significantly different from zero. These results suggest that because of the initially higher uptake rates in the row positions, the soil water in the row position was depleted more rapidly than in the other two positions. The plant then began to draw more heavily on the available water in the interrow position. Note that in Table 5, the uptake rate fell off more in the row positions than in either of the interrow positions. The row position for NT was advantageous for plant water uptake compared with the two NT interrow positions. These differences were greater among PT row positions than among NT positions (Table 6).
DISCUSSION Tillage had a major impact on the initial water content, with initial NT water contents being consistently and significantly higher than the PT plots. This difference between NT and PT treatments was also reported by Fuentes et al. (2003) for their Palouse silt-loam soils. The higher initial water content for NT is likely due to the higher bulk density of NT compared with PT soils (Hill, 1990; Starr et al., 1995), and to surface residues reducing soil surface evaporation in NT. The largest tillage differences and highest variability (e.g., Cumulative Storage, Fig. 7a) were associated with the higher rainfalls in the high ET season when (i) surface evaporation losses in PT would be greater than in NT because of the surface residue effects in NT, and (ii) summer thunderstorms and their associated greater rainfall intensities were more prevalent (Fig. 1b, Table 1). Seasonally different patterns might be expected since both rainfall amounts and intensities for the two seasons were different (Fig. 1b). Antecedent water contents were always higher in NT plots than in PT plots, which suggests that water content dynamics between NT and PT will be different from the start. Because PT is drier than NT, a difference accentuated in the high ET season (Fig. 5), water may not penetrate as deeply in PT soils as in NT soils. This may result in a smaller response for PT than NT, especially if the water doesn’t penetrate past the 5-cm depth where the 10-cm sensor is sensitive to water content (compare initial water contents by soil depth at an inrow position in Fig. 4). This would be most evident during low-rainfall events, so would not be a consistent trend in all events. Note that in Table 3, the only time PT values of cumulative storage were significantly less than NT was under low rainfall and high ET. High initial antecedent water contents coupled with high rainfall during the recharge season are associated with higher cumulative storage, net storage and drainage in PT plots. These results are likely due to the tillage effect on the initial soil water content (Table 2) resulting in more storage space available in the PT soil, and conversely, the NT soil being closer to its maximal water content and thus approaching steady-state water-flow conditions. Under such near steady-state conditions, as water infiltrates into the soil it simultaneously drains from the profile. As a result, the values and significant
Reproduced from Vadose Zone Journal. Published by Soil Science Society of America. All copyrights reserved.
934
VADOSE ZONE J., VOL. 3, AUGUST 2004
drainage difference for the high rainfall group may be somewhat misleading due to quasi-steady-state nearsaturated soil conditions in the recharge season (Fig. 5), so that not all the drainage may have been captured. Under near steady-state conditions, even with near-continuous water content measurements, large water content differences cannot be shown (Timlin et al., 2001). It is likely that more water would be accounted for if matric potential data were available (Paramasivam et al., 2000). The lack of significant position differences for PT in the high ET season is consistent with the lack of significant differences for cumulative and net storage observed with Table 3. The only tillage effect here was the higher drainage at the traffic interrow position of PT than of NT. In both tillages this position had a concave surface where water was commonly observed to accumulate. The lower density under PT likely contributed to the greater drainage at this position. Ponded water was often observed at this NT position long after that at the corresponding PT position. The lack of significantly different row effects under PT (lowercase letters in Table 4) may be due to surface-sealing crust formation (a common observation at this field site) resulting in stemflow water being dispersed to the interrow positions. Position effects can be due to management or crop canopies. The smaller traffic interrow values are consistent with the higher soil density at this position and the associated lower hydraulic conductivity. In the high ET season, the corn canopy greatly impacts the distribution of rainfall to the soil surface (van Wesenbeeck and Kachanoski, 1988; Paltineanu and Starr, 2000). Even though the plant canopy and residual root and plant factors do affect water infiltration, localized excess infiltrated water (e.g., spatially redistributed water to plant stems) can drain rapidly and therefore did not provide a net storage advantage in the upper 55 cm of this soil. Since the NT drainage was greater than the cumulative storage for the row position, the calculated drainage probably included some ET losses for all three positions. The row differences also reflect greater water uptake in the NT row position, as seen in the water uptake data. There were also significant tillage and row position effects on plant water uptake for both water-stressed and nonstressed conditions. The higher rates in the row position during the initial non-water-limited stage of water uptake may be due to greater root density in this position (Anderson, 1987). Later the uptake rates decreased for the row position and increased in the interrow positions. This large decrease may be related to the higher initial water uptake rates in the row positions compared with the interrow positions. More water infiltration at the row position than in the interrow positions in NT (Table 4) can enhance the row position’s ability to supply water to the plant. An analysis was also performed using sensors to the 35-cm depth only (data not shown). The row and tillage differences were more strongly expressed and significance levels were higher. The interrow water uptake rates did not increase during the second stage of draw-down in the 5- to 35-cm depth. This suggests that the deeper soil layers contributed
significant amounts of water and masked position and tillage differences. This underscores the fact that tillage management has a greater effect on surface soil water phenomena. These results show that a significant proportion of summer rainwater can be diverted to the row position and infiltrate there, especially under NT. This water is then available for drainage, which has implications for solute transport. van Wesenbeeck and Kachanoski (1988) reported lower water contents in the row positions than in the interrow positions as a result of plant water uptake. Timlin et al. (1992) reported less leaching of a solute in the row position of a conventionally tilled corn plot under infrequent rainfall. The row position was generally drier than the interrow position. In the case of NT, with the increased infiltration and drainage in the row position, the potential for leaching of herbicides or fertilizers is increased, especially where rainfall is frequent.
SUMMARY AND CONCLUSIONS The soil water content data collected in this study describe a complex temporal process of infiltration, redistribution, drainage, and evaporation. The characteristics of rainfall, antecedent and current water content, presence of plants, and soil hydraulic properties all interact to create a unique time series of water content values that are different for every storm. This results in a wide range of highly dynamic potential soil water responses. For a particular location, however, the soil water content time series at different periods all share certain trends and characteristics. We attempted to capture these general trends and relate them to management practices through simple descriptive statistics grouped over management effects and time periods. While this is a useful attempt to capture the general trends, it cannot always provide an adequate interpretation of the water content time series resulting from a particular rainstorm’s unique characteristics and its interaction with a particular management practice. Comparisons of cumulative storage, net storage, or drainage among different management practices using overall gross average rainfall characteristics reflect the effects of an “average” rainfall event. This averaging can mask individual hydrologic responses associated with specific rainfall events. In any season there may be one or two events that have important implications for increasing soil water storage or drainage. These responses may be best characterized or detected by grouping rainfall by rainfall amounts or some other dynamic characteristic of the rainfall, rather than by total amounts and chronological periods, as was done here. Main tillage effects on the soil water parameters (cumulative and net storage and drainage) were most significant during the recharge season when all the water parameter values were less for NT than for PT. The smaller recharge season values in NT were attributed to the higher antecedent water contents plus the narrower range in water contents in the NT data as compared with the PT. We believe more water often infiltrated
935
Reproduced from Vadose Zone Journal. Published by Soil Science Society of America. All copyrights reserved.
www.vadosezonejournal.org
into the NT plots than was recorded by the sensors in the recharge season. Rainfalls on near-saturated soil results in water movement approaching steady-state conditions, with the potential for relatively large fluxes associated with small differences in water content. Therefore, cumulative storage and drainage under these conditions may have been underestimated for NT. Where there were significant differences among positions for the three water parameters, differences were generally due to higher values at the row position, and/ or to lower values at the traffic interrow position. Increased soil density at the traffic interrows is a primary causative factor for this result. Decaying brace roots and plant stems contribute to the macroporosity and therefore may have contributed to the higher row values in the recharge season. Depending on the soil cover and residues, stem-flow water intercepted by the plant canopy either spread out from the row position, as likely occurred in the case of PT where there was less macroporosity around the plant stems, or infiltrated around the base of the plant, as in the case of NT. Tillage and position effects were also seen in water uptake. Position effects dominated over tillage effects, especially during the high ET season, when the plant canopy captured rainwater and funneled it toward the row. This redistributed water in the case of NT provided a larger reservoir of plant-available water in the row position where water uptake was the greatest. When soil water was not limiting, water uptake from the row position of PT was greater than from the row position of NT. When water was limiting, water uptake was greater from NT than from PT, although the differences were smaller. This suggests that crops grown in NT may make better use of available water during drought years. Water uptake was greater from the row positions than from the interrow or traffic interrow positions when available water was not limiting. Water uptake from the interrow and traffic interrow positions were not significantly different from each other under PT. These results have implications for management of NT and PT silty loam soils in the humid Mid-Atlantic region of the USA. Differential water movement and plant water uptake in row and interrow positions can result in differences in fluxes in these positions, as well as different potentials for transport of chemicals and pesticides. Knowledge of how these processes act during a rainstorm can guide us to develop improved management practices in row crops. For example, given the general conditions for this study, during the high ET season (crops present), under NT management, rainfall is likely to move chemicals applied to the row position deeper into the profile. No tillage management is also likely to help extend the period plants can grow before experiencing severe water stress.
ACKNOWLEDGMENTS The authors are grateful to Peter Downey, technician at USDA-ARS, for invaluable field assistance and technical support. We are also grateful for helpful discussions provided by Tom Nicholson and Ralph Cady of the U.S. NRC.
REFERENCES Anderson, E.L. 1987. Corn root growth and distribution as influenced by tillage and nitrogen fertilization. Agron. J. 79:544–549. Fares, A., and A.K. Alva. 2000. Evaluation of capacitance probes for optimal irrigation of citrus through soil moisture monitoring in an entisol profile. Irrig. Sci. 19:57–64. Ferre´, P.A., and G.C. Topp. 2002. Time domain reflectometry. p. 434–446. In J.H. Dane and G.C. Topp (ed.) Methods of soil analysis. Part 4. SSSA Book Ser. 5. SSSA, Madison, WI. Fuentes, J.P., M. Flury, D. Huggins, and D. Bezdicek. 2003. Soil water and nitrogen dynamics in dryland cropping systems of Washington State, USA. Soil Tillage Res. 71:33–47. Hill, R.L. 1990. Long-term conventional and no-tillage effects on selected soil physical properties. Soil Sci. Soc. Am. J. 54:161–166. Mahmood-ul-Hassan, A., and P.J. Gregory. 2002. Dynamics of water movement on Chalkland. J. Hydrol. 257:27–41. Or, D., F.J. Leij, V. Snyder, and T.A. Ghezzehei. 2000. Stochastic model for posttillage soil pore space evolution. Water Resour. Res. 36:1641–1652. Or, D., and J.M. Wraith. 2002. Soil water content and water potential relationships. p. 49–84. In A.W. Warrick (ed.) Soil physics companion. CRC Press, Washington, DC. Paltineanu, I.C., and J.L. Starr. 1997. Real-time soil water dynamics using multisensor capacitance probes: Laboratory calibration. Soil Sci. Soc. Am. J. 61:1576–1585. Paltineanu, I.C., and J.L. Starr. 2000. Preferential water flow through corn canopy and soil water dynamics across rows. Soil Sci. Soc. Am. J. 64:44–54. Paramasivam, S., A.K. Alva, and A. Fares. 2000. An evaluation of soil water status using tensiometers in a sandy soil profile under citrus production. Soil Sci. 165:343–353. Parkin, G.W., R.G. Kachanoski, D.E. Elrick, and R.G. Gibson. 1995. Unsaturated hydraulic conductivity measured by time-domain reflectometry under a rainfall simulator. Wat. Resour. Res. 31:447– 454. SAS Institute. 1999. SAS OnlineDoc. Version 8. SAS Inst. Inc., Cary, NC. Snyder, V.A., J. Rivadeneira, and H.M. Lugo. 2000. Temporal changes in soil structure and hydraulic properties in the plow layer of an Oxisol (Orthic Ferralsol) following tillage. Adv. Geoecol. 32:314– 324. Starr, J.L., and I.C. Paltineanu. 1998. Soil water dynamics using multisensor capacitance probes in non-traffic interrows of plowand no-till corn. Soil Sci. Soc. Am. J. 62:114–122. Starr, J.L., and I.C. Paltineanu. 2002. Capacitance devices. p. 463–474. In J.H. Dane and G.C. Topp (ed.) Methods of soil analysis. Part 4. SSSA Book Ser. 5. SSSA, Madison, WI. Starr, J.L., I.C. Paltineanu, and D.J. Timlin. 1995. Temporal in situ changes of soil properties as affected by tillage, position and plants. p. 139–140. In Kearney Found. Int. Conf. Proc., Davis, CA. Sept. 1995. Kearney Found. of Soil Sci., Davis, CA. Timlin, D.J., G.C. Heathman, and L.R. Ahuja. 1992. Solute leaching in crop row vs. interrow zones. Soil Sci. Soc. Am. J. 56:384–392. Timlin, D.J., Y. Pachepsky, and V.R. Reddy. 2001. Soil water dynamics in row and interrow positions in soybean (Glycine max L.). Plant Soil 237:25–35. van Wesenbeeck, I., and R.G. Kachanoski. 1988. Spatial and temporal distribution of soil water in the tilled layer under a corn crop. Soil Sci. Soc. Am. J. 52:363–368.