International Journal of Innovation, Management and Technology, Vol. 4, No. 1, February 2013
Using LCR Ultrasonic Method to Evaluate Residual Stress in Dissimilar Welded Pipes Yashar Javadi, Vagelis Plevris, and Mehdi Ahmadi Najafabadi Abstract—The ultrasonic residual stresses measurement is based on the acoustoelastic effect that refers to the change in velocity of the elastic waves when propagating in a stressed media. The experimental method using the longitudinal critically refracted (LCR) waves requires an acoustoelastic calibration and an accuracy measurement of the time-of-flight on both stressed and unstressed media. This paper evaluates welding residual stresses in dissimilar pipe-pipe joint of AISI stainless steel 304 and Carbon Steel A106-B type. The residual stresses in inner and outer surface of pipes were evaluated by LCR ultrasonic waves by using 1Mhz, 2Mhz, 4Mhz and 5Mhz transducers. It has been shown that the difference in residual stresses between inner and outer surfaces of pipes and also between Stainless steel and Carbon Steel side can be inspected by LCR waves. Index Terms—Ultrasonic stress Measurement, acoustoelastic effect, welding residual stress, LCR, dissimilar welded joint.
I. INTRODUCTION Residual stresses are present in materials without any external pressure, and normally result from deformation heterogeneities appearing in the material. They have very important role in the strength and service life of structures. Welding is an assembly process often used in different industries, especially in the pressure vessel industry. According to the process and temperatures reached during this operation, dangerous thermo-mechanical stresses may appear in the welded joint. To achieve a proper design of structure and control their mechanical strength in service, it is very important to determine the residual stress levels with a non-destructive method. The high industry request for the stress measurement techniques encouraged development of several methods like X-ray diffraction, incremental hole drilling, and the ultrasonic waves methods. Many studies showed that there is no universal or absolute method that gives complete satisfaction in the non-destructive stress monitoring of the mechanical components. Many parameters such as material, geometry, surface quality, cost, and accuracy of the measurement, etc., must be taken into account in choosing an adequate technique. The ultrasonic technique was selected for stress measurement because it is non-destructive, easy to use, and relatively inexpensive. However, it is slightly sensitive to the
microstructure effects (grains size [1] , carbon rate [2] , texture [3] , and structure [4] ) and to the operating conditions (temperature [5] , coupling [6] , etc.). The ultrasonic estimation of the residual stresses requires separation between the microstructure and the acoustoelastic effects.
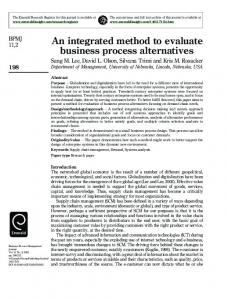
II. THEORETICAL BACKGROUND Within the elastic limit, the ultrasonic stress evaluating technique relies on a linear relationship between the stress and the travel time change, i.e. the acoustoelastic effect [7] . The LCR technique uses a special longitudinal bulk wave mode, as shown in Fig. 1, which travels parallel to the surface, particularly propagating beneath the surface at a certain depth. The LCR waves are also called surface skimming longitudinal waves (SSLW) by some of the authors. Brekhovskii [8] , Basatskaya and Ermolov [9] , Junghans and Bray [10] , Langenberg et al. [11] had some detailed discussions on the characteristics of the LCR.
Fig. 1. LCR probe for PMMA (plexiglas) wedge on steel [12]
Ultrasonic stress measurement techniques are based on the relationship of wave speed in different directions with stress. The relations can be summarized to give the stress variation in terms time-of-flight (dt/t0), as shown in the Eq. (1), where t0 is the time for the wave to go through a stress free path in the material being investigated. d
(1)
In Eq. (1) dσ is the stress variation (MPa) and E is the elasticity modulus (MPa). For a fixed probe distance, the travel time of the longitudinal wave decreases in a compressive stress field and increases in a tensile field. The acoustoelastic constant (L) functionally links the stress and
Manuscript received September 10, 2012; revised November 21, 2012. Yashar Javadi is with Islamic Azad University-Semnan Branch, Semnan, Iran. (e-mail:
[email protected]). Vagelis Plevris is with Department of Civil and Structural Engineering Educators, ASPETE, Athens, Greece. Mehdi Ahmadi Najafabadi is with Department of Mechanical Engineering, Amirkabir University of Technology, Tehran, Iran.
DOI: 10.7763/IJIMT.2013.V4.384
E (dV11 / V11 ) E dt L11 L11t0
170
International Journal of Innovation, Management and Technology, Vol. 4, No. 1, February 2013
measured. The setup which is shown in Fig. 3 is used here to measure the depth of the LCR wave. Two transducers as sender and receiver with the same frequency are used to produce LCR wave. A slot is performed between the transducers by milling tool to cut the LCR wave. The depth of the slot is increased step by step and the amplitude of the LCR wave is measured in each step. When the amplitude of the LCR wave is equal to the noise, milling process is stopped and the depth of slot is announced as the depth of the LCR waves for the tested frequency. The results of this measurement show that depth of LCR wave is 5mm, 2mm, 1.5mm and 1mm for transducer with nominal frequencies of 1Mhz, 2Mhz, 4Mhz and 5Mhz respectively.
the velocity or travel time change. III. EXPERIMENTAL PROCEDURES A. Sample Description The materials tested (stainless steel 304 and carbon steel A106-B) are commonly used for pressure vessel applications. Two 8inch pipes with thickness of 8mm were welded in V-groove (60° included angle) and three passes butt-weld joint. Two rectangular tension test specimens were extracted from two different stainless steel and carbon steel plates with the same chemical composition and thickness of two pipes to determine acoustoelastic constant. B. Measurement Setup The measurement device, shown in Fig. 2 , includes an Ultrasonic box with integrated pulser and receiver, computer and three normal transducers assembled on a united wedge. A three-probe arrangement was used, with one sender and two receivers in order to eliminate environment temperature effect to the travel time. Twelve transducers in four different frequencies were used which their nominal frequencies were 1Mhz, 2Mhz, 4Mhz and 5Mhz. Using different frequencies helps to evaluate residual stresses through the thickness of the pipes. The diameter of all the piezoelectric elements were 6 mm. Transducers were assembled on a united PMMA wedge. The ultrasonic box is a 100Mhz ultrasonic testing device which has a synchronization between the pulser signal and the internal clock, that controls the A/D converter. This allows very precise measurements of the time of flight – better than 1ns.
Fig. 3. Experimental setup to measure depth of LCR wave
D. Evaluation of the Calibration Constants To evaluate the calibration constants (acoustoelastic constant, free stress time-of-flight), two different calibration samples were prepared. The first sample was taken from a stainless steel 304 plate with exactly the same thickness and chemical composition of stainless steel side of the pipes. The second one was extracted from a carbon steel A106-B plate with the same thickness and chemical composition of carbon steel side of the pipes. To evaluate the residual stress from Eq.(1), the value t0 is measured directly from the stress-free samples and the acoustoelastic constant is deduced experimentally from a uniaxial tensile test associated with an ultrasonic measurement (Fig. 4 ). Acoustoelastic constant represents the slope of the relative variation curve of the time-of-flight and the applied stress. (as shown in Fig . 5 and Fig. 6)
IV. RESULTS AND DISCUSSION
Fig. 2. Measurement Setup
C. Determination of LCR Depth When the LCR technique is applied to an application with limited wall thickness, the depth of the LCR wave penetration is expected to be somehow a function of frequency, with the low frequencies penetrating deeper than the high frequencies. Four different frequencies have been used in this work to evaluate the residual stress through the thickness of the pipes. Therefore depth of any frequencies should be exactly
In this study, the ultrasonic measurement concerns the residual stresses through the thickness of dissimilar welded pipes. The measurements were parallel to the weld axis therefore the hoop residual stress of pipes is evaluated. The values of the residual stresses relating to each weld zone were calculated from the equation (1) and the results are shown in Fig . 7-Fig . . 10 The characteristics of welding residual stress distribution in the pipe are very complex especially for hoop stresses. The hoop residual stresses distribution which is shown in Fig.11- 12 and has been extracted from D. Deng [13] is more popular in the references. Fig.11 shows that, on the inside surface, tensile hoop stresses are generated at the weld zone and its vicinity, and compressive stresses are produced away from the weld centerline[13]. But Fig. 12 shows the distribution of the hoop stress on the outside surface is very complex. [13] From the simulation and experiment results of D. Deng [13] , it can be 171
International Journal of Innovation, Management and Technology, Vol. 4, No. 1, February 2013
found that the shape is “like a wave and very sensitive to the distance from the weld centerline”.[13] Comparing Fig.11and Fig.12 with residual stress results of this paper, shows reasonable agreement. It can be noticed that the results of 1Mhz measurement (which is done in 5mm from the surface) is similar to the average of the inside and outside surfaces of the pipes especially more close to the inside surface distribution. Because, the thickness of the pipes is 8mm and 1Mhz LCR wave travels more near to the inside surface. Also, it is obvious from Fig. 8- Fig. 10 that with increasing the frequency (so decreasing the distance from the surface) residual stress distribution becomes more similar to the hoop stress distribution on the outside surface of the pipes. Also it can be concluded from Fig.7-Fig.10 that peakof the residual stress in stainless steel side is higher than carbon steel side because of higher yields stress in stainless steel.
Fig. 7. Ultrasonic stress measurement results by 1Mhz LCR wave
Fig. 8. Ultrasonic stress measurement results by 2Mhz LCR wave
Fig. 4. Tensile test to evaluate acoustoelastic constant (L11) Fig. 9. Ultrasonic stress measurement results by 4Mhz LCR wave
Fig. 5. Result of Tensile test on CARBON steel sample
Fig. 10. Ultrasonic stress measurement results by 5Mhz LCR wave
The other difference between residual stresses of two dissimilar pipes is in residual stress distribution in the points far away from weld centerline. That is because of difference in the thermal conductivity constant between stainless steel and carbon steel. Of course this difference considerably increases by higher frequencies of transducers. To better compare this difference, all of the frequencies are shown in Fig .13.Generally, higher thermal conductivity of carbon steel
Fig. 6. Result of Tensile test on stainless steel sample
172
International Journal of Innovation, Management and Technology, Vol. 4, No. 1, February 2013
causes tensile stress in this zone and compressive stress for the stainless steel side. This behavior can be observed in Fig.7 but, about the other frequencies there is compressive stress in the carbon steel side too, which is probably due to the complex distribution of outside hoop stresses.
stresses through the thickness of the stainless steel pipes.
Fig. 14. Residual stress on the weld centreline
V. CONCLUSION This paper confirms the potential of the ultrasonic residual stress measurement in inspecting the welding residual stresses through the thickness of the dissimilar steel pipes. The results of this paper show that: 1) The hoop residual stress of the pipes is very complex and very sensitive to the distance from the weld centerline on the outside surface of the pipes. 2) With increasing the frequency (so decreasing the distance from the surface) residual stress distribution becomes more similar to the hoop stress distribution on the outside surface of the pipes. 3) The peak of residual stress in stainless steel side is higher than carbon steel side because of higher yields stress in stainless steel. 4) Ultrasonic is capable of measuring the difference between residual stresses of two dissimilar pipes in the points far away from weld centerline. Of course this difference considerably increases by higher frequencies of transducers. 5) The tensile stress of weld centerline decreases with increasing the frequency. 6) Residual stress near the outer surface (higher frequencies) is more sensitive to the distance from the weld centerline.
Fig. 11. Hoop stress distribution on the inside surface of pipes [13]
Fig. 12. Hoop stress distribution on the outside surface of pipes [13]
REFERENCES [1]
[2]
[3] Fig. 13. Ultrasonic stress measurement results
[4]
Residual stress exactly on the weld centerline is shown in Fig.14. It can be noticed that tensile stress of weld centerline decreases with increasing the frequency. Also, it is obvious from this figure that residual stress near the outer surface (higher frequencies) is more sensitive to the distance from the weld centerline. Therefore the ultrasonic residual stress measurement used in this paper, is capable of inspecting the welding residual 173
[5]
[6]
[7] [8]
R. Herzer and E. Schneider, “Instrument for the automated ultrasonic time-of-flight measurement a tool for materials characterization,” Springer, pp. 673–680, 1989. C. Hakan Gür and B. Orkun Tuncer, “Nondestructive investigation of the effect of quenching and tempering on medium-carbon low alloy steels,” Int J Microstruct Mater Prop, vol. 1, pp. 51–60, 2005. C. M. Sayers, “Ultrasonic velocities in anisotropic polycrystalline aggregates,” J Phys D Appl Phys, vol. 15, pp. 2157–2167, 1982. JH. Cantrell and K. Salama, “Acoustoelastic characterization of materials,” Int Mater Rev, vol. 36, pp. 125–145, 1991. H. Mohbacher, E. Schneider, and K. Goebbels, “Temperature dependence of third-order elastic constants,” in Proc. 9th international conference on experimental mechanics, vol. 3, pp. 1189–1197, 1990. A. Lhémery, P. Calmon, S. Chatillon, and N. Gengembre, “Modeling of ultrasonic fields radiated by contact transducer in a component of irregular surface,” Ultrasonics, vol. 40, pp. 231–236, 2002. D. E. Bray and R. K. Stanley, Nondestructive Evaluation, CRC Press, Boca Raton, FL revised edition, 1997. L. M. Brekhovskii, Waves in Layered Media, Academic Press, vol. 1, 1960.
International Journal of Innovation, Management and Technology, Vol. 4, No. 1, February 2013 [9] [10] [11]
[12]
[13]
Dr. Evangelos (Vagelis) Plevris is a Professional Civil Engineer and Economist. He has been elected Assistant Professor in "Earthquake Engineering" (2010) at the Department of Civil and Structural Engineering Educators, School of Pedagogical & Technological Education (ASPETE), Athens, Greece where he currently teaches. His full C.V. is also available in http://www.vplevris.com.
L. V. Basatskaya and I. N. Ermolov, “Theoretical study of ultrasonic longitudinal subsurface waves in solid media,” 1980. P. Junghans and D. E. Bray, “Beam characteristics of high angle longitudinal wave probes,” In: R.N. Pangbom, 1991. K. J. Langenberg, P. Fellenger and R. Marklein, “On the nature of the so-called subsurface longitudinal wave and/or the surface longitudinal creeping wave,” Res. Nondest. Eval., vol. 2, pp. 59–81, 1990. D. E. Bray and W. Tang, “Evaluation of Stress Gradients in Steel Plates and Bars with the LCR Ultrasonic Wave,” Nuclear Engineering and Design, vol. 207, pp. 231-240, 2001. D. Deng and H. Murakawa, “Numerical simulation of temperature field and residual stress in multi-pass welds in stainless steel pipe and comparison with experimental measurements,” Computational Materials Science, 2005.
Dr. Mehdi Ahmadi Najafabadi is an associate professor in Amirkabir University of Technology-Tehran, Iran. He is the head of NDT section in mechanical engineering faculty where he is also teaching courses related to manufacturing engineering. His full C.V. is also available in http://me.aut.ac.ir/Ahmadi.htm.
Yashar Javadi is worked as a faculty member in Islamic Azad University-Semnan Branch in Iran. He was born in Iran-Mashhad on Sep. 1981. He has Msc. in Mechanical Engineering-Manufacturing from Amirkabir University of Technology-Tehran. He also is a PhD. candidate (last year) in that university.
174