L E U K O S
V O L
4
N O
1
J U L Y
2 0 0 7
P A G E S
7 1 – 8 2
Using Multimedia Interactive E-teaching in Color Science Cecilia Sik La´nyi, PhD, Zsolt Kosztya´n, PhD, Bala´zs Kra´nicz, PhD, Ja´nos Schanda, PhD, DrS, and Mojtaba Navvab, PhD, FIES
Abstract—Color is becoming a key issue in many e-commerce products. This made it necessary to develop a color course easily accessible from the Internet or distributed on CD-ROM. This article describes the advantages of the electronic approach – compared to class-room demonstrations – to bring the fundamentals of colorimetry to the student with the help of demonstrations. Keywords— colorimetry, long distance teaching, color demonstration. 1 INTRODUCTION
T
he electronic transmission of images became commonplace in the recent past. It is used not only by the graphic arts community, but also by the general public. E-commerce uses catalogues, brochures and other electronic pamphlet material, where high quality pictures have to be transmitted. The colorimetrically untrained recipient of such material is of the opinion that as he or she is now accustomed that the text and layout of the document complies with the WYSIWYG (What You See Is What You Get) principle. This is true also for the photo realistic images. We know too well that this is not the case, despite the many standards and guidelines made available in the past (IEC 1999 –2006; ICC 2007). Color is a subject on which most of us have a personal opinion, as we all “see” colors. In the present article we will not discuss the question of color abnormal or deficient observers, often called color blind: there is a non-negligible percentage of the population who perceive colors differently from the majority (8 to 15 per cent, depending on how large their deviation from normal is, and depending also on the geographic location). Rather, we will concentrate on the majority of the population. In most developed countries there is some color education during the basic or elementary studies of the children, mainly as part of their drawing and painting classes. The subject color is mostly neglected in later general studies: the physics or chemistry teachers are of the opinion that color C S La´nyi, Z Kosztya´n, B Kra´nicz, J Schanda: University of Veszpre´m, Virtual Environment and Imaging Technologies Laboratory. M Navvab (Corresponding author): University of Michigan, Taubman College of Architecture and Urban Planning.
[email protected] © 2007 The Illuminating Engineering Society of North America doi: 10.1582/LEUKOS.2007.04.01.004
71
L E U K O S
V O L
4
N O
1
J U L Y
2 0 0 7
P A G E S
7 1 – 8 2
is a subjective phenomenon and does not fit into the curriculum of their discipline: in biology there is not enough time to deal with color perception and deal with its physiological principles, in arts classes only the subjective impression that colored objects will produce are discussed. It is not much better at the university level, where color is perhaps discussed as an emotional factor in arts studies, but very little is taught to teachers-to-be, to those who have to deal with color in their everyday life, such as electronic engineers, computer programmers, architects (except designers, where – however – the artistic, emotional part is almost the only part that gets proper treating). As the situation in other areas of light and lighting is not much better, the international learned society discussing all aspects of light and vision, the Commission Internationale de l’Eclairage (CIE) realized this discrepancy and has set up a Study Group to deal with educational problems (CIE 2007). One task of this group is to collect and make available material, written and electronic, on teaching different aspects of light and color. While trying to pull together such material, the authors realized that there are a number of objective difficulties. That is, why professors at universities and technical colleges do not like to deal with the subject (in the present article we will concentrate on technically oriented university courses): Teaching color is an interdisciplinary subject, it really needs the co-operation of a physiologist, a psychologist, teachers of physics, chemistry, electronics, computer science, architecture, and so on, not speaking of members of the arts faculties. Often the teachers of the different subjects have different jargon and find it difficult to understand the topic of the other. To be able to explain the phenomena of color to the students, many experiments are needed. One can hardly find a professor who has the time and devotion to set up tedious experiments showing color matching, additivity, metamerism, and so on. One needs a dedicated laboratory and lecture room space to be able to show such experiments, and the instrumentation needed cannot be properly adjusted in a few minutes. Main topics of colorimetry at the Engineering in Information Technology of University of Veszpre´m are: • The structure of the human retina, cones, rods, their spatial distribution, spectral sensitivity. • Color difference signals, antagonistic signal channels, achromatic channel. • Types and reasons of color deficiency. Genetic reasons. • Basic experiment of color matching. Grassmann’s laws. • The CIE RGB and CIE XYZ color space. Color matching functions, tristimulus values. • The CIE-xy chromaticity diagram. Neutral point, excitation purity, dominant and complementary wavelength, purple line, spectral colors. • The CIE 1964 standard observer. • (Approximately) uniform color spaces. MacAdam ellipses. The CIE–u’v’ chromaticity diagram. Hue angle, saturation. • Planckian radiators, color temperature, correlated color temperature, distribution temperature. • Surface colors. • Standard illuminants. • Metamerism. • The CIELAB color space. • Fluorescence, mathematical description of fluorescent surfaces. 72
L E U K O S
V O L
4
N O
1
J U L Y
2 0 0 7
P A G E S
7 1 – 8 2
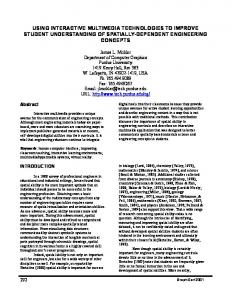
• Chromatic adaptation. The von Kries transformation. • The Munsell, NCS and Coloroid color systems. • Photo detectors: silicon photodiodes, avalanche photodiodes, phototransistosr, photocells, photomultipliers. • Visual photometers. • Luminance meters, illuminance meters, colorimeters. • Spectral fitting of photodetectors. The f 1⬘ norm. Design of filter packages. It is impossible to give a lecture about colorimetry at the blackboard and make the students fully understand colorimetric problems and color matching. It is our experience that, using demonstrative software, students gained enough skill to estimate the RGB content of any color stimulus. They liked playing with color effects and enjoyed using the software. It is obvious that spending some time with an appropriate demonstrative software one can better learn and experience colorimetry. The word ‘experience’ should be stressed because in this way a student can not only understand the laws and mathematical models of colorimetry but can immediately see how it works. On the other hand, instrument and equipment manufacturers find it necessary to educate their customers to some extent on the subject, so that they can understand how equipment functions or what an instrument determines. Naturally such education material can hardly be more then a demonstration and will – due to its very nature – try to convince the reader that the equipment will solve all their problems. One cannot expect that such material can substitute for a university course on color. Since multimedia technologies are now sufficiently developed, a growing number of colleges and universities are using computer technology to strengthen their classroom teaching-learning process. Various higher educational institutions have developed high-technology electronic multimedia classrooms and computer-related faculty training programs. Instructional computing is widely used for classroom multimedia digital media presentations and for interactive computer-based training (Lopategui 2007). According to Conelly (2007) if higher education does not manage to adapt to the new circumstances, many universities will miss out on this revolutionary new development. It is not only the duty of the universities themselves to use the potential of the new media for innovation and internationalization, it is also the responsibility of the government. Strong support for education policy is needed because of the expense involved in the design of multimedia and Internet-based courses. Far more incentives are needed for the design and implementation of new software in education. Most disciplinary areas in universities, including information system departments, are willingly, though sometimes blindly, jumping on the bandwagon by converting their traditionally taught courses into online courses. Their efforts are often guided by the myths that infiltrate the discourse on the topic. Given the potentially serious ramifications of information systems academics unreflectively enacting the myths related to online education, Sharker and Nicholson have argued for the need to critically examine the so-called truths being authoritatively set forth in much of the literature (Sarker and Nicholson 2005). They examined these myths in the context of online education in their own discipline: Information Systems. They intended in their paper to stimulate awareness and encourage debate regarding the pedagogical, administrative, economic, and societal implications of this novel though untested form of education as practiced in Information Systems as well as in related disciplines. 73
L E U K O S
V O L
4
N O
1
J U L Y
2 0 0 7
P A G E S
7 1 – 8 2
Koohang and Harman explored open source as a metaphor for e-learning (Koohang and Harman 2005). They built the case that e-learning and open source movement are rooted in the constructivist movement and the constructivist movement is itself rooted in the pragmatism and instrumentalism that pervades John Dewey’s theories of understanding as applied to learning. As a result, it is recommended that the use of open source as metaphor for e-learning be further explored in three areas: instructional practices, instructional platforms, and instructional philosophy. But as mentioned above, the number of persons who need better understanding of colorimetry is increasing, making it suitable for distance learning. This became realistic in the recent past, as the hardware and software available for such a course became available, and now we can show colorimetric demonstrations on the computer that were not possible only a couple of years ago. It is not easier to set up a colorimetric experiment on the computer then it is in the classroom, but it has to be done only once, and many students can not only see it, but can have hands-on demonstrations, can experiment, and learn by repeating the tests. In the following we will describe such a computer based color education system. It has been developed having students of computer science and informatics in mind, but it can be used in other technical fields as well (Schanda 2002a; Schanda 2002b). We even hope that with some further development it will be suitable for students of arts and design, as the subject is built up of such modules that enable to put the emphasis on different questions. The teaching has a general course, but using hypertext students can navigate through the e-book and look up questions, which are of their direct interest. First we will give an overview of the content of the e-book, then show some examples where the interactivity of computer based teaching can be used (by the nature of the subject this will be possible only in the life demonstration and the electronic version of the publication), followed by the discussion of the underlying computer science questions, and finally we will deal with how we see the use of e-teaching in light and color.
2 SUBJECTS COVERED IN THE E-BOOK ON COLORIMETRY The possibilities of the e-book permit establishing contact between students and the subject they have to study by making them curious about the question. Therefore the Introduction shows some color phenomena that have to be described, or where we would like to direct the attention of the student from the very beginning. We show here two examples which will make the subject more easily understood. The first example is the use of different foreground and background colors We have a perception that something of red color looks to be nearer to the observer then an object in blue, see Fig. 1. On the other hand if these two colors are used in a text to emphasize two different quantities, the effect of seeing red to advance to the observer and blue retarding, might be unpleasant and tiring, as is evident from Fig. 2. Another example is color contrast, a phenomenon very difficult to describe precisely without the knowledge of advanced colorimetry. The two round fields in the middle of the two squares in Fig. 3 have exactly the same radiometric (physical description) characteristics, but due to the differently colored surrounding they produce different color perceptions.
74
L E U K O S
V O L
4
N O
1
J U L Y
2 0 0 7
P A G E S
7 1 – 8 2
Fig. 1. Two squares in front of one another: it looks natural to see the red square before the blue one, one has to look at the picture carefully to see the opposite.
Fig. 2. Text using opponent colors (red and blue) to emphasize different quantities.
Fig. 3. The two round fields in the middle of the two squares have exactly the same radiometric (physical description) characteristics, but due to the differently colored surrounding they seem to have different colors.
The introduction shows many further examples of color contrast, assimilation, effect of surrounding on perceived color difference, the effect of contrast and color on visibility and readability, and so on all important producing good and pleasing pictures in the Internet and other media. Further items covered by the e-book, with a very short description of each, are listed here. 2.1 THE COLOR STIMULUS – OPTICAL RADIATION Questions covered in this section are the fundamentals of radiometry, sources of radiation (man-made and artificial), reflection, refraction, transmission, luminescence. 2.2 COLOR PERCEPTION Physiology and psychology of color vision: the measurement of color with emphasis on the CIE System of colorimetry; the colorimetric observers; measurement of self luminous objects (for example, light sources and monitors) as well as of secondary sources, that is, reflecting and other substances; color difference evaluation and chromatic adaptation effects. The Section ends with an introduction to the now so very much investigated color appearance models and an outlook on their usability in color rendering studies. 75
L E U K O S
V O L
4
N O
1
J U L Y
2 0 0 7
P A G E S
7 1 – 8 2
2.3 COLOR ATLASES AND SPACES This section gives a short introduction to the development of this artistic and designer tool of colorimetry, to be able to bridge the gap between numeric color measurement (CIE system of colorimetry) and the designer’s tool, the color atlas. Therefore we show also, for example, the similarity of the color tree in Munsell notation and the CIELAB color space, see Fig. 4. Fig. 4. Munsell (a.) and CIELAB (b.) color solid.
2.4 DETERMINATION OF COLORIMETRIC PROPERTIES In this section we deal with the measurement of color of different objects used in color reproduction. Thus the colorimetry (and spectroradiometry) of light sources is covered, but not only that of traditional sources, but also of some modern light sources, as for example, light emitting diodes (LEDs), which have increased importance both as signal colors and elements of large-area displays. Here we compare their properties with that of other sources, and point out, for example, their temperature sensitivity (Schanda 2001), see Fig. 5, since in both applications this is a critical factor. Fig. 5. Change of spectral power distribution with temperature of a green LED.
Other color producing equipment are dealt with too. Thus for example, cathode ray tube and liquid crystal displays, and a further extension is under construction dealing with colorimetric properties of organic LEDs (here the
76
L E U K O S
V O L
4
N O
1
J U L Y
2 0 0 7
P A G E S
7 1 – 8 2
e-book construction shows its advantages compared with a traditional treatise, where it is very difficult to include new chapters without re-writing and editing the book). Questions relating to secondary colorimetric sources (for example, reflecting materials) are also covered. Here again our emphasis is on the colorimetric properties of printers and similar equipment – and of the pictures produced by using them – and not of the traditional textile and paint coloration, as we have in mind to provide the necessary information for those who would like, for example, print their colored photographs with their ink-jet printer. Again we have had to compromise between the cook-book approach of the very simple booklets provided by the equipment manufacturers for the general public and the tutorials written for graphic arts students. 2.5 COLOR MEASURING EQUIPMENT – COLOR INPUT DEVICES After a short introduction to the fundamentals how photoelectric converters (photovoltaic cells, photoelectric multipliers, CCD cameras, etc.) work, we deal with the characterization of tristimulus colorimeters and spectroradiometers (both traditional ones using moving dispersion elements and those built with line sensing cameras). Again emphasis is on the usage of the equipment; their advantages and disadvantages. There are many different tristimulus and array type instruments on the market showing remarkable reproducibility and electronic performance, but the user is not informed on their limitations. Figure 6 shows, for example, how different results can be obtained from different spectroradiometers, even if they are well calibrated, when employed by the naı¨ve user. Here you see result measured on a green LED with both high-end double monochromator spectrometers and less expensive array type instruments (Schanda, Muray, Kranicz 2001). (The red signs labeled as NIST are measurement results obtained in the NIST laboratory at Gaithersburg, L1 represents a single monochromator, L2 a double monochromator, in every case measurements were performed with different bandwidths settings.) Fig. 6. Chromaticity of a green emitting LED measured using the different spectroradiometers.
Ample space has been provided for the demonstration what can be obtained using image capturing tristimulus instruments: CCD cameras with tristimulus filters, a technique becoming very attractive if coupled to sufficiently powerful PC computers or work-stations. The section discusses also the calibration and use of scanners as colorimetric input devices.
77
L E U K O S
V O L
4
N O
1
J U L Y
2 0 0 7
P A G E S
7 1 – 8 2
2.6 STRUCTURING AND PROVIDING BACKGROUND INFORMATION Reading text in an electronic medium is more difficult then in a traditional book. An e-book has to provide a number of advantages compared to a paper version to be attractive. Some of the advantages will be shown in the next section, dealing with interactivity, but other advantages are also provided: hyperlinks enable rapid access of other parts, a powerful search engine enables students to find subjects they are presently interested in. The material of the tutorial is structured in such a way that one can read only the basics (necessary, for example, in an undergraduate course), but buttons are placed at places where further reading or explanatory figures and animations can help to acquire a deeper understanding. We have tried to keep the basic part of the tutorial simple, using wellunderstood everyday language. But students can and should find the exact definitions; this is obtained by highlighting the technical term and by clicking on these the exact definition is displayed in a window.
3 EXAMPLES OF INTERACTIVE USE OF COMPUTER CAPABILITIES IN TEACHING COLORIMETRY The main advantage of the use of an e-book compared to traditional teaching is that in a normal laboratory surrounding one can hardly enable every student to do color matching, color difference evaluation, and other experiments. At most they can make some color mixtures, usually only with paints, that is, using subtractive color mixing. Which is certainly a different process involved in computer monitors. Our interactive multimedia software is easy to use, the animations come up in a pop up window (see Fig. 7). In the electronic presentation we can simulate both additive and subtractive color mixing (see Fig. 8), we can easily set up an experiment for color matching, can simulate demonstrations for Grassmann’s laws, and so on. Figure 9 shows the experiment the student can perform to get a feeling for how a color match is obtained using the three (Red, Green, Blue) channels of a CRT monitor. The color of the left quadrant is set by random generator of the computer. The task of the observer is to match this color stimulus with the stimulus produced in the left quadrant by increasing or decreasing the amount of Red, Green, and Blue stimuli by clicking on the bars below the two quadrants. Further knobs in the display show the R, G, B values of the two quadrants which shows whether the experimenter was able to set the color match or not, one to initialize a new test color, and even one to ask the computer to work as an experimenter and change the three electron-gun intensities to obtain the match. Similar experiments can be performed for example, to demonstrate Grassmann’s additivity law, or to check the ability of the experimenter to see small color differences, demonstrate how this ability changes when the surrounding (background) color is changed, or the physical distance between the samples is changed. Figure 10 shows an additivity experiment: In the upper row the two left-hand fields of C1 and C2 are the colors to be added, and the lower left field shows the color obtained by adding the two additively. If the experimenter adjusts the colors of the two upper right hand fields to get matches with the left hand fields (similar to the simple color match experiment of Fig. 9), the lower left field will change its color to show the additive mix of the upper two. If the experimenter reached color matches in the two upper fields, a color match will be seen in the lower fields.
78
L E U K O S
V O L
4
N O
1
J U L Y
2 0 0 7
P A G E S
7 1 – 8 2
Fig. 7. Clicking on the figure, the animation comes up in a pop up window.
Fig. 8. Illustrating the additive and subtractive color mixing.
79
L E U K O S
Fig. 9. Screen of the monitor for experimenting with color matching.
Fig. 10. Additivity experiment.
80
V O L
4
N O
1
J U L Y
2 0 0 7
P A G E S
7 1 – 8 2
L E U K O S
V O L
4
N O
1
J U L Y
2 0 0 7
P A G E S
7 1 – 8 2
The implementation of further demonstrations and interactive tests for color deficiency are under way, just as automatic tests at the end of every chapter, where students can check how well they understood the explanations.
4 COMPUTER REALIZATION OF THE PROJECT In building the program we had in mind that the main parts should be easily attainable via the internet, thus downloading should not be too long and should be platform independent. Therefore most of the material is in HTML format, this makes changes, introduction of new sections, updating of materials easy. Colorimetric settings of computers might be different, and students will see on their equipment the same colored pictures as provided by the tutor only if the monitor of the student is well calibrated. At the present moment we still have no better solution than that used by some color image handling software (for example, Photoshop), where the user has to use either the default setting of the monitor (sRGB space), or has to try with a very simple and crude approximation to establish the gamma value of the computer monitor. We are working on a simple measuring instrument we could provide with the CD-ROM containing the tutorial and the program running the instrument, by the help of which the user can set the monitor to a default value. There are some animations where Macromedia Director has been used. Unfortunately these files are large and less adapted for Internet use. This is also the reason why we have first developed the CD-ROM version.
5 THE USE OF THE E-BOOK The subjects of the e-book grew out of courses provided at the University of Veszpre´m, Hungary at the Faculty of Computer Science and Informatics. First we built up courses based on contact lectures. But we realized that students had difficulties understanding the fundamentals of colorimetry with the limited demonstrational and visualization possibilities available in the lecture theater. Darkroom space, used to set up visual demonstration experiments, was not adequate for the number of students we had to accommodate. This brought us to the computer simulation solution. First we used downloadable simulation experiments as background information to the direct contact lectures. This has been enlarged – using the manuscript of the course – to the CD-ROM version of the tutorial. This first version was based very much on Macromedia Director scripts, but we realized that this made the presentation less flexible, thus we changed to an html based structure, using Macromedia Director animations only where this programming environment provided better solutions. The CD-ROM based tutorial is still used as a background material for the oral lectures, but it is also an independent source of knowledge and is used by students who do not want to specialize in computer color science to obtain the basic knowledge in the field. The CIE has recently set up a Study Group for Education in Light and Lighting that works by the help of an electronic Mailing List. The group intends to collect material that is available on the Internet or other electronic as well as paper media, organize it according to the different levels of education and for higher education according to the branches of study. We hope that such material will be helpful for educators making their own syllabuses. The tutorial described in this paper is a first experiment in this direction. We see also in its use a big potential 81
L E U K O S
V O L
4
N O
1
J U L Y
2 0 0 7
P A G E S
7 1 – 8 2
possibility, as it bridges the gap between the industry oriented materials supplied by manufacturers and the arts oriented descriptions of color perceptions.
6 SUMMARY In this article we have discussed the advantages an electronic version of a tutorial on color science can have. We have shown on the example of such a tutorial, prepared having computer science and informatics engineers, as main users, in mind, the advantages such an approach can have compared with traditional courses, even in a university setting. We intend to pursue this direction further, enlarging its scope also to other areas of light and lighting.
REFERENCES [CIE] Commission Internationale de l’Eclairage. 2007. Mailing List on Education:
[email protected]. [ICC] Intersociety Color Consortium profile. 2007. available at: www.color.org. last accessed on 17 July 2007. [IEC] International Electrotechnical Commission. 1999. Multimedia systems and equipment. IEC 61966 series of standards prepared by IEC TC 100. Conelly M, Kornelius J, Stehle C. Virtual seminars: Designing ESP translation classes, in MEDIAs res. Available from: http://www.iued.uni-heidelberg.de/institut/abteilung/ englisch/areas/inmediasres/Areas17ESP/12ODL.htm. Last accessed 17 July 2007. Koohang A, Harman K. 2005. Open Source: A metaphor for e-learning. Informing Science Journal. Vol 8, 2005, pp. 75– 86. Available at: http://inform.nu/Articles/Vol8/ v8p075– 086Kooh.pdf. Last accessed 17 July 2007. Lopategui E. Enhancing higher education teaching for the exercise science and health: trends and developments using instructional computing. Available at: http://www.saludmed.com/Informat/Multimed/mm_educ.html. Last accessed on 17 July 2007. Sarker S, Nicholson J. 2006. Open Source: A metaphor for e-learning. Informing Science Journal. Vol 8, pp 55–73. Available at: http://inform.nu/Articles/Vol8/ v8p055– 073Sarker.pdf. Last accessed 17 July 2007. Schanda J, Muray K, Kra´nicz B. 2001. LED colorimetry. In: AIC Conference Proceedings. Rochester, 2001. Schanda J, Schanda G, Muray K. 2001. Light emitting diode standards. In: CIE 2nd LED Measurement Symposium. Gaithersburg, 2001. Schanda J, Sik La´nyi C, Kosztya´n Zs. 2002. Using computers in color education. In: MIPRO 2002. Opatija. May 20 –24 2002. pp. 68 –71. Schanda J, Sik La´nyi C, Kosztya´n Zs. 2002. Using e-teaching in color science. In: International Conference on Advances in Infrastructure for Electronic Business, Education, Science and Medicine on the Internet. L’Aquilla. January 21–27 2002.
82